Publisher’s version / Version de l'éditeur:
Fuel, 70, 1, pp. 78-83, 1991-01
READ THESE TERMS AND CONDITIONS CAREFULLY BEFORE USING THIS WEBSITE. https://nrc-publications.canada.ca/eng/copyright
Vous avez des questions? Nous pouvons vous aider. Pour communiquer directement avec un auteur, consultez la
première page de la revue dans laquelle son article a été publié afin de trouver ses coordonnées. Si vous n’arrivez pas à les repérer, communiquez avec nous à PublicationsArchive-ArchivesPublications@nrc-cnrc.gc.ca.
Questions? Contact the NRC Publications Archive team at
PublicationsArchive-ArchivesPublications@nrc-cnrc.gc.ca. If you wish to email the authors directly, please see the first page of the publication for their contact information.
NRC Publications Archive
Archives des publications du CNRC
This publication could be one of several versions: author’s original, accepted manuscript or the publisher’s version. / La version de cette publication peut être l’une des suivantes : la version prépublication de l’auteur, la version acceptée du manuscrit ou la version de l’éditeur.
For the publisher’s version, please access the DOI link below./ Pour consulter la version de l’éditeur, utilisez le lien DOI ci-dessous.
https://doi.org/10.1016/0016-2361(91)90098-U
Access and use of this website and the material on it are subject to the Terms and Conditions set forth at
Characterization of solvent-insoluble organic matter isolated from
Alberta oil sands
Majid, Abdul; Sparks, Bryan D.; Ripmeester, John A.
https://publications-cnrc.canada.ca/fra/droits
L’accès à ce site Web et l’utilisation de son contenu sont assujettis aux conditions présentées dans le site LISEZ CES CONDITIONS ATTENTIVEMENT AVANT D’UTILISER CE SITE WEB.
NRC Publications Record / Notice d'Archives des publications de CNRC:
https://nrc-publications.canada.ca/eng/view/object/?id=17208b04-b5a8-4722-aa42-3e71abb54d2a
https://publications-cnrc.canada.ca/fra/voir/objet/?id=17208b04-b5a8-4722-aa42-3e71abb54d2a
Characterization
of solvent-insoluble
organic
matter
isolated
from Alberta
oil
sands*
Abdul Majid,
Bryan D. Sparks and J. A. Ripmeester
zyxwvutsrqponmlkjihgfedcbaZYXWVUTSRQPONMLKJIHGFEDCBA
Institute for Environmental Chemistry , National Research Council of Canada, Ottawa, Ontario, Canada KlA OR9
(Received 3 February 7990; revised 17 September 7990)
Considerable quantities of organic material, insoluble in common organic solvents, are known to be associated with the inorganic minerals present in oil sands. This insoluble organic matter (IOM) consists of both humic and non-humic components containing numerous oxygen functions. In this investigation IOM was beneficiated from a number of feedstocks using HCl/HF mineral dissolution techniques normally used for the isolation of kerogen concentrate from oil shales. The feedstocks included two different grades of Athabasca oil sand, three tailings stream fractions from oil sand plants in Alberta, and a sample of New Brunswick oil shale. The various fractions were analysed for elemental composition and then characterized by infrared and CP/MAS 13C n.m.r. methods. The elemental analyses have been discussed in terms of a van Krevelen diagram by plotting H/C atomic ratios against O/C atomic ratios. N.m.r. data have been
used to calculate the aromaticities of various fractions.
(Keywords: oil sand; sedimentology; organic matter)
Considerable quantities of organic material, insoluble in common organic solvents, are known to be associated with the inorganic minerals present in oil sandslm6. Most of this insoluble organic matter (IOM) is strongly associated with the fines fractions of the solids3. This organic matter is known to consist of humic and non-humic components containing numerous oxygen functions4-7. In previous work, IOM from a number of oil sands tailings streams has been isolated and characterized2p6. Based on the comparison of IOM with peat, coal, humic acids, and asphaltenes from oil sand bitumen, it was concluded that the maturity of this material was comparable with that of the humic acids from lignite or subbituminous coals, and that it was relatively immature when considered in light of its oil generation potential.
In an attempt to assess the geochemical relevance of IOM to oil sands, material was isolated from various samples of oil sands and tailings streams. The TOM fractions were then studied using elemental analyses and spectroscopic techniques. It is hoped that this study will be helpful in understanding the origins of oil sands as well as providing insight into the intractable nature of oil sand slimes during the sludge formation process in existing tailings ponds.
EXPERIMENTAL M aterials
Table 1 describes the various feedstocks that were treated to extract the insoluble organic matter (IOM) components. Oil sand samples were obtained from the Alberta Research Council sample bank. The samples of Syncrude centrifuge tailings and sludge pond tailings were provided by Syncrude Canada Ltd. Oil phase solids *Based on NRCC No. 32514
001~2361/91/010078~6
0 1991 Butterworth-Heinemann Ltd.
78
zyxwvutsrqponmlkjihgfedcbaZYXWVUTSRQPONMLKJIHGFEDCBA
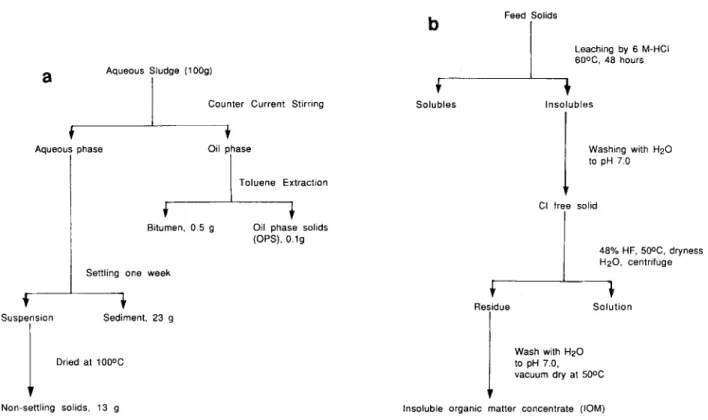
FUEL, 1991, Vol 70, January(OPS), the heavy metal minerals fraction containing unextractable organic matter, were isolated from Suncor sludge using an oil phase agglomeration technique reported elsewhere 4-5 A sample of New Brunswick . oil shale, for the isolation of kerogen, was obtained from D. Abbott of the New Brunswick Research and Productivity Council. Non-settling solids from Syncrude sludge pond tailings were obtained according to the scheme shown in Figure la.
Isolation of insoluble organic matter (IO M )
To isolate IOM from various feedstocks, the inorganic matrix was selectively dissolved in HCl/HF. The general procedure for mineral dissolution and isolation of the IOM is shown in Figure lb.
Elemental analy sis
C, H and N analyses were performed, and sulphur was analysed as total sulphur, using X-ray fluorescence spectroscopy. Oxygen was determined either by difference or directly*. Chlorine was analysed using the Volhard technique and fluorine by the Alzarine fluorine blue method9,‘0. Heavy metals were determined by a quantitative, inductively coupled plasma atomic emission spectroscopic method (ICP-AES)“. The ash content of the humic matter fractions was determinedI at 400f 10°C.
Instrumental analy sis
Solid state 13C n.m.r. spectra were obtained at 22.6 MHz using the cross-polarization (CP) technique with magic angle spinning (MAS). A contact time of 1 ms and a repetition time of 2 s were used at MAS speeds of 3.0-3.4 kHz. Chemical shifts were determined by substitution relative to tetramethylsilane (TMS). Each spectrum was the Fourier transform of 300&10000
Characterization of solvent-insoluble organic matter from Alberta oil sands: A. Majid et al. Table 1 Sample description and analysis of feed materials
Analyses (wt% dry basis)
Sample
no. Feedstock Description
Fines (<38pm) Bitumen Loss on ignition at 400°C” Organic carbon”
1 OS-1 Low grade oil sands sample lb 32 3.5 1.30 1 .o
2 OS-2 Low grade oil sands sample 2b 22 8.3 1.20 0.9
3 SCT Syncrude centrifuge tailings 15 5.5 18.0 11.1
4 NSSSS Non-settling solids from Syncrude sludge’ 100 2.9 16.3 5.15
5 OPSd Oil phase solids 0 32.5 19.3
6 NBOS New Brunswick oil shaes 66 1.1’ 10.5 5.4
a Of toluene extracted dry feed
*Samples were from Suncor Mine sites; Section 23, Township 92, range 10, west of Fort Meridian. Sample 1 was 5% overburden bench while sample 2 was 7% mining bench
‘See Fiyure I
d Oil phase solids, Figure 1 (Refs. 4 and 5)
‘Although most of the organic matter associated with NBOS is kerogen, a small part dissolves in benzene
a
Aqueous Sludge (1009)I
j Co;’ Current Stirring f
Aqueous phase Oil phase
1 Toluene Eyion c
Bitumen, 0 5 g Oil phase solids (OPS). 0.1g / Settling;e week , Suspension Sediment, 23 g i Feed Solids I
I
Leaching by 6 M-XI 6OoC. 48 hours f I4
Solubles Insolubles Washing with H20 to pH 7.0 Cl free solidI
46% HF, 5OoC, dryness H20. centrifuge f Residue I4
SolutionI
Wash with Hz0 Dried at 100% to pH 7.0, vacuum dry at 50%Non-settling solids, 13 g Insoluble organic matter concentrate (IOM)
Figure 1 a, Flow sheet for the fractionation of aqueous sludge; b, mineral dissolution scheme for the concentration of IOM by successive acid leaching
free-induction decay curves. For a few samples, a dipolar dephasing techniquei was also used to distinguish the non-protonated carbons (except groups in motion, e.g. CH,) from those attached to hydrogens. Infrared spectra were recorded with samples run as KBr pellets. These spectra were used only qualitatively for quick identification of general features and the presence or absence of functional groups.
RESULTS AND DISCUSSION
Recently, an HCl/HF mineral dissolution scheme, commonly used for the isolation of kerogen concentrates from oil shales, has been applied to the beneficiation of insoluble organic matter (IOM) from oil sands4. A major portion of the mineral matter in most samples was dissolved
by HF, as indicated by the low ash content of the resulting organic residues OS-2, SCT, NSSS and OPS. However, the extent of mineral dissolution varied considerably for the different starting materials. In general, non-settling solids from Syncrude sludge and OPS samples gave organic residues with low ash. The mineral matter associated with oil sand samples, Syncrude centrifuge tailings, and oil shale were the most resistant to acid treatment.
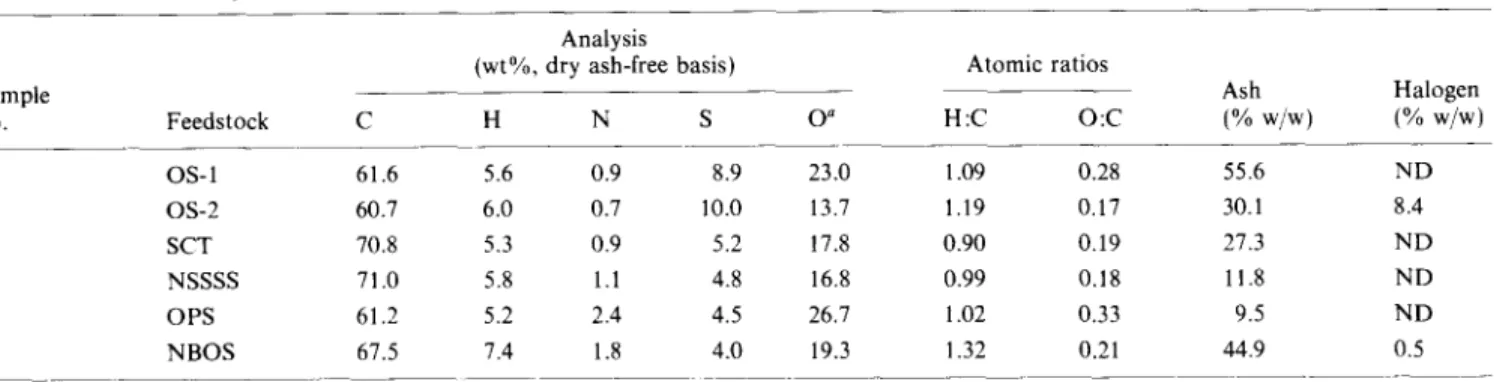
Table 2 lists the elemental compositions of IOM from the various samples. There was considerable variation in the elemental composition of the concentrated IOM fractions. However, a few trends were obvious from examination of the data.
1. IOM obtained from the demineralization of the three oil sand samples and OPS had the lowest carbon
content.
zyxwvutsrqponmlkjihgfedcbaZYXWVUTSRQPONMLKJIHGFEDCBA
Characterization of solvent-insoluble organic matter from Alberta oil sands: A. Majid et al. Table 2 Elemental analyses and atomic ratios of IOM from various feedstocks
Sample no. Feedstock 1 OS-1 2 OS-2 3 SCT 4 NSSSS 5 OPS 6 NBOS ’ By difference ND = Not determined Analysis (wt%, dry ash-free basis)
C H N s .~~ 61.6 5.6 0.9 8.9 60.7 6.0 0.7 10.0 70.8 5.3 0.9 5.2 71.0 5.8 1.1 4.8 61.2 5.2 2.4 4.5 67.5 7.4 1.8 4.0
Demineralized oil shale samples had the highest hydrogen contents.
Demineralized sample OS-2 had the lowest nitrogen content, followed by OS-l, CT, and non-settlng solids. The IOM from OPS and NBOS had the highest nitrogen contents. These differences might be due to the presence of nitrogen functionalities having different resistances to acid hydrolysis.
Sulphur contents of IOM from oil sands were almost double the sulphur contents of all other samples. There was also considerable variation in the oxygen content of IOM fractions from different feedstocks. Although the oxygen content was determined by difference and contained all accumulated errors, the magnitude of the difference between the various IOM fractions suggests that a substantial amount of oxygen might have been lost from some of the fractions during acid treatment. This is consistent with published reports that suggest the loss of oxygen by acid catalysed decarboxylation reactions during the isolation of sedimentary humic acid fractions using HF14.
Considerable quantities of halogens were also detected in some IOM fractions. This suggests that the organic matter associated with these feedstocks might have undergone chemical interaction with HCl/HF. It is well established that certain organic compounds react readily with both hydrochloric and hydrofluoric acids, resulting in alteration of their chemical/physical properties. For example, esters, amides, olelins, quinones and alcohols undergo various hydrolysis, addition, and alkyl halide formation reactions in the presence of HCl ‘5-l 6 In the case of HF, condensation . reactions involving olelins and aromatic compounds occur readily 16. The high halogen concentrations in the IOM fractions could also be the result of contamination by neoformed fluorides, formed during the demineralization process”.
van Krevelen diagrams, which are plots of atomic H/C versus O/C ratios, provide a useful approach for the
characterization of coals, kerogens and humic matter’ *sl 9.
zyxwvutsrqponmlkjihgfedcbaZYXWVUTSRQPONMLKJIHGFEDCBA
Figure 2 is the van Krevelen diagram for the IOM
fractions derived from the various samples. IOM from oil sands and tailings streams all fall in the region of type III kerogen, while the sample from New Brunswick oil shale is in the type II kerogen region on this diagram. Organic matter of type III kerogens is usually derived from plants of terrestrial origin and is rich in polyaromatic nuclei and heteroatomic ketone and
Atomic ratios Ash 0” H:C 0:c (% w/w) 23.0 1.09 0.28 55.6 13.7 1.19 0.17 30.1 17.8 0.90 0.19 27.3 16.8 0.99 0.18 11.8 26.1 1.02 0.33 9.5 19.3 1.32 0.21 44.9 -____ __~~_
zyxwvutsrqponmlkjihgfedcbaZYXWVUTSRQPONMLKJIHGFEDCBA
1.5 Halogen (% w/w) ND 8.4 ND ND ND 0.5 I I I I I I IJ
0 0.1 0.2 0.3 0.4 0.5Atomic O/C Ratio
Figure 2 van Krevelen diagram
carboxylic acid groups l8 This type of organic matter is . not considered to have any potential for hydrocarbon generation and usually matures to give coal18. It is comparable in maturity to humic acids from lignite or subbituminous coals and is relatively immature when considered in light of its oil generation potentia16.
The van Krevelen diagram provides a practical interpretation for elemental analysis data; however, it must be emphasized that the IOM analysed was obtained by the destruction of the mineral phase through acid hydrolysis. This treatment might have changed the elemental composition of the IOM to the extent that it is no longer representative of the original organic matter. Also, the IOM is a mixture of humic and non-humic matter such as kerogen4. This is supported by the fact that there were considerable variations in the elemental compositions of the IOM from the different samples. As a result of these limitations, the elemental analysis results should be interpreted with caution. It appears that, in addition to the humic matter, part of the organic matter may have been incorporated into the sediment through a different pathway not involving the fulvic or humic acid stage.
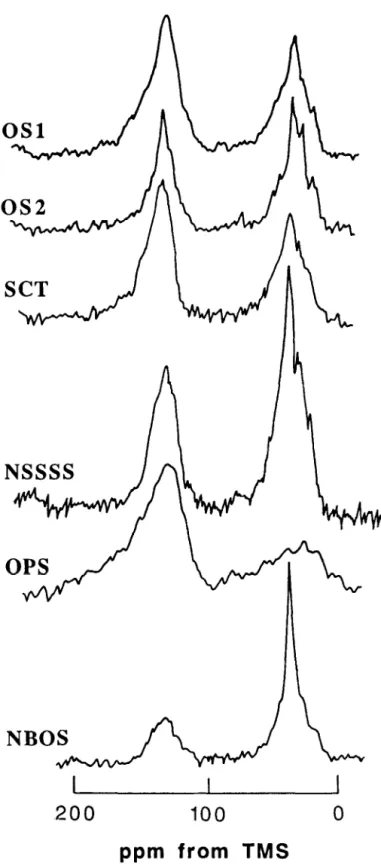
13C n.m.r. spectra
13C CP/MAS n.m.r. spectra of IOM fractions from various feedstocks are shown in Figure 3. All spectra show a broad resonance in the aromatic region (1 l&150 ppm), but a considerable amount of line
Characterization of solvent- insoluble organic matter from Alberta oil sands: A. M ajid et al.
200
100
zyxwvutsrqponmlkjihgfedcbaZYXWVUTSRQPONMLKJIHGFEDCBA
0
ppm from TMS
Figure 3 13C MAS n.m.r. spectra of IOM fractions from various feedstocks shown in Table I
structure can be seen in the aliphatic regions of all spectra (except those for demineralized oil shale samples). Distinguishable peaks for carbohydrates (= 75 ppm) are only present in the spectrum of the sample from oil sand-2. Non-settling solids from Syncrude sludge, oil sands sample- 1, and OPS samples show a broad resonance in this region.
All spectra show a relatively intense and broad signal for aromatic carbons (110-l 50 ppm). The relative intensity of this signal indicates that a large proportion
of the aromatic rings are not substituted by strong electron-donating substituents such as oxygen and nitrogen. The chemical shift region for aromatic carbons substituted by 0 and N functions groups (e.g. -OCH,, -OH, -OR, -NH,) lies between 150-165 ppm. None of the samples shows a well defined peak in this region, although OS-l, SCT and OPS samples show some broad resonance.
Carboxylic, amide and ester carbons did not appear to be important components of these samples as none of the spectra showed any distinct, resolved peak between
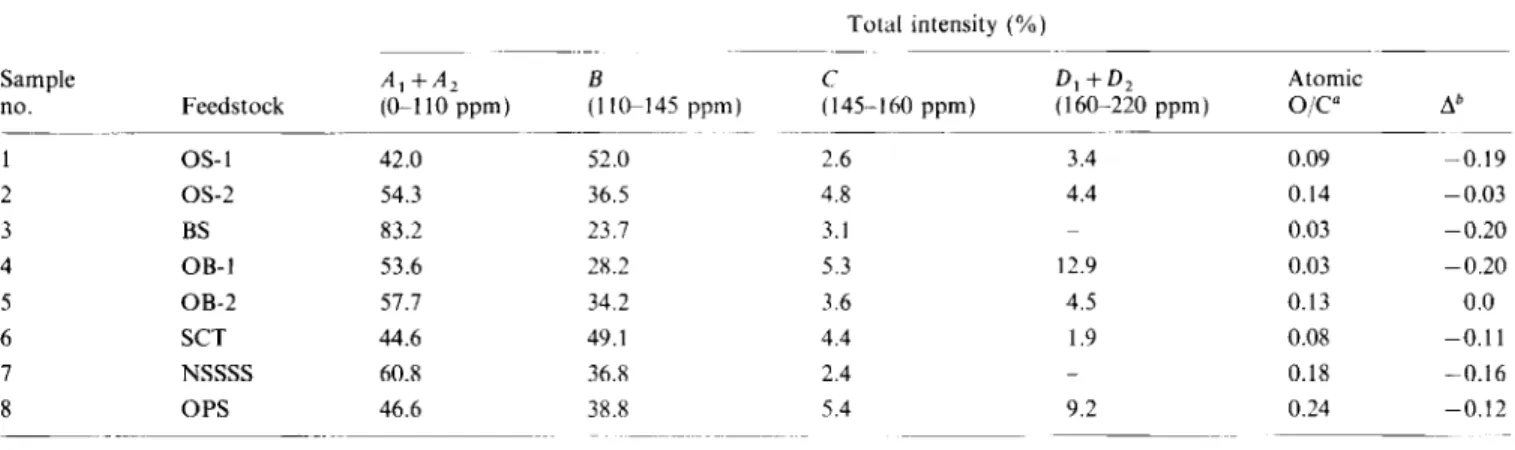
169 and 190 ppm. However, the spectrum for OPS did show a weak, broad resonance in this region. Table 3 gives the r3C chemical shift range assignments. Table 4 lists the percentage compositions of the various regions shown in Table 3. It is obvious from these data that there is a wide variation in the distribution of various carbon types for acid demineralized feedstocks. The paraffinic and aromatic carbons contributed 37-61% and 3652% respectively of the total carbons in these samples. The amounts of carbohydrate, phenolic and carboxylic carbons were 3-l l%, 2-5% and &9%, respectively.
The O/C ratios calculated from ‘jC n.m.r. were smaller than those calculated from the elemental analyses. This suggested that the IOM associated with these samples contained ether or alcoholic oxygen groups rather than carboxyl and phenolic. The total contribution of these aliphatic oxygen functions to the IOM structures could not be estimated because of the possibility of errors in the elemental analysis4. Also the high ash content of these samples could result in a large contribution from the inorganic or mineral components20. Oxygen in most of these samples has been determined by difference so that all analytical errors accumulated in the result for this element.
The aromaticities Yg) calculated from the integrated areas of the 13C n.m.r. spectra are listed in Table 5. The aromaticity values for bitumen, asphaltenes and humic acid samples from coal, soil and oil sands are also included for comparison. It is obvious from comparison of these data that the oil sand and tailings samples have aromaticity values greater than the values for soil humic acids and oil shale kerogens (acid demineralized New Brunswick oil shale). Two oil sand samples, and OPS and SCT samples, have aromaticity values comparable to the values for humic acids from oil sands and subbituminous coal. The non-settling solids from Syncrude sludge have a much lower aromaticity, which is comparable to the value for asphaltenes from oil sands bitumen. This suggests that the organic matter associated with the non-settling solids from Syncrude sludge could be structurally different from the IOM associated with the bulk of the solids from oil sands.
Table 3 Assignment of 13C chemical shift ranges Chemical shift Region range (ppm) A, IS50 A, S&l 10 B I IO-145 c 145-160 D, 16G190 D, I9G230 ~__ Carbon type Aliphatic
Aliphatic C-OH, C-OR, carbohydrate
Aromatic C-H, aromatic C-C, alkyl substituted aromatic carbon Aromatic C-OH, C-OR Acid, ester, COOH, COOR Aldehyde, ketone
Characterization of solvent-insoluble organic matter from Alberta oil sands: A. Majid et al Table 4 Relative intensities for various regions of the 13C n.m.r. spectra of acid-demineralized feedstocks
Sample A, +A,
no. Feedstock (O-110 ppm)
1 OS-1 42.0 2 OS-2 54.3 3 BS 83.2 4 OB-I 53.6 5 OB-2 57.7 6 SCT 44.6 7 NSSSS 60.8 8 OPS 46.6 ~0/c=(c+20,)/100
‘A = (O/C ’ % n.m.r.t(O/C elemental analysis)
B
c
D,+D, Atomic (I lGI45 ppm) (145.-160 ppm) (160-220 ppm) o/c0 Ab 52.0 2.6 3.4 0.09 -0.19 36.5 4.8 4.4 0.14 -0.03 23.7 3.1 0.03 -0.20 28.2 5.3 12.9 0.03 -0.20 34.2 3.6 4.5 0.13 0.0 49.1 4.4 1.9 0.08 -0.11 36.8 2.4 _ 0.18 -0.16 38.8 5.4 9.2 0.24 -0.12Table 5 Aromaticites of insoluble organic matter fractions Sample
no. Feedstock
./a
1 OS-1 0.57 2 OS-2 0.51 3 SCT 0.55 4 NSSSS 0.40 5 OPS 0.53 6 NBOS 0.28
7 Oil sands humic acids” 0.51
8 Humic acids from subbituminous coal 0.59
9 Soil humic acids 0.35
10 Oil sands bitumen 0.30
I1 Ashpaltenes from oil sands bitumen 0.42
a Data from Ref. 4
The aromaticity has been plotted against H/C and O/C atomic ratios in Figure 4. Considering the limitations of n.m.r. measurements and elemental analysis, a fairly good correlation between increased aromaticity and increased O/C and decreased H/C ratios is obvious when the data point for New Brunswick oil shale is excluded. Similar correlations have been reported for coals”.
Injkwed spectra
The infrared spectra of IOM fractions from the various samples are shown in Figure 5. The assignment of the various bands in the infrared spectra is based on published work for coal, asphaltenes and humic materials22P30. The main zones of interest are as follows:
1.
2. 3.
4.
5.
a broad absorption band around 3200-3400 cm ’ is related to H-bonded OH groups (phenolic, alcoholic, carboxylic OH), while small contributions from N--H groups are also possible;
weak to strong absorptions in the z 2900 cm _ ’ region are attributed to CH, and CH, aliphatic groups; a medium to strong intensity band around 1700- 1730 cm-’ is related to various C=O groups (ketones, acids, esters);
a weak to medium-intensity band, centred at 1600 cm- ‘, is attributed partly to conjugated C=C bonds and partly to the carbonyl groups of ketones and/or quinones;
varying intensity bands at 1450 and 1380 cm- ’ are due to bending frequencies of asymmetric C-CH, bonds and/or methylene and symmetric C-CH, bonds, respectively;
Atomic O/C Ratio
0.20 0.25
0.6
0.9 1.0
zyxwvutsrqponmlkjihgfedcbaZYXWVUTSRQPONMLKJIHGFEDCBA
1.1 1.2Atomic WC Ratio
1.3 1.4
Figure 4 Aromaticity versus H/C and O/C ratios for acid demineralized feedstocks: 0, H/C; W, O/C
cm-’
Figure 5 Infrared spectra of acid-demineralized feedstocks
Characterization of solvent-insoluble organic matter from Alberta oil sands: A. Majid et al. 6. a group of bands located in the 1300-900 cm-’ region
is assigned to C-O stretch in aromatic oxygenated compounds such as aromatic ethers, sulphoxides and polysaccharides: some of the strong absorptions in this region could be due to retained mineral matter or insoluble fluorides formed with retained calcium during demineralization.
The basic features of the infrared spectra were similar; however, for various samples, the relative intensities of infrared bands varied considerably. The most striking differences can be summarized as follows. The intensities of the bands at 2850-2930, 1460 and 1380 cm-’ suggest a considerable variation in the content of aliphatic CH components in the IOM fractions from different samples. Oil sands sample-2 and NBOS samples had the highest aliphatic CH components, which is consistent with the higher H/C elemental ratios for these samples.
The intensity of the absorption band around 1700 cm ’ also varied considerably. Strong absorptions in this region were only observed for OS-l and the OPS sample. All other samples had weak absorptions in this region. The differences in intensity of the absorption in this region could reflect the different degrees of decarboxylation of IOM fractions as a result of HCl/HF treatment. Some data in the literature indicate that a weaker absorption around 1700 cm- ’ might be caused not only by a lower number of carboxyl groups but by the presence of carboxylate ions29. Another striking difference in these spectra is the relatively sharper absorptions in the 100&1500 cm- ’ region for the OS-2 sample compared with the much broader absorptions for all other samples.
CONCLUSIONS
The effectiveness of the acid demineralization technique for the beneliciation of IOM from different reservoir matrices varies considerably. Elemental analysis results for demineralized feedstocks suggested that HCl/HF reacts with IOM, possibly via decarboxylation. A plot of the H/C versus O/C atomic ratios for IOM fractions from various feedstocks suggests that most of the data fall in the type III kerogen region. Based on the values of carbon aromaticities, the IOM associated with the various samples investigated appears to be comparable in maturity to the subbituminous coals. Considering the limitations of n.m.r. measurements and elemental analysis results, there is a fairly good correlation between increased aromaticity and increased O/C and decreased H/C ratios. Although the basic features of the infrared spectra of IOM from different feedstocks were similar, the relative intensities of infrared bands varied considerably for the different samples. These variations could reflect different degrees of attack by HCl/HF. In establishing the relationship between the different types of IOM, the limitations of the isolation techniques in conjunction with uncertainties in elemental and spectro-
scopic analyses in the presence of mineral matter should be realized.
ACKNOWLEDGEMENTS
The work summarized in this report includes contri- butions from a number of people. The authors are particularly gratefui to J. R. Seguin and V. Clancy for elemental analyses and G. J. Gardner for infrared spectra. They would also like to thank R. Schutte of Syncrude Canada Ltd. for providing a sample of sludge pond tailings and for many helpful discussions.
REFERENCES 1 2 7 8 9 IO 11 12 13 14 15 16 17 18 19 20 21 22 23 24 25 26 27 28 29 30
Kessick, M. A. J. Can. Pet. Techn. 1979, 71, 49
Majid, A., Ripmeester, J. A. and Davidson, D. W. NRC Chemistry Division Report No. C1095582S, 1982
Majid, A., Sirianni, A. F. and Ripmeester, J. A. Fuel 1982,61,477 Majid, A. and Ripmeester, J. A. Fuel 1986, 65, 1714 Majid, A., Sparks, B. D. and Ripmeester, J. A. Fuel 1990,69,145 Majid, A. and Ripmeester, J. A. ‘Metal complexes in fossil fuels: geochemistry, characterization and processing’, Am. Chem. Sot. Symp. Ser. 344, 1987, p. 290
Ignasiak, T. M., Zhang, Q., Kratochvil, B. it ul. AOSTRA J. Res. 1985, 2, 21
Culmo, R. Mikrochimicu Acfa 1968, 811
Swift, E. H., Arcand, G. M., Lutwack, R. and Meier, D. J. And.
Chem. 1950, 22, 306
Johnson, C. A. and Leonard, M. A. Anuiyst 1961, 86, 101 Fassel, V. A. And. Chem. 1979, 51, 1290A
Majid, A. and Sparks, B. D. Fuel 1983,62, 772
Weinberg, V. L., Yen, T. F., Gerstein, B. C. and Murphy, P. D.
Am. Chem. Sot. Dia. Pet. Chem. Prepr. 1981, 26, 816
Haddad, R. I., Rohrbach, B. G. and Kaplan, I. R. in ‘Facets of Modern Biogeochemistry’ (Eds. V. Ittekot, S. Kempt, W. Michaelis and A. Spitzy), Springer Verlag, Berlin, FRG, 1990, p. 416 Fieser, L. F. and Fieser, M. in ‘Organic Chemistry’ 3rd edition, Reinhold, New York, USA, 1956, p. I1 12
Hickinbottom, W. J. in ‘Reactions of Organic Compounds’ 3rd edition, Longmans, London, UK, 1957, p. 608
Durand, B. and Nicaise, G. in ‘Kerogen’ (Ed. B. Durand), Editions Technip, Paris, France, 1980
Tissot, B. P. and Welte, D. H. in ‘Petroleum Formation and Occurrence’, Springer-Verlag, New York, USA, 1984 van Krevelen, D. W. in ‘Coal’, Elsevier, Amsterdam, The Netherlands, 1961
Milkins, F. P. ‘Proc. Institute of Gas Techn. Symp. Fuels from Oil Shales’, 1979, p. 245
Axelson, D. E. Fuel Proc. Technol. 1987, 16, 257
Friedel, R. A. and Queiser, J. A. And. Chem. 1956, 28, 22 Friedel, R. A. and Retcofsky, H. L. in ‘Spectrometry of Fuels’ (Ed. R. A. Friedel), Plenum, New York, USA, 1970, pp. 4649 Taylor, S. R., Galya, L. G., Brown, B. J. and Li, L. C.
Spectroscopy Leti. 1976, 9(1 l), 733
Wiberly, S. E. and Gonzalez, R. D. Appl. Spec. 1961, 15, 174 Moschopedis, S. E. and Speight, J. G. Fuel 1976, 55, 334 Jenning, P. W., Pribanic, J. A. S., Dawson, K. R. and Bircca, C. E. Am. Chem. Sot. Div. Pet. Chem. Prepr. 1981,915 Bellamy. L. J. in ‘The infrared spectra of complex organic molecules’, John Wilev and Sons Inc.. New York. USA. 1966 Stevenson, J. and Gob: K. M. Geochim. Co.wwchim. Acta 1971, 35,471
Gerasimowicz, W. V. and Byler, D. M. Soil Science 1985, 139,
270