HAL Id: hal-02167448
https://hal.archives-ouvertes.fr/hal-02167448
Submitted on 27 Jun 2019
HAL is a multi-disciplinary open access
archive for the deposit and dissemination of
sci-entific research documents, whether they are
pub-lished or not. The documents may come from
teaching and research institutions in France or
abroad, or from public or private research centers.
L’archive ouverte pluridisciplinaire HAL, est
destinée au dépôt et à la diffusion de documents
scientifiques de niveau recherche, publiés ou non,
émanant des établissements d’enseignement et de
recherche français ou étrangers, des laboratoires
publics ou privés.
or early-stage lung cancer: common mechanisms at work
Julien Aniort, Alexandre Stella, Carole Philipponnet, Anaïs Poyet, Cécile
Polge, Agnes Claustre, Lydie Combaret, Daniel Béchet, Didier Attaix,
Stéphane Boisgard, et al.
To cite this version:
Julien Aniort, Alexandre Stella, Carole Philipponnet, Anaïs Poyet, Cécile Polge, et al.. Muscle wasting
in patients with end-stage renal disease or early-stage lung cancer: common mechanisms at work.
Journal of Cachexia, Sarcopenia and Muscle, Wiley Open Access/Springer Verlag, 2019, 10 (2),
pp.323-337. �10.1002/jcsm.12376�. �hal-02167448�
Muscle wasting in patients with end-stage renal
disease or early-stage lung cancer: common
mechanisms at work
Julien Aniort1,2, Alexandre Stella3, Carole Philipponnet1,2, Anais Poyet1,4, Cécile Polge1, Agnès Claustre1, Lydie Combaret1, Daniel Béchet1, Didier Attaix1, Stéphane Boisgard5, Marc Filaire6, Eugénio Rosset7, Odile Burlet-Schiltz3, Anne-Elisabeth Heng1,2& Daniel Taillandier1*
1INRA, Université Clermont Auvergne, UMR1019, Human Nutrition Unit (UNH), CNRH Auvergne (Centre de Recherche en Nutrition Humaine d’Auvergne), Clermont-Ferrand,
France,2Nephrology, Dialysis and Transplantation Department, Gabriel Montpied University Hospital, University Hospital of Clermont-Ferrand, Clermont-Ferrand, France,
3Institut de Pharmacologie et de Biologie Structurale, Université de Toulouse, Centre National de la Recherche Scientifique, Université Paul Sabatier, France,4Nephrology
Department, Hospital of Roanne, Roanne, France,5Orthopedic Surgery Department, Gabriel Montpied University Hospital, University Hospital of Clermont-Ferrand, Clermont-Ferrand, France,6Thoracic Surgery Department, Gabriel Montpied University Hospital, University Hospital of Clermont-Ferrand, Clermont-Ferrand, France,
7Vascular Surgery Department, Gabriel Montpied University Hospital, University Hospital of Clermont-Ferrand, Clermont-Ferrand, France
Abstract
Background Loss of muscle mass worsens many diseases such as cancer and renal failure, contributes to the frailty syn-drome, and is associated with an increased risk of death. Studies conducted on animal models have revealed the preponderant role of muscle proteolysis and in particular the activation of the ubiquitin proteasome system (UPS). Studies conducted in humans remain scarce, especially within renal deficiency. Whether a shared atrophying programme exists independently of the nature of the disease remains to be established. The aim of this work was to identify common modifications at the transcriptomic level or the proteomic level in atrophying skeletal muscles from cancer and renal failure patients.
Methods Muscle biopsies were performed during scheduled interventions in early-stage (no treatment and no detectable muscle loss) lung cancer (LC), chronic haemodialysis (HD), or healthy (CT) patients (n =7 per group; 86% male; 69.6 ± 11.4, 67.9 ± 8.6, and 70.2 ± 7.9 years P > 0.9 for the CT, LC, and HD groups, respectively). Gene expression of members of the UPS, autophagy, and apoptotic systems was measured by quantitative real-time PCR. A global analysis of the soluble muscle proteome was conducted by shotgun proteomics for investigating the processes altered.
Results We found an increased expression of several UPS and autophagy-related enzymes in both LC and HD patients. The E3 ligases MuRF1 (+56 to 78%, P < 0.01), MAFbx (+68 to 84%, P = 0.02), Hdm2 (+37 to 59%, P = 0.02), and MUSA1/Fbxo30 (+47 to 106%, P = 0.01) and the autophagy-related genes CTPL (+33 to 47%, P = 0.03) and SQSTM1 (+47 to 137%, P< 0.01) were overexpressed. Mass spectrometry identified >1700 proteins, and principal component analysis revealed three differential proteomes that matched to the three groups of patients. Orthogonal partial least square discriminant analysis cre-ated a model, which distinguished the muscles of diseased patients (LC or HD) from those of CT subjects. Proteins that most contributed to the model were selected. Functional analysis revealed up to238 proteins belonging to nine metabolic processes (inflammatory response, proteolysis, cytoskeleton organization, glucose metabolism, muscle contraction, oxidant detoxifica-tion, energy metabolism, fatty acid metabolism, and extracellular matrix) involved in and/or altered by the atrophying pro-gramme in both LC and HD patients. This was confirmed by a co-expression network analysis.
Conclusions We were able to identify highly similar modifications of several metabolic pathways in patients exhibiting dis-eases with different aetiologies (early-stage LC vs. long-term renal failure). This strongly suggests that a common atrophying programme exists independently of the disease in human.
Keywords Proteomics; Skeletal muscle; Proteasome; Autophagy; Renal failure; Cancer
Journal of Cachexia, Sarcopenia and Muscle2019; 10: 323–337
Received:12 July 2018; Accepted: 12 November 2018
*Correspondence to: Daniel Taillandier, INRA, Centre Clermont-Ferrand-Theix, Clermont-Ferrand, France. Tel: +33 4 73 62 48 44; Fax: +33 4 73 62 47 55. Email: daniel.taillandier@inra.fr
Introduction
Loss of muscle mass worsens many diseases (e.g. diabetes, cancer, heart failure, respiratory failure, renal failure, and sepsis), which is known as cachexia.1 Cachexia contributes to the frailty syndrome and is associated with impaired qual-ity of life and increased risk of death whatever the causal disease.2
Cachexia is the consequence of profound changes in the metabolism of skeletal musclefibres.3–5The decrease in mus-cle mass is due to an imbalance in protein synthesis and pro-teolysis in favour of the latter. Activation of propro-teolysis appeared to play a major role in the occurrence of muscle at-rophy for rapid degradation of myofibrillar proteins in numer-ous catabolic models. The ubiquitin proteasome system (UPS) and autophagy are the predominant proteolytic systems in-volved.6–10The UPS is crucial for the atrophying process as it controls both the degradation of contractile proteins and the repression of protein synthesis.8,9 The UPS targets the proteins to be degraded by linking covalently a ubiquitin (Ub) chain to the substrates to be degraded, which enables the26S proteasome to recognize and degrade the targets.11 The Ub chain is catalysed, thanks to an enzymatic cascade (E1, E2, and E3), with E3s that recognize the substrates and E2s that generally bring the catalytic activity. In rodent atrophying muscles, several genes (Ub,26S proteasome sub-units, E2s, E3s, etc.) are up-regulated in most catabolic situa-tions including two muscle-specific E3 ligases, muscle atrophy F-box (MAFbx or atrogin1) and muscle ring finger-1 (MuRF1). Although data are scarce in humans, MAFbx and MuRF1 up-regulation was observed in some catabolic conditions.6
The mechanisms involved in the control of muscle mass during cachexia can be grouped into three categories: nutri-tion imbalance, mechanical stress, and neuro-hormonal me-diators. Indeed, a spontaneous reduction of food intake12,13 and a reduction in physical activity14,15 are frequently en-countered in many cases of cachexia, and starvation or mus-cle inactivity is sufficient to induce muscle proteolysis and atrophy.16,17 However, this only partly explains muscle loss as increased food intake or physical activity is insufficient to prevent the occurrence of cachexia in the absence of the treatment of the causal pathology.18 Several experiments have shed light on the role of hormonal mediator in different rodent models of cachexia. Indeed, increased levels of proin-flammatory cytokines (interleukin-1 and interleukin-6 or tu-mour necrosis factor alpha),19–21 resistance to insulin-like growth factor-1 and insulin,22,23 or increased myostatin levels24,25were often observed. Studies on the mechanisms of muscle wasting conducted in humans remain rare,
especially during failure, but some abnormalities described in animal models have been confirmed. For example, in-creased levels of myostatin have been found in the rectus abdominis muscles of patients with chronic renal failure.26 However, it still remains to establish whether the modi fica-tions observed are directly linked to the atrophying pro-gramme or whether they are specific of the disease itself. In addition, animal models mostly use young growing rodents, and muscle wasting is generally studied within1–2 weeks af-ter catabolic stimuli. This is very different from human dis-eases where it is generally detected within longer periods and in adults. Moreover, the physiology of rodents is not strictly comparable with that of humans. Proteomic studies coupled with bioinformatics analysis make it possible to de-tect proteins that potentially interact and are involved in a common biological process during muscle cachexia. Yet few have been conducted in human.27
It is thus crucial to identify (i) the cellular processes modi-fied in human atrophying skeletal muscles and (ii) whether common proteome modifications characterize muscle atro-phy independently of the disease in both early and late stages. In this study, we used muscles from early-stage lung cancer (LC) or late-stage chronic haemodialysis (HD) patients for investigating the role of proteolytic systems and for iden-tifying the metabolic processes modified either at the transcriptomic level or at the proteomic level.
Material and methods
Population
This study was performed at the University Hospital of Clermont-Ferrand (France) on muscle biopsies from three groups of patients: early-stage LC, chronic HD, and healthy (CT) volunteers. Patients included were over 18 years old, with either newly diagnosed LC (for whom surgical resection was programmed by thoracotomy) or end-stage renal failure treated for at least6 months by HD and necessitating femoral bypass revascularization. The control group patients required hip replacement for osteoarthritis. An activation of caspase-3 was noticed in such patients.28 However, Workeneh et al. performed the biopsies after1–1.5 h of surgery. As surgery increases C-reactive protein (CRP), interleukin-6, and protein degradation per se (overexpression of MuRF1 and MAFbx),29,30caspase-3 activity might have been elevated be-cause of sampling delay. We therefore took the biopsies right after skin incision and verified that CT patients exhibited nor-mal CRP level (median value3 mg/L).
Exclusion criteria were acute or chronic infections, diabe-tes mellitus, corticosteroid or hormone therapy, or preg-nancy. Glomerular filtration rate of LC and CT patients was estimated by the Chronic Kidney Disease Epidemiology Col-laboration equation and had to be>90 mL/min/1.73 m2. Pa-tients in the HD and CT groups did not exhibit active neoplasia for at least 1 year after muscle biopsy. A CRP> 10 mg, which was measured in serum using an auto-mated hospital-based technique (Abbott TDX), was an exclu-sion criterion for CT patients. All patients gave written informed consent prior to study entry. The study (DGS-2008-A00479-46) was approved by the Sud Est VI Research Ethics Committee and was conform to the standards set by the Declaration of Helsinki.
Muscles biopsies
Surgical muscle biopsies were taken at the beginning of the intervention, using a cold scalpel, in the latissimus dorsi (LC group) or the vastus lateralis (HD and CT groups). Biopsies were immediately frozen in liquid nitrogen and stored at
80°C.
Quantitative real-time PCR
Using a small fraction (≈100 mg) of the biopsies, total RNA was extracted as described by Chomczynski and Sacchi.31 mRNA levels of E3 ligases (MuRF1, MAFbx, Nedd4, Fbxo30/MUSA1, Trim32, Hdm2, Ozz, and E4B), E2 Ub-conjugating enzymes (UBE2A, UBE2B, UBE2D, UBE2E1, UBE2G1, UBE2J1, UBE2J2, UBE2L3, UBE2V1, UBE2V2, and UBE2N), proteasome subunits (PSMA1, PSMA3, PSMB1, PSMC1, PSMD2, PSMD4, PSMD7, and PSMD13), markers of apoptosis (Csp3, Csp9, Bax, and Bcl2), autophagy (CTPL and SQSTM1), and ATF4 pathway (4EBP1, ATF4, and CHOP) were determined by quantitative real-time PCR (qRT-PCR). Reverse transcription of total RNA was performed using the QuantiTect® Reverse Transcription kit (Qiagen®). qPCR was performed using the FastStart DNA Master SYBR Green I kit (Roche), according to the manufacturer’s instructions using a CFX96 thermocycler (Bio-Rad, Hercules, CA, USA). Calcula-tions were made using the comparative ΔCt method with YWHAZ, HPRT1, and 36B4 housekeeping genes. List of primers used is provided in Supporting Information, Table S1.
Protein extraction
A portion (≈400 mg) of the muscle biopsies was homogenized using a Polytron® (Kinematica, Littau-Luzern, Switzerland) in
8 mL of lysis buffer [50 mM 3-(N-morpholino)propanesulfonic acid pH 7.5, 5 mM ethylenediaminetetraacetic acid pH 8.0, 1 mM phenylmethanesulfonyl fluoride, protease inhibitor
cocktail (10 μL/mL of lysis buffer) (Sigma, St Louis, MO, USA), N-ethylmaleimide10 mM, and Triton X100 1%]. Muscle homogenates were centrifuged at16 000 g (4°C, 10 min), and the supernatant containing the cytoplasmic fraction was aliquoted and frozen at 80°C until use. Protein concentra-tion was measured by absorpconcentra-tion spectrophotometry (OD 562 nm) using the BCA kit (Pierce, Rockford, IL, USA) with bo-vine serum albumin as a standard.
Sodium dodecyl sulfate
–polyacrylamide gel
electrophoresis loading and nano-liquid
chromatography
–tandem mass spectrometry
analysis of proteins
After reduction and alkylation,50 μg of proteins were loaded on a12% acrylamide sodium dodecyl sulfate–polyacrylamide gel electrophoresis gel. Proteins were visualized by Coomassie Blue staining. Each band was cut into a single slice that was washed in 100 mM ammonium bicarbonate for 15 min, followed by a second wash in 100 mM ammonium bi-carbonate:acetonitrile (1:1) for 15 min. Both washes were performed at37°C. Second cycle of washes in ammonium bi-carbonate and ammonium bibi-carbonate/acetonitrile was then performed. Proteins were digested by incubating each gel slice with 1 μg of modified sequencing grade trypsin in 50 mM ammonium bicarbonate overnight at 37°C. The resulting peptides were extracted from the gel in three steps: a first incubation in 50 mM ammonium bicarbonate for 15 min at 37°C and two incubations in 10% formic acid:aceto-nitrile (1:1) for 15 min at 37°C. The three collected extracts were pooled with the initial digestion supernatant, dried in a SpeedVac, and resuspended with50 μL of 5% acetonitrile and 0.05% trifluoroacetic acid. The peptides were analysed by nano-liquid chromatography–tandem mass spectrometry (MS/MS) using an UltiMate3000 RSLCnano system (Dionex, Amsterdam, The Netherlands) coupled to an OrbiTrap Fusion mass spectrometer (Thermo Scientific, Bremen, Germany). Five microliters of each sample was loaded onto a C18 pre-column (300 μm id, 5 mm; Dionex), at 20 μL/min, in 5% ace-tonitrile and 0.05 W% trifluoroacetic acid. After 5 min of desalting, the pre-column was switched on line with the ana-lytical C18 column (75 μm id × 15 cm C18 column; packed in-house with ReproSil-Pur C18-AQ 3 μm resin, Dr Maisch; Proxeon Biosystems), equilibrated in95% solvent A (5% ace-tonitrile and0.2% formic acid) and 5% solvent B (80% aceto-nitrile and0.2% formic acid). Peptides were eluted using a 5– 50% gradient of solvent B over 130 min and at a flow rate of 300 nL/min.
The OrbiTrap Fusion was operated in Data Dependent Ac-quisition mode to automatically switch between full scan MS and MS/MS acquisition using Xcalibur software. Survey scan MS was acquired in the Orbitrap over the m/z 300– 2000 range, with the resolution set to a value of 120 000
(m/z400). The most intense ions per survey scan were se-lected for higher-energy collisional dissociation fragmentation (time between Master scans: 3 s), and the resulting frag-ments were analysed in the linear ion trap. Dynamic exclusion was employed within60 s to prevent repetitive selection of the same peptide.
Bioinformatics analysis of mass spectrometry raw
files
Mass spectrometry raw files were analysed using the Proline software version 1.6. MS/MS spectra were searched in the Mascot search engine against the forward and reverse Human SwissProt database combined with a commonly observed contaminants list. The digestion enzyme was set to trypsin/with up to two missed cleavages. Methionine oxidation and N-terminal acetylation were searched as variable modi fica-tions and carbamidomethyl of cysteine asfixed modification. Parent peptide masses and fragment masses were searched with maximal mass deviation of10 ppm. A first level of false dis-covery rate (FDR)filtration was done on the peptide-spectrum match level, and this was followed by a second level of FDR control on the protein level. Bothfiltrations were performed at a 1% FDR. These filtrations were done using a standard target-decoy database approach. For label-free relative quanti-fication of the samples, the “match between runs” option of Proline was enabled to allow cross-assignment of MS features detected in the different runs. The minimal ratio count was set to 1 for calculation of abundances, which were used for relative quantification of proteins between the 3 groups of samples (CT, HD and LC). Missing data were implemented using the Imp4p-package (CRAN) working in Prostar.
Statistical analysis
Statistical analysis was performed with XLSTAT v2018.1 soft-ware (Addinsoft®). The tests were two sided, with a Type I error
set atα = 0.05. Variables were presented as mean ± standard deviation or median [interquartile range] according to statisti-cal distribution (assumption of normality assessed by the Shapiro–Wilk test). For demographic data and qRT-PCR results, a one-way analysis of variance (ANOVA) was used to compare values within the three groups, followed by post hoc Tukey test for pairwise comparison. For MS results analysis, a two-way ANOVA (group and replicate) was used to compare values in the three groups followed by Benjamini–Hochberg (BH) correc-tion. Principal component analysis (PCA) was implemented on differentially expressed proteins. To focus on the proteins whose expression best characterized atrophying muscles inde-pendently of the disease (HD or LC vs. CT), we performed or-thogonal partial least square discriminant analysis (O-PLS-DA). Proteins were classified according to their variable importance
in projection (VIP). A VIP> 1 was considered for selecting the proteins.32Proteins whose VIP was above1 and significantly increased or decreased in both LC and HD patients were then evaluated using unsupervised hierarchical clustering (k-means classification and hierarchical ascending classification centred on Euclidean distances).
Bioinformatic analysis of protein expression data
Bioinformatic analysis was performed using Cytoscape soft-ware v3.6.0.33Proteins whose VIP was above1 and concomi-tantly increased or decreased in LC and HD patients when compared with CT patient were considered as common markers of muscle atrophy process. Identification of the func-tions of these proteins was implemented with ClueGO v2.5.0.34A network of Gene Ontology biological process was created allowing to group the redundant term in functional cluster. Enrichment analysis was then performed for each cluster. GO levels5 to 15 were considered. The kappa-statistics score threshold to create edge between nodes was set to0.56. A two-sided (enrichment/depletion) hypergeometric test followed by BH correction was used to perform enrichment analysis. Group fusion option was used to diminish the redundancy of the terms shared by similar associated proteins, which allows to maintain the most representative parent or child GO term. Then, a gene network analysis was implemented with CluePedia v1.5.035 using the String protein interaction database (January2018) in order to identify potential activated or repressed pathways. In order to validate our results, a pro-tein co-expression network was created based on the Spear-man rank correlation at a threshold of 0.6. Then, clustering was made using ClusterOne.36Finally, for each cluster, identi fi-cation of the most enriched functions/pathways was per-formed using GeneMANIA v3.4.1 and default settings.37
Results
Patients
’ demographic
Demographic characteristics of the21 patients included in this study (n =7 per group) are shown in Table 1. The three groups differed neither in age nor in sex ratio with a majority of men included. The body mass index of patients in the LC and HD groups was not significantly different compared with patients in the CT group, and it remained within the normal range. Systemic inflammation assessed by the CRP measurement was normal in the CT group (3.0 mg/L) for 70 years old patients and was significantly higher (more than three-fold to four-fold) in the LC and HD patients. Glomerularfiltration rate estimated by the Chronic Kidney Disease Epidemiology Collaboration equation was similar in the CT and LC groups and within the normal range considering the age of the patients.
The ubiquitin proteasome system and autophagy
proteolytic system are activated in the muscle of
lung cancer and haemodialysis patients
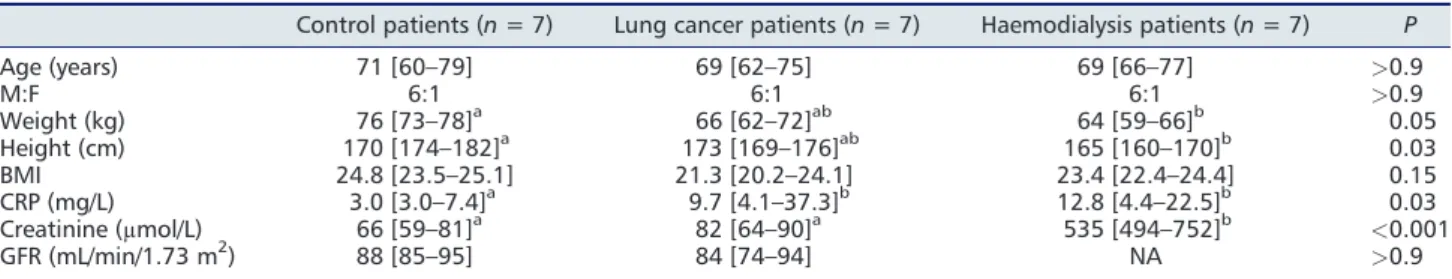
Studies conducted on cells or animal models have identified several genes whose expression is modified during muscle atrophy. These genes, called atrogenes, are markers of mus-cle wasting. Notably, they belong to cellular proteolytic sys-tems such as the UPS and autophagy. In order to address the activation of atrophy in LC and HD patients, qRT-PCR was performed to quantify in muscles biopsies the expres-sion of several genes belonging to several proteolytic sys-tems. Atrogenes include several E3 ligases of the UPS, which are often good markers of atrophy. We thus ad-dressed different E3 ligases that have been described for their implication in muscle homeostasis. MuRF1, MAFbx, Hdm2, and Fbxo30/MUSA1 E3 ligases were up-regulated at the mRNA levels in the muscle of LC and HD patients when compared with the CT group (Figure 1(A)). In contrast, Nedd4, E4b, and Trim32 transcripts were only up-regulated in patients from the HD group, while no variation was ob-served for Ozz (Figure1(A)). E3 ligases work in couple with E2 Ub-conjugating enzymes to ensure the ubiquitination of their substrate. We therefore quantified the expression of several E2s already described for being up-regulated in sev-eral catabolic situations in rodents (Figure 1(B)). However, only UBE2E1 and UBE2V2 transcripts were increased in LC patients and UBE2A and UBE2J1 in HD patients. We then ad-dressed26S proteasome subunits, but surprisingly, no signif-icant variation was found for the 20S complex subunits (Figure1(C)). For the 19S regulatory complex (19S RC), only an increase in PSMD13 mRNA levels was found in both LC and HD patients, while PSMD2 and PSMD4 were up-regulated only in HD patients (Figure 1(D)). We selected CTPL and p62/SQSTM1 as markers of the autophagy proteo-lytic system. Increased mRNA levels of both CTPL and p62/SQSTM1 were found in both LC and HD patients (Figure 1(E)), suggesting that autophagy was activated. Muscle atro-phy may also be accompanied by apoptosis of muscle cells. Indeed, we found increased levels of the pro-apoptotic
Casp3, Casp9, and Bax transcripts and a decrease of the anti-apoptotic Bcl2, but the modifications were restricted to HD patients (Figure 1(F)). Altogether, our data suggest an up-regulation of the UPS and the autophagy proteolytic systems, the most sensitive markers of the UPS being E3 li-gases, that is, enzymes that select the proteins to be degraded.
A speci
fic proteome identifies atrophying muscle
independently of the aetiology of the disease
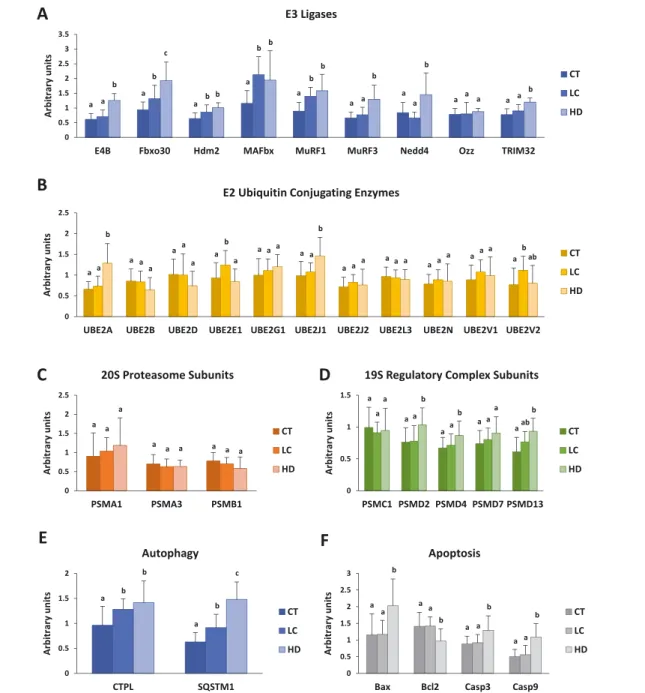
As we found an increased transcription of atrophying genes in muscles from LC and HD patients, we then addressed poten-tial changes in the muscle proteome. MS analysis of the cyto-plasmic fraction identified 1779 proteins (Supporting Information, Table S2), of which 919 were differently expressed in at least one group (P< 0.05 ANOVA for group factor after BH correction). Out of them, 257 proteins were increased or decreased in both LC and HD patients when compared with CT patients (Figure 2(A)). Moreover, LC/CT and HD/CT expression ratios of these proteins were well cor-related, indicating that their variation levels were highly sim-ilar independently of the disease (Figure2(B)).
Principal component analysis was performed on proteins differently expressed between the three groups (Figure 3(A)). PCA allows reducing the number of correlated variables to a limited number of independent variables (principal com-ponents) that better explain the observed variance. PCA grouped the proteins into three distinct sectors of the space generated by the two principal components, which nicely fitted respectively to the CT, LC, and HD groups (Figure 3(A)). This indicates that each patient’s group exhibited a spe-cific proteome and that a distinct signature can be drawn for CT, LC, and HD patients.
We then decided to focus on proteins that best character-ized atrophying muscles independently of the causal pathol-ogy, and we performed an O-PLS-DA (Figure 3(B)). The horizontal component of the O-PLS-DA score scatter plot cap-tures variation between the groups (LC or HD vs. CT), and the
Table1 Demographic characteristics of the patients
Control patients (n = 7) Lung cancer patients (n = 7) Haemodialysis patients (n = 7) P
Age (years) 71 [60–79] 69 [62–75] 69 [66–77] >0.9 M:F 6:1 6:1 6:1 >0.9 Weight (kg) 76 [73–78]a 66 [62–72]ab 64 [59–66]b 0.05 Height (cm) 170 [174–182]a 173 [169–176]ab 165 [160–170]b 0.03 BMI 24.8 [23.5–25.1] 21.3 [20.2–24.1] 23.4 [22.4–24.4] 0.15 CRP (mg/L) 3.0 [3.0–7.4]a 9.7 [4.1–37.3]b 12.8 [4.4–22.5]b 0.03 Creatinine (μmol/L) 66 [59–81]a 82 [64–90]a 535 [494–752]b <0.001 GFR (mL/min/1.73 m2) 88 [85–95] 84 [74–94] NA >0.9
BMI, body mass index; CRP, C-reactive protein; GFR, glomerularfiltration rate; M:F, sex ratio male-to-female; P-value obtained with one-analysis of variance.
Values are median and interquartile range.
vertical component captures variation within the groups. The model obtained exhibited an R2 (measure of model fit to the original data) of 0.993 and a Q2 (internal measure of consistency between the original and cross-validation pre-dicted data) of 0.983. The contribution of proteins to the model was evaluated by the calculation of the VIP. We found321 proteins exhibiting a VIP > 1, which was consid-ered the threshold for selecting the proteins32 (Figure 3(C)). By crossing these data (321 proteins with a VIP > 1)
with those of the differential expression analysis (257 pro-teins that both increased or decreased in the LC and HD groups), we finally selected 238 proteins (Supporting Infor-mation, Table S3). Using an unsupervised hierarchical cluster analysis, we then addressed the capacity of these proteins for discriminating patients according to their original groups (Figure3(D)). We found that a majority of proteins were po-tent indicators of catabolic conditions independently of the disease.
Figure1 Quantitative real-time PCR of genes from ubiquitin proteasome system and autophagy proteolytic system. mRNA levels of several compo-nents from ubiquitin proteasome system and autophagy proteolytic system are increased in muscle of LC and HD patients. P-value obtained with one-way analysis of variance. Values with different letters are significantly different using Tukey multiple comparison post hoc test. CT, healthy; HD, haemodialysis; LC, lung cancer.
Figure2 Shotgun proteomic analysis of muscle soluble proteome. (A) Volcano plots show differentially expressed proteins based on fold change vs. P-value obtained with analysis of variance after Benjamini–Hochberg correction. Proteins represented with red point are significantly (P < 0.05) in-creased or dein-creased in the muscles from both LC and HD patients. (B) Fold change in protein expression in LC vs. HD patients relative to CT patients. Change in expression of commonly variant proteins was similar in LC and HD. CT, healthy; HD, haemodialysis; LC, lung cancer.
Figure3 Multidimensional analysis of differentially expressed proteins in LC and HD groups. Each point represents one of the three patient replicates. (A) Principal components analysis reveals three different muscle soluble proteomes corresponding to the three different patients groups. (B) Based on differentially expressed proteins, O-PLS-DA creates a model allowing differentiating muscle of LC and HD patients from muscle of CT patients. (C)321 proteins with VIP> 1 contribute significantly to the model. (D) For these 321 proteins, unsupervised hierarchical clustering identifies two different patterns of expression: proteins increased and proteins decreased in both LC and HD patients relative to CT patients. CT, healthy; HD, haemodialysis; LC, lung cancer; O-PLS-DA, orthogonal partial least square discriminant analysis; PCA, principal component analysis; VIP, variable importance in projection.
Biological processes modi
fied upon muscle atrophy
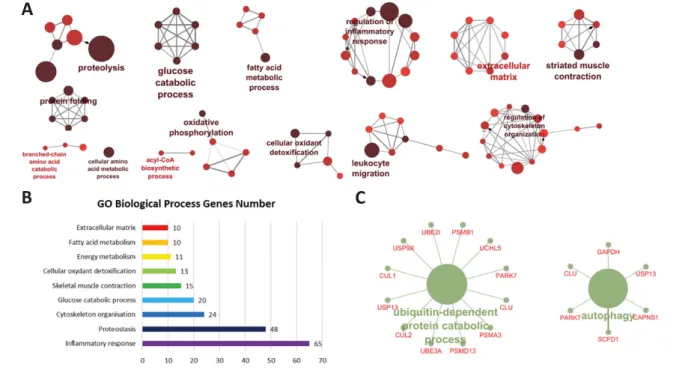
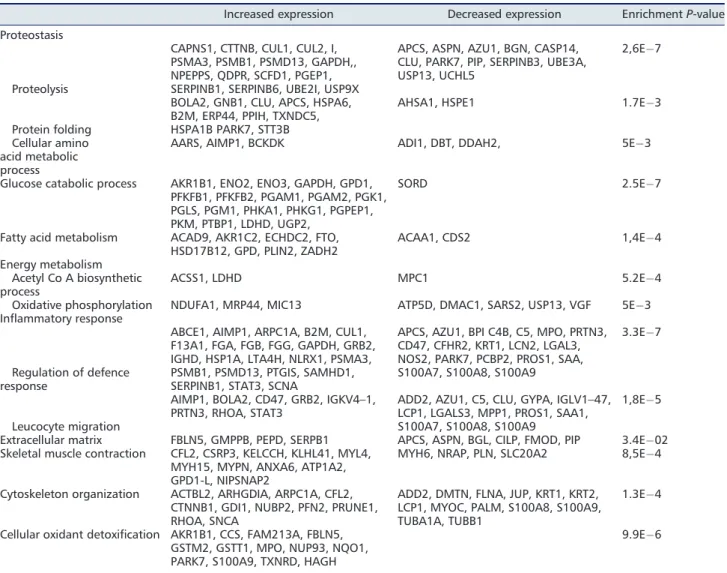
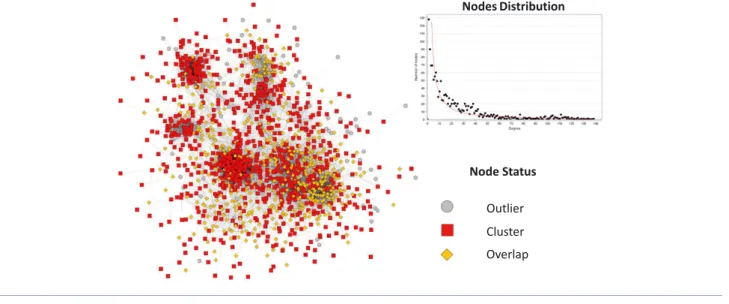
We carried out a functional analysis of the238 proteins that best witnessed muscle atrophy using the ClueGO plug-in. This revealed that these proteins can be grouped in functional modules related to biological processes significantly enriched when compared with the healthy human proteome (Figure 4(A) and 4(B)). Overall, it included several metabolic path-ways (proteostasis, glucose catabolic process, fatty acid, and energy metabolism), inflammation, defence against free oxy-gen radicals, structural proteins (cytoskeleton organization and extracellular matrix protein), and proteins involved in muscle contractile function (Table2). Regarding proteolysis, we found an increase of several proteins related to the UPS and the autophagy proteolytic systems (Figure4(C)). To con-firm these results, we used a different approach. A co-expression network was created from the1759 proteins iden-tified in MS. It was a scale-free network with a node degree distribution following a power law (R2=0.93), confirming its biological relevance (Figure 5). Using the ClusterOne algorithm, proteins have been grouped into 50 clusters of co-expression. Eight cluster displayed enriched functions (cel-lular respiration, inflammatory response, leucocyte migra-tion, translation factor activity, muscle contraction, extracellular matrix, glucose metabolic process, and protea-some pathway) (Table3).
The Wnt-
β-catenin and ATF4 signalling pathways
are up-regulated in both haemodialysis and lung
cancer patients
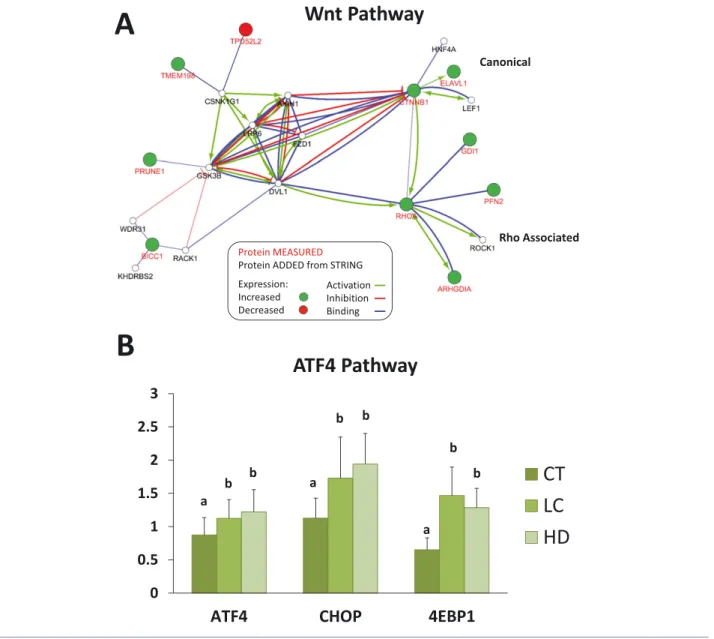
In order to identify signalling pathways potentially involved, a protein interaction network analysis was performed using CluePedia software. Ten proteins characterizing pathological muscles belonged to the Wnt-β-catenin pathway, which sug-gested an activation of this signalling pathway (Figure 6(A)). Similarly, ERp44 an endoplasmic reticulum (ER) stress marker was significantly increased in atrophying muscles, and we thus checked whether the ATF4 pathway was activated in the patients’ muscles. We found a significant increase of ATF4, CHOP, and 4EBP1 transcripts in both LC and HD pa-tients when compared with CT papa-tients (Figure6(B)).
Discussion
In this study, we focused on skeletal muscle proteolysis and proteome modifications induced by two diseases (LC and HD) with a different aetiology and known to induce muscle atrophy in humans. Wefirst found that the UPS and the au-tophagy proteolytic systems were concomitantly activated in both LC and HD patients and that some E3 ligases are
Figure4 Functional enrichment analysis. (A) Proteins whose expression characterize pathological muscle from lung cancer and haemodialysis patients are involved in proteolysis, protein folding, amino acid metabolism, glucose catabolic process, fatty acid metabolic process, oxidative phosphorylation, regulation of inflammatory response, leucocyte migration, cellular oxidant detoxification, regulation of cytoskeleton organization, extracellular matrix, and striated muscle contraction. (B) Most proteins belong to the inflammatory response and proteostasis processes. (C) Proteins involved in proteolysis and modified in both lung cancer and haemodialysis patients belong to the ubiquitin proteasome system and autophagy proteolytic system.
potent markers of human muscle atrophy. We then found a panel of 238 proteins belonging to nine main cellular func-tions that characterized atrophying muscles independently of the disease. Finally, we found that the Wnt-β-catenin and ATF4 signalling pathways were activated in both HD and LC muscles. This study was conducted with a limited number of patients, and the differential proteins (and mRNAs) will have to be confirmed using larger cohorts of patients, by fo-cusing on the most variable markers.
In various models of rodent muscle atrophy, several genes are systematically overexpressed at the transcriptional level, and these atrophy-related genes (atrogenes) include mem-bers of the main proteolytic systems (UPS and autophagy).6,38 Regarding the UPS, atrogenes include Ub,20S proteasome subunits,19S regulatory complex subunits, and ubiquitinating enzymes (E2s and E3s). Indeed, both substrate targeting (ubiquitination) and degradation (26S proteasome) steps are up-regulated in various catabolic situations (fasting, diabetes
mellitus, renal failure, tumour bearing, and hindlimb suspen-sion).17,39,40Surprisingly, in this study, proteasome subunits (belonging either to the 20S proteasome core or to the 19S regulatory complex) appeared to be poor predictors of the atrophying process in humans. Indeed, none of the20S and 19S RC subunits tested were up-regulated in both LC and HD patients at the mRNA levels, and only three of them were increased at the protein levels (Figure1(C) and 1(D), Table 2, and Supporting Information, Table S1). E2 enzymes appeared also to be poor predictors of muscle atrophy in LC and HD pa-tients (Figure1(B) and Supporting Information, Table S1) in contrast with animal models in which UBE2B was considered as a bona fide atrogene and other E2s were often up-regulated during catabolic situations (see Polge et al.41 for compiled data).
Several E3 ligases were up-regulated in both LC and HD pa-tients and more particularly MuRF1 and MAFbx, two muscle-specific E3 ligases considered as the best markers of muscle
Table2 Enriched biological process in LC and HD patients
Increased expression Decreased expression EnrichmentP-value Proteostasis
Proteolysis
CAPNS1, CTTNB, CUL1, CUL2, I, PSMA3, PSMB1, PSMD13, GAPDH,, NPEPPS, QDPR, SCFD1, PGEP1, SERPINB1, SERPINB6, UBE2I, USP9X
APCS, ASPN, AZU1, BGN, CASP14, CLU, PARK7, PIP, SERPINB3, UBE3A, USP13, UCHL5
2,6E 7
Protein folding
BOLA2, GNB1, CLU, APCS, HSPA6, B2M, ERP44, PPIH, TXNDC5, HSPA1B PARK7, STT3B
AHSA1, HSPE1 1.7E 3
Cellular amino acid metabolic process
AARS, AIMP1, BCKDK ADI1, DBT, DDAH2, 5E 3
Glucose catabolic process AKR1B1, ENO2, ENO3, GAPDH, GPD1, PFKFB1, PFKFB2, PGAM1, PGAM2, PGK1, PGLS, PGM1, PHKA1, PHKG1, PGPEP1, PKM, PTBP1, LDHD, UGP2,
SORD 2.5E 7
Fatty acid metabolism ACAD9, AKR1C2, ECHDC2, FTO, HSD17B12, GPD, PLIN2, ZADH2 ACAA1, CDS2 1,4E 4 Energy metabolism Acetyl Co A biosynthetic process ACSS1, LDHD MPC1 5.2E 4
Oxidative phosphorylation NDUFA1, MRP44, MIC13 ATP5D, DMAC1, SARS2, USP13, VGF 5E 3 Inflammatory response
Regulation of defence response
ABCE1, AIMP1, ARPC1A, B2M, CUL1, F13A1, FGA, FGB, FGG, GAPDH, GRB2, IGHD, HSP1A, LTA4H, NLRX1, PSMA3, PSMB1, PSMD13, PTGIS, SAMHD1, SERPINB1, STAT3, SCNA
APCS, AZU1, BPI C4B, C5, MPO, PRTN3, CD47, CFHR2, KRT1, LCN2, LGAL3, NOS2, PARK7, PCBP2, PROS1, SAA, S100A7, S100A8, S100A9
3.3E 7
Leucocyte migration
AIMP1, BOLA2, CD47, GRB2, IGKV4–1,
PRTN3, RHOA, STAT3 ADD2, AZU1, C5, CLU, GYPA, IGLV1–47,LCP1, LGALS3, MPP1, PROS1, SAA1, S100A7, S100A8, S100A9
1,8E 5 Extracellular matrix FBLN5, GMPPB, PEPD, SERPB1 APCS, ASPN, BGL, CILP, FMOD, PIP 3.4E 02 Skeletal muscle contraction CFL2, CSRP3, KELCCH, KLHL41, MYL4,
MYH15, MYPN, ANXA6, ATP1A2, GPD1-L, NIPSNAP2
MYH6, NRAP, PLN, SLC20A2 8,5E 4
Cytoskeleton organization ACTBL2, ARHGDIA, ARPC1A, CFL2, CTNNB1, GDI1, NUBP2, PFN2, PRUNE1, RHOA, SNCA
ADD2, DMTN, FLNA, JUP, KRT1, KRT2, LCP1, MYOC, PALM, S100A8, S100A9, TUBA1A, TUBB1
1.3E 4 Cellular oxidant detoxification AKR1B1, CCS, FAM213A, FBLN5,
GSTM2, GSTT1, MPO, NUP93, NQO1, PARK7, S100A9, TXNRD, HAGH
9.9E 6
Enriched biological process have been identified from the 321 proteins whose expression was significantly increased or decreased in both lung cancer (LC) and haemodialysis (HD) patients, using ClueGO®plug-in in Cytoscape®.
atrophy in rodents.6,42Even though human studies are rela-tively scarce compared with rodent, several investigations also observed an up-regulation of MuRF1 and MAFbx follow-ing immobilization, spinal cord injury, or chronic obstructive pulmonary disease.6 The sustained up-regulation of these E3 ligases over years (HD patients) suggests that both an in-creased degradation of the contractile apparatus (i.e. MuRF1 targets likeα-actin, myosin heavy chains, and telethonin) and a repression of protein synthesis and anabolic factors (i.e. MAFbx targets like eIF3f and MyoD) are necessary for main-taining long-term muscle atrophy.7–9,41,43 In our study, we also found that two other E3 ligases were up-regulated at
the mRNA level, that is, human double minute (Hdm2) and F-box protein 30/muscle Ub ligase of the SCF complex in atrophy-1 (Fbxo30/MUSA1). Hdm2 is a ubiquitous E3 ligase mostly known for its role in p53 ubiquitination during cancer development, but it is also up-regulated in muscles from hindlimb suspended rats, a model of hypokinesia.17Finally, Fbxo30/MUSA1 is a muscle-specific E3 ligase that was de-scribed as essential for the development of muscle atrophy in several rodent models with the exception of mild renal fail-ure in rats, but Fbxo30/MUSA1 targets remain to be discov-ered.10,42,44–46 The recruitment of E3 ligases in catabolic patients was further demonstrated at the proteome level.
Figure5 Proteins co-expression network analysis. Spearman rank correlation for expression of all possible protein pair is calculated. In graph, proteins are represented with nodes, and an edge is created between two nodes if the Spearman rank correlation for the expression of the two proteins among all patients is above0.6. Node degree distribution followed a power law. The ClusterOne algorithm led to the identification of 50 clusters of co-expressed proteins.
Table3 Functions of clusters of expression
Cluster Enriched function Q-value Proteins involved
1 Cellular respiration 1.0E 161 ACO2, ALDH5A1, ATP5A1, ATP5B, ATP5C1, ATP5D, ATP5F1, ATP5H, ATP5I, ATP5J2, ATP5L, ATP5O, COX4I1, COX5A, COX5B, COX6B1, COX6C, CS, CYC1, CYCS, DLD, DLST, ETFA, ETFB, ETFDH, FH, IDH2, IDH3A, IDH3G, MDH2, MT-ATP6, MT-CO2, NDUFA10, NDUFA11, NDUFA12, NDUFA13, NDUFA2, NDUFA4, NDUFA5, NDUFA6, NDUFA8, NDUFA9, NDUFAB1, NDUFB1, NDUFB10, NDUFB11, NDUFB3, NDUFB4, NDUFB5, NDUFB6, NDUFB7, NDUFB8, NDUFB9, NDUFC2, NDUFS1, NDUFS2, NDUFS3, NDUFS4, NDUFS6, NDUFS7, NDUFS8, NDUFV1, NDUFV2, NNT, OGDH, PDHA1, PDHB, SDHA, SDHB, SLC25A12, SLC25A13, SUCLA2, SUCLG1, UQCRB, UQCRC1, UQCRC2, UQCRFS1, UQCRH 2 Inflammatory response 7.9E 18 A2M, AGT, AHSG, APOA1, APOD, APOE, C3, C4A, C9, CFB, CFH, ITIH4, KNG1, ORM1,
SERPINA3, SERPING1, VTN
3 Leucocyte migration 2.3E 06 AZU1, CD47, ITGB3, MPP1, PROS1, S100A7, S100A8, SAA1 4 Translation factor
activity
4.5E 10 EEF1A2, EIF2S1, EIF3E, EIF3I, EIF4A2, EIF4G1
5 Muscle contraction 1.1E 58 TPM1, TMOD4, TNNT3, MYL1, TNNI2, TPM2, MYH7, MYH2, TPM3, ACTN3, TMOD1, MYL3, ASPH, MYL6B, TNNI1, MYL5, MYH3, ACTN2, TNNT1, TNNC1, ACTA1, MYBPC2, MYL2, MYH4
6 Extracellular matrix 4.4E 5 COL15A1, CILP, SNCA, FMOD
7 Glucose metabolic process 2.6E 36 PGK1, PGAM2, ALDOA, ENO2, PGM1, FBP2, GAPDH, ENO3, GPI, ALDOC, TPI1 8 Proteasome complex 1.1E 71 PSMA5, PSMA3, PSMD6, PSMD4, VCP, PSMA1, PSMB7, PSMB1, PSMA7, PSMB2 Eight clusters of expression identified using ClusterOne®
Indeed, we found that the Cul1 and Cul2 were up-regulated in both LC and HD patients (Table 2 and Supporting Infor-mation, Table S3). Cul1 and Cul2 are scaffold proteins in-cluded in several multi-subunits Cullin-Ring E3 ligases, which means that numerous E3 ligases belonging to this family may be up-regulated in LC and HD patients. Interest-ingly, Cul1 is the Cullin integrated to the multi-subunits MAFbx E3 ligase, which corroborates the data obtained at the mRNA level. Altogether, we found that several compo-nents of the UPS were up-regulated in both LC and HD pa-tients (Figure1, Table 2, and Supporting Information, Table S3) but this was restricted to E3 ligases, which is in striking contrast with rodent models. The main difference between animal models and human pathologies is the timing, which
is generally in days for animal models while it is in months or years for humans. Indeed, even though we recruited LC patients soon after cancer discovery, the atrophying process was probably already activated for weeks. However, body mass index was within the normal range, which suggests that LC and HD patients were not severely cachectic. We hy-pothesize that the 26S proteasome and the E2 enzymes do not need to be maintained up-regulated once the pathology is established, the enzyme activity being sufficient for main-taining the skeletal muscle in a catabolic state. In contrast, some E3 ligases (MuRF1, MAFbx, Hdm2, and Fbxo30/MUSA1) are involved in the atrophying programme in both very early (3–7 days, rodents) and late (>1 year, humans) stages of muscle atrophy.
Figure6 Signalling pathways activated in lung cancer (LC) and haemodialysis (HD) patients. (A) Analysis based on String protein interaction database predicts that the Wnt pathway signalling is activated in LC and HD patients. (B) Increased mRNA levels of ATF4, CHOP, and 4EBP1 revealed activation of the ATF4 pathway in both LC and HD patients.
Autophagy is known for playing a crucial role in atrophying muscles from rodents,10,47,48and we found that p62/SQSTM1 was up-regulated in LC and HD patients. p62 is a cargo recog-nition protein implicated in the selective addressing of pro-teins (or protein aggregates) or organelles to the autophagy machinery. Increased p62 transcription levels are thus di-rectly linked to an increased autophagy flux. We also found that cathepsin L (CTPL) and myosin heavy chain15 (MYH15) were also up-regulated in both LC and HD patients. CTPL is a lysosomal protease (the catalytic organelle of autophagy) and is also known to be an atrogene in rodent muscles.17,40 MYH15 is a heavy chain of myosin involved in the transport of lysosomal vesicles. Our data are in accordance with previ-ous studies demonstrating that LC3B (a protein crucial for autophagosome formation) and CTPL were up-regulated in muscles from cancer cachexia patients.49Similarly, autophagy was activated in nephrectomized mice, causing mitochondria dysfunction without affecting the contractile apparatus.50 Al-together, key proteins of autophagy were up-regulated in both LC and HD patients, which represent potent and persis-tent markers of muscle atrophy.
Another main goal of our study was to find a shared atrophying pattern in patients developing diseases with a completely different aetiology and at different stages. Our hypothesis was that similar protein modifications in LC and HD patients are more likely due to the atrophying process rather than the pathology itself. Interestingly, we found238 proteins that were either down-regulated or up-regulated in both LC and HD patients. Interestingly, numerous proteins of unknown function (at least in skeletal muscle) were among the ones undergoing the sharpest modifications. For exam-ple, several proteins positively correlating with cellular prolif-eration were down-regulated, such as dermcidin ( 76 to 80%, P < 1.0E 07). Future studies will have to investigate the role of these proteins in the development of muscle atro-phy, but one hypothesis is that a sustained repression of cell proliferation may be an adaptive mechanism of muscle atrophy.
Besides proteins of unknown functions, our data highlighted an activation of ER stress in both LC and HD pa-tients. We found that several chaperones were up-regulated in the skeletal muscle of these patients, notably ERp44 a marker of ER stress (+234 to +368%, P < 1.0E 29). ERp44 is a pH-regulated chaperone of the secretory pathway, which controls oxidative-related protein misfolding in the ER.51 These results are in accordance with studies showing that ER stress is activated in several catabolic situations (denerva-tion, starva(denerva-tion, high-fat diet, cancer cachexia, and ageing).52 The ER stress response can be activated by several stress fac-tors (nutrient deprivation, reactive oxygen species, etc.) and more recently in mice injected with indoxyl sulfate, a uraemic toxin.53However, it is the first time that an ER stress is de-tected in HD patients. The ER stress response involves in par-ticular the PERK/ATF4/CHOP signalling pathway that
decreases overall protein translation, triggers the specific ex-pression of chaperones, activates the UPS and autophagy proteolytic systems, and may ultimately lead to apoptosis.54 Accordingly, we found an up-regulation of CHOP, ATF4, and 4EBP1 (a downstream key protein of this pathway) in the muscles from both LC and HD patients (Figure6(B)).
Another striking effect of both cancer and renal failure was the increased expression of several glycolytic enzymes and the down-regulation of several proteins involved in mito-chondrial respiration in the muscle from LC and HD patients (Tables2 and 3). This is in agreement with the slow oxidative to fast glycolytic transformation process observed during muscle atrophy55and the increased expression of several gly-colytic enzymes observed in atrophying muscles from hindlimb suspended,56 denervated,57 or immobilized58 ani-mals. Mitochondrial dysfunction has also been found in dif-ferent rodent models of cachexia50,59 and is a regulator of myofiber protein turnover and apoptosis.60 The proposed model is that mitochondrial dysfunction may precede the in-stallation of muscular atrophy.61Increased reactive oxygen species62and inflammation63have also been proposed to ex-plain the metabolic changes associated with muscle atrophy. Future studies will have to clarify the role of the modifications in the occurrence of muscle wasting.
Muscle atrophy is accompanied by modifications of pro-teins involved in contraction and in the architecture of muscle tissue, including cytoskeleton,64increased musclefibrosis,65 and adipogenic infiltration.66In mice subjected to hindlimb suspension, the expression of several cytoskeleton proteins was modified in the atrophying muscles.64A remodelling of the cytoskeleton appears essential for allowing the degrada-tion offilamentous proteins and for preserving the functional integrity of myofibrils during muscle atrophy.67Similarly, sev-eral proteins involved in muscle architecture and muscle con-traction were either down-regulated or up-regulated in both LC and HD patients (Table 2). Indeed, a group of proteins whose expression levels were modified in the muscle of LC and HD patients belong to the cytoskeleton organization in-cluding intermediate filaments. We found an up-regulation of ARPC1A (component of the ARP2/3 complex), cofilin 2 (CFL2), and profilin 2 (PFN2) (regulators of actin polymerization/depolymerization) and a down-regulation of filamin A (FLNA) (a cellular actin-network stabilizer) and junc-tion plakoglobin (JUP) (a mechanical stress transducjunc-tion pro-tein). We have also noted increased levels of myopalladin (MYPN), a protein that participates to thinfilament assembly by linking nebulin andα-actinin.68Its translocation into the cytosol may witness the destabilization of the sarcomeric structure and the subsequent degradation of sarcomeric pro-teins by the UPS. Furthermore, profound modifications of ex-tracellular matrix components were observed between control and diseased patients (Table 2) like peptidase D (PEPD) (+15 to +40%, P < 1.0E 02), a protein involved in col-lagen synthesis, and the acireductone dioxygenase 1(ADI1),
an extracellular protease inhibitor ( 39 to 61%, P < 1.0E 04), which further suggest a profibrotic process in skeletal muscles from LC and HD patients. Regarding mus-cle adiposity, we found an increase in fat tissue obesity gene expression (+14 to +40%, P < 1.0E 02). Fat tissue obesity is a nucleic acid demethylase that controls the expression of genes involved in energy metabolism. Its overexpression has been shown to cause intracellular lipid accumulation in skele-tal muscle cells69and increased white adipose tissue.70 Inter-estingly, proteome analysis also revealed an activation of the Wnt/β-catenin pathway in both groups, which is known to have a dual function as it is involved either in muscle regen-eration71or infibrosis.72Inhibition of canonical Wnt signalling in aged skeletal muscle has the potential to reduce fibrosis development.72 This suggests that targeting the canonical Wnt pathway may be a potential approach for preserving muscle integrity.
The discovery of>230 proteins differentially expressed in the HD and LC patients has several implications. First, it means that profound modifications of skeletal muscle metab-olism occur and that they persist throughout the course of the pathology. Thus, the identified markers are potentially in-teresting not only for characterizing muscle atrophy but also for better understanding the atrophy process. The second point is that these markers were not equally modified; that is, some of them reached a five-fold to seven-fold increase while others were ‘only’ increased by 50%. This does not mean the higher the better. Future studies will have to iden-tify the most reliable markers, that is, the ones systematically altered in most if not all patients and predictive of muscle mass loss when using larger cohorts. The third important im-plication is that these muscle markers will be hardly useful for direct clinical use (muscle biopsies). We are currently working on the detection of blood markers that could reflect the atrophying programme observed in skeletal muscle, this study being an obligatory and highly valuable step.
Conclusions
We observed an activation of the UPS and autophagy proteo-lytic systems and common proteomic modifications in atrophying skeletal muscles from LC and HD patients. Our data suggest that the degradation of the contractile appara-tus and of the muscular cell structure (cytoskeleton) may be highly similar whatever the pathology, which means similar therapeutic strategies may be applied for preserving muscle
mass. Our work represents a proof of concept with a limited number of patients, and future work will have to confirm these data on a larger number of patients with similar or dif-ferent pathologies. Another important issue will be to deter-mine whether the muscle-atrophying programme may also induce common variations in blood (e.g. at the transcriptomic level), a more easy-to-handle compartment in patients. If so, this may end up with a valuable diagnostic tool for early de-tection of catabolic situations or for following disease remission.
Acknowledgements
The authors are particularly grateful to Emmanuelle Mouton-Barbosa for bioinformatics analyses of proteomic data. We also thank Pr Bertand Souweine and Dr Mohamed Hadj Abdel-kader for their help. This work was supported by grants from the Centre Hospitalier Universitaire de Clermont-Ferrand and the Institut National de la Recherche Agronomique. The work was also supported in part by the French Ministry of Research with the Investissement d’Avenir Infrastructures Nationales en Biologie et Santé program (ProFI, Proteomics French Infrastructure project, ANR-10-INBS-08).
Online supplementary material
Additional supporting information may be found online in the Supporting Information section at the end of the article. Table S1. List of primers
Table S2. Shot Gun expression data of muscle soluble prote-ome
Table S3. Protein with VIP > 1 and increased or decreased both in LC and HD patients
Con
flict of interest
The authors declare that they have no conflict of interest. The authors certify that they comply with the ethical guidelines for publishing in the Journal of Cachexia, Sarcopenia and Muscle: update2017.73
References
1. von Haehling S, Anker MS, Anker SD. Prevalence and clinical impact of cachexia in chronic illness in Europe, USA, and
Japan: facts and numbers update2016. J Cachexia Sarcopenia Muscle 2016; 7:507–509.
2. Kalantar-Zadeh K, Rhee C, Sim JJ, Stenvinkel P, Anker SD, Kovesdy CP. Why cachexia kills: examining the causality of
poor outcomes in wasting conditions. J Ca-chexia Sarcopenia Muscle2013;4:89–94. 3. Argiles JM, Busquets S, Stemmler B,
Lopez-Soriano FJ. Cancer cachexia: understanding the molecular basis. Nat Rev Cancer 2014;14:754–762.
4. Baracos VE, Martin L, Korc M, Guttridge DC, Fearon KCH. Cancer-associated cachexia. Nat Rev Dis Primers 2018;4:17105.
5. Wang XH, Mitch WE. Mechanisms of mus-cle wasting in chronic kidney disease. Nat Rev Nephrol2014;10:504–516.
6. Bodine SC, Baehr LM. Skeletal muscle atro-phy and the E3 ubiquitin ligases MuRF1 and MAFbx/atrogin-1. Am J Physiol Endocrinol Metab2014;307:E469–E484. 7. Polge C, Heng AE, Jarzaguet M, Ventadour
S, Claustre A, Combaret L, et al. Muscle actin is polyubiquitinylated in vitro and in vivo and targeted for breakdown by the E3 ligase MuRF1. FASEB J 2011;25:3790–3802.
8. Csibi A, Leibovitch MP, Cornille K, Tintignac LA, Leibovitch SA. MAFbx/Atrogin-1 con-trols the activity of the initiation factor eIF3-f in skeletal muscle atrophy by targeting multiple C-terminal lysines. J Biol Chem2009;284:4413–4421.
9. Lagirand-Cantaloube J, Cornille K, Csibi A, Batonnet-Pichon S, Leibovitch MP, Leibovitch SA. Inhibition of atrogin-1/ MAFbx mediated MyoD proteolysis pre-vents skeletal muscle atrophy in vivo. PLoS One2009;4:e4973.
10. Milan G, Romanello V, Pescatore F, Armani A, Paik JH, Frasson L, et al. Regulation of autophagy and the ubiquitin-proteasome system by the FoxO transcriptional net-work during muscle atrophy. Nat Commun 2015;6:6670.
11. Tomko RJ Jr, Hochstrasser M. Molecular ar-chitecture and assembly of the eukaryotic proteasome. Annu Rev Biochem 2013;82:415–445.
12. Tisdale MJ. Cancer anorexia and cachexia. Nutrition2001;17:438–442.
13. Bossola M, Tazza L, Giungi S, Luciani G. An-orexia in hemodialysis patients: an update. Kidney Int2006;70:417–422.
14. Toledo M, Busquets S, Sirisi S, Serpe R, Orpi M, Coutinho J, et al. Cancer cachexia: phys-ical activity and muscle force in tumour-bearing rats. Oncol Rep2011;25:189–193. 15. Johansen KL, Chertow GM, Ng AV, Mulligan
K, Carey S, Schoenfeld PY, et al. Physical ac-tivity levels in patients on hemodialysis and healthy sedentary controls. Kidney Int 2000;57:2564–2570.
16. Wing SS, Haas AL, Goldberg AL. Increase in ubiquitin-protein conjugates concomitant with the increase in proteolysis in rat skel-etal muscle during starvation and atrophy denervation. Biochem J1995;307:639–645. 17. Taillandier D, Aurousseau E, Meynial-Denis D, Bechet D, Ferrara M, Cottin P, et al. Co-ordinate activation of lysosomal, Ca 2+-ac-tivated and ATP-ubiquitin-dependent proteinases in the unweighted rat soleus muscle. Biochem J1996;316:65–72. 18. Konishi M, Ishida J, von Haehling S, Anker
SD, Springer J. Nutrition in cachexia: from
bench to bedside. J Cachexia Sarcopenia Muscle2016;7:107–109.
19. Patel HJ, Patel BM. TNF-alpha and cancer cachexia: molecular insights and clinical im-plications. Life Sci2017;170:56–63. 20. Bonetto A, Aydogdu T, Jin X, Zhang Z, Zhan
R, Puzis L, et al. JAK/STAT3 pathway inhibi-tion blocks skeletal muscle wasting down-stream of IL-6 and in experimental cancer cachexia. Am J Physiol Endocrinol Metab 2012;303:E410–E421.
21. Cai D, Frantz JD, Tawa NE Jr, Melendez PA, Oh BC, Lidov HG, et al. IKKbeta/NF-kappaB activation causes severe muscle wasting in mice. Cell2004;119:285–298.
22. Wang X, Hu Z, Hu J, Du J, Mitch WE. Insulin resistance accelerates muscle protein deg-radation: activation of the ubiquitin-proteasome pathway by defects in muscle cell signaling. Endocrinology 2006;147:4160–4168.
23. Asp ML, Tian M, Wendel AA, Belury MA. Evidence for the contribution of insulin re-sistance to the development of cachexia in tumor-bearing mice. Int J Cancer 2010;126:756–763.
24. Costelli P, Muscaritoli M, Bonetto A, Penna F, Reffo P, Bossola M, et al. Muscle myostatin signalling is enhanced in experi-mental cancer cachexia. Eur J Clin Invest 2008;38:531–538.
25. Zhang L, Rajan V, Lin E, Hu Z, Han HQ, Zhou X, et al. Pharmacological inhibition of myostatin suppresses systemic in flamma-tion and muscle atrophy in mice with chronic kidney disease. FASEB J 2011;25:1653–1663.
26. Zhang L, Pan J, Dong Y, Tweardy DJ, Dong Y, Garibotto G, et al. Stat3 activation links a C/EBPdelta to myostatin pathway to stimulate loss of muscle mass. Cell Metab 2013;18:368–379.
27. Gallagher IJ, Jacobi C, Tardif N, Rooyackers O, Fearon K. Omics/systems biology and cancer cachexia. Semin Cell Dev Biol 2016;54:92–103.
28. Workeneh BT, Rondon-Berrios H, Zhang L, Hu Z, Ayehu G, Ferrando A, et al. Devel-opment of a diagnostic method for de-tecting increased muscle protein degradation in patients with catabolic conditions. J Am Soc Nephrol 2006;17:3233–3239.
29. Bautmans I, Njemini R, De Backer J, De Waele E, Mets T. Surgery-induced in flam-mation in relation to age, muscle endur-ance, and self-perceived fatigue. J Gerontol A Biol Sci Med Sci 2010;65:266–273.
30. Mikura M, Yamaoka I, Doi M, Kawano Y, Nakayama M, Nakao R, et al. Glucose infu-sion suppresses surgery-induced muscle protein breakdown by inhibiting ubiquitin-proteasome pathway in rats. Anesthesiol-ogy2009;110:81–88.
31. Chomczynski P, Sacchi N. Single-step method of RNA isolation by acid guanidinium thiocyanate-phenol-chloroform extraction. Anal Biochem 1987;162:156–159.
32. Lazraq A, Cléroux R, Gauchi JP. Selecting both latent and explanatory variables in
the PLS1 regression model. Chemom Intel Lab Syst2003;66:117–126.
33. Shannon P, Markiel A, Ozier O, Baliga NS, Wang JT, Ramage D, et al. Cytoscape: a software environment for integrated models of biomolecular interaction net-works. Genome Res2003;13:2498–2504. 34. Bindea G, Mlecnik B, Hackl H, Charoentong
P, Tosolini M, Kirilovsky A, et al. ClueGO: a Cytoscape plug-in to decipher functionally grouped gene ontology and pathway anno-tation networks. Bioinformatics 2009;25:1091–1093.
35. Bindea G, Galon J, Mlecnik B. CluePedia Cytoscape plugin: pathway insights using integrated experimental and in silico data. Bioinformatics2013;29:661–663. 36. Nepusz T, Yu H, Paccanaro A. Detecting
overlapping protein complexes in protein– protein interaction networks. Nat Methods 2012;9:471–472.
37. Mostafavi S, Ray D, Warde-Farley D, Grouios C, Morris Q. GeneMANIA: a real-time multiple association network integra-tion algorithm for predicting gene funcintegra-tion. Genome Biol2008;9 Suppl 1:S4.
38. Lecker SH, Jagoe RT, Gilbert A, Gomes M, Baracos V, Bailey J, et al. Multiple types of skeletal muscle atrophy involve a com-mon program of changes in gene expres-sion. FASEB J2004;18:39–51.
39. Voisin L, Breuille D, Combaret L, Pouyet C, Taillandier D, Aurousseau E, et al. Muscle wasting in a rat model of long-lasting sepsis results from the activation of lysosomal, Ca2+-activated, and ubiquitin-proteasome proteolytic pathways. J Clin Invest 1996;97:1610–1617.
40. Temparis S, Asensi M, Taillandier D, Aurousseau E, Larbaud D, Obled A, et al. In-creased ATP-ubiquitin-dependent proteoly-sis in skeletal muscles of tumor-bearing rats. Cancer Res1994;54:5568–5573. 41. Polge C, Cabantous S, Deval C, Claustre A,
Hauvette A, Bouchenot C, et al. A muscle-specific MuRF1-E2 network requires stabili-zation of MuRF1-E2 complexes by telethonin, a newly identified substrate. J Cachexia Sarcopenia Muscle 2018;9:129–145.
42. Aniort J, Polge C, Claustre A, Combaret L, Bechet D, Attaix D, et al. Upregulation of MuRF1 and MAFbx participates to muscle wasting upon gentamicin-induced acute kidney injury. Int J Biochem Cell Biol 2016;79:505–516.
43. Clarke BA, Drujan D, Willis MS, Murphy LO, Corpina RA, Burova E, et al. The E3 ligase MuRF1 degrades myosin heavy chain pro-tein in dexamethasone-treated skeletal muscle. Cell Metab2007;6:376–385. 44. Li F, Buck D, De Winter J, Kolb J, Meng H,
Birch C, et al. Nebulin deficiency in adult muscle causes sarcomere defects and muscle-type-dependent changes in trophicity: novel insights in nemaline
my-opathy. Hum Mol Genet
2015;24:5219–5233.
45. Smith HK, Matthews KG, Oldham JM, Jeanplong F, Falconer SJ, Bass JJ, et al. Translational signalling, atrogenic and myo-genic gene expression during unloading
and reloading of skeletal muscle in myostatin-deficient mice. PLoS One 2014;9:e94356.
46. Sato AY, Richardson D, Cregor M, Davis HM, Au ED, McAndrews K, et al. Glucocor-ticoids induce bone and muscle atrophy by tissue-specific mechanisms upstream of E3 ubiquitin ligases. Endocrinology 2017;158:664–677.
47. Masiero E, Agatea L, Mammucari C, Blaauw B, Loro E, Komatsu M, et al. Autophagy is required to maintain muscle mass. Cell Metab2009;10:507–515.
48. Mammucari C, Schiaffino S, Sandri M. Downstream of Akt: FoxO3 and mTOR in the regulation of autophagy in skeletal muscle. Autophagy2008;4:524–526. 49. Tardif N, Klaude M, Lundell L, Thorell A,
Rooyackers O. Autophagic-lysosomal path-way is the main proteolytic system modi-fied in the skeletal muscle of esophageal cancer patients. Am J Clin Nutr 2013;98:1485–1492.
50. Su Z, Klein JD, Du J, Franch HA, Zhang L, Hassounah F, et al. Chronic kidney disease induces autophagy leading to dysfunction of mitochondria in skeletal muscle. Am J Physiol Renal Physiol 2017;312: F1128–F1140.
51. Anelli T, Alessio M, Mezghrani A, Simmen T, Talamo F, Bachi A, et al. ERp44, a novel endoplasmic reticulum folding assistant of the thioredoxin family. EMBO J 2002;21:835–844.
52. Afroze D, Kumar A. ER stress in skeletal muscle remodeling and myopathies. FEBS J2017.
53. Jheng JR, Chen YS, Ao UI, Chan DC, Huang JW, Hung KY, et al. The double-edged sword of endoplasmic reticulum stress in uremic sarcopenia through myogenesis perturbation. J Cachexia Sarcopenia Muscle 2018;9:570–584.
54. B’Chir W, Maurin AC, Carraro V, Averous J, Jousse C, Muranishi Y, et al. The eIF2alpha/ATF4 pathway is essential for stress-induced autophagy gene expression. Nucleic Acids Res2013;41:7683–7699.
55. Bigard AX, Boehm E, Veksler V, Mateo P, Anflous K, Ventura-Clapier R. Muscle unloading induces slow to fast transitions in myofibrillar but not mitochondrial prop-erties. Relevance to skeletal muscle abnor-malities in heart failure. J Mol Cell Cardiol 1998;30:2391–2401.
56. Seo Y, Lee K, Park K, Bae K, Choi I. A prote-omic assessment of muscle contractile al-terations during unloading and reloading. J Biochem2006;139:71–80.
57. Sun H, Liu J, Ding F, Wang X, Liu M, Gu X. Investigation of differentially expressed proteins in rat gastrocnemius muscle dur-ing denervation–reinnervation. J Muscle Res Cell Motil2006;27:241–250.
58. Toigo M, Donohoe S, Sperrazzo G, Jarrold B, Wang F, Hinkle R, et al. ICAT-MS-MS time course analysis of atrophying mouse skeletal muscle cytosolic subproteome. Mol Biosyst2005;1:229–241.
59. Argiles JM, Lopez-Soriano FJ, Busquets S. Muscle wasting in cancer: the role of mito-chondria. Curr Opin Clin Nutr Metab Care 2015;18:221–225.
60. Carson JA, Hardee JP, VanderVeen BN. The emerging role of skeletal muscle oxidative metabolism as a biological target and cellular regulator of cancer-induced muscle wasting. Semin Cell Dev Biol2016;54:53–67. 61. Brown JL, Rosa-Caldwell ME, Lee DE,
Black-well TA, Brown LA, Perry RA, et al. Mito-chondrial degeneration precedes the development of muscle atrophy in progres-sion of cancer cachexia in tumour-bearing mice. J Cachexia Sarcopenia Muscle 2017;8:926–938.
62. Tang H, Lee M, Sharpe O, Salamone L, Noonan EJ, Hoang CD, et al. Oxidative stress-responsive microRNA-320 regulates glycolysis in diverse biological systems. FASEB J2012;26:4710–4721.
63. Remels AH, Gosker HR, Langen RC, Polkey M, Sliwinski P, Galdiz J, et al. Classical NF-kappaB activation impairs skeletal muscle oxidative phenotype by reducing IKK-alpha expression. Biochim Biophys Acta 1842;2014:175–185.
64. Wang F, Zhang P, Liu H, Fan M, Chen X. Proteomic analysis of mouse soleus mus-cles affected by hindlimb unloading and reloading. Muscle Nerve2015;52:803–811. 65. Cisternas P, Henriquez JP, Brandan E, Inestrosa NC. Wnt signaling in skeletal muscle dynamics: myogenesis, neuromus-cular synapse andfibrosis. Mol Neurobiol 2014;49:574–589.
66. Vettor R, Milan G, Franzin C, Sanna M, De Coppi P, Rizzuto R, et al. The origin of intermuscular adipose tissue and its patho-physiological implications. Am J Physiol Endocrinol Metab2009;297:E987–E998. 67. Sanger JW, Wang J, Fan Y, White J, Mi-Mi L,
Dube DK, et al. Assembly and maintenance of myofibrils in striated muscle. Handb Exp Pharmacol2017;235:39–75.
68. Bang ML, Mudry RE, McElhinny AS, Trombitas K, Geach AJ, Yamasaki R, et al. Myopalladin, a novel145-kilodalton sarco-meric protein with multiple roles in Z-disc and I-band protein assemblies. J Cell Biol 2001;153:413–427.
69. Wu W, Feng J, Jiang D, Zhou X, Jiang Q, Cai M, et al. AMPK regulates lipid accumula-tion in skeletal muscle cells through FTO-dependent demethylation of N( 6)-methyladenosine. Sci Rep2017;7:41606. 70. Merkestein M, Laber S, McMurray F,
Andrew D, Sachse G, Sanderson J, et al. FTO influences adipogenesis by regulating mitotic clonal expansion. Nat Commun 2015;6:6792.
71. Rudolf A, Schirwis E, Giordani L, Parisi A, Lepper C, Taketo MM, et al. Beta-catenin ac-tivation in muscle progenitor cells regulates tissue repair. Cell Rep2016;15:1277–1290. 72. Brack AS, Conboy MJ, Roy S, Lee M, Kuo CJ,
Keller C, et al. Increased Wnt signaling dur-ing agdur-ing alters muscle stem cell fate and increases fibrosis. Science 2007;317:807–810.
73. von Haehling S, Morley JE, Coats AJS, Anker SD. Ethical guidelines for publishing in the Journal of Cachexia, Sarcopenia and Mus-cle: update 2017. J Cachexia Sarcopenia Muscle2017;8:1081–1083.