HAL Id: inserm-00149221
https://www.hal.inserm.fr/inserm-00149221
Submitted on 13 Jun 2008HAL is a multi-disciplinary open access archive for the deposit and dissemination of
sci-L’archive ouverte pluridisciplinaire HAL, est destinée au dépôt et à la diffusion de documents
Predictive performance of the modification of diet in
renal disease and Cockcroft-Gault equations for
estimating renal function.
Marc Froissart, Jérôme Rossert, Christian Jacquot, Michel Paillard, Pascal
Houillier
To cite this version:
Marc Froissart, Jérôme Rossert, Christian Jacquot, Michel Paillard, Pascal Houillier. Predictive performance of the modification of diet in renal disease and Cockcroft-Gault equations for estimating renal function.. Journal of the American Society of Nephrology, American Society of Nephrology, 2005, 16 (3), pp.763-73. �10.1681/ASN.2004070549�. �inserm-00149221�
PREDICTIVE PERFORMANCE OF THE MDRD AND COCKCROFT-GAULT EQUATIONS FOR ESTIMATING RENAL FUNCTION
Marc Froissart124, MD, PhD, Jerome Rossert25, MD, PhD, Christian Jacquot34, MD, Michel Paillard124, MD, Pascal Houillier124, MD, PhD.
1 Department of Physiology and Biophysics, Georges Pompidou Hospital (AP-HP), 2 INSERM U356 and IFR 58, 3 Department of Nephrology, Georges Pompidou Hospital (AP-HP), 4 René Descartes Medical School, Paris V University, 5 Paris VI University, Paris, France
Subject of manuscript: clinical nephrology Word count: 3826
Running title: Prediction equations for estimating GFR
Address for correspondence: Marc Froissart, MD, PhD
Department of Physiology and Biophysics Georges Pompidou European Hospital 20 rue Leblanc
75015 Paris
Tel +33 1 56 09 39 73 Fax +33 1 56 09 26 75
E-mail : marc.froissart@egp.aphp.fr
HAL author manuscript inserm-00149221, version 1
HAL author manuscript
ABSTRACT
Recent recommendations emphasize the need to assess kidney function using creatinine- based predictive equations, in order to optimize the care of patients with chronic kidney disease (CKD). The most widely used equations are the Cockcroft- Gault (CG) and the simplified MDRD formulas. However, they still need to be validated in large samples of subjects, including large non- US cohorts. We compared renal clearance of 51Cr-EDTA with glomerular filtration rate (GFR) estimated using either the Cockcroft - Gault equation or the MDRD formula in a cohort of 2,095 adult Europeans (863 female and 1,232 male, median age 53.2 years, median measured GFR 59.8 mL/min /1.73m2). When the entire study population was considered, the CG and MDRD equations showed very limited bias. They overestimated measured GFR by 1.94 mL/min /1.73m2 and underestimated it by 0.99 mL/min /1.73m2, respectively. However, analysis of subgroups defined by age, gender, BMI, and GFR level showed that the biases of the two formulas could be much larger in selected populations. Furthermore, analysis of the standard deviation of the mean difference between estimated and measured GFR showed that both formulas lacked precision; the CG formula being less precise than the MDRD one in most cases. In the whole study population, the standard deviation was 15.1 mL/min /1 .73m2 and 13.5 mL/min /1 .73m2 for the CG and MDRD formulas, respectively. Finally, 29.2% and 32.4% of subjects were misclassified when the CG or MDRD formulas where used to categorize subjects according to the K/DOQI CKD classification, respectively.
Keywords: renal clearance of 51Cr-EDTA, chronic kidney disease, bias, precision, accuracy
INTRODUCTION:
The prevalent and incident rates of end stage renal disease (ESRD) are continuously increasing in all Western countries. Data from the US Renal Data System predict that the number of patients registered with ESRD in 1997 will have doubled in 2010, leading to approximately 700 000 patients with ESRD and 2.2 million patients in 2030 (32), and similar trends are anticipated in other countries (27, 23, 14, 4, 22). In order to level off these incident rates, various initiatives, such as the Kidney Disease Outcomes Quality Initiative (K/DOQI), have provided physicians with guidelines to optimize the care of patients with chronic kidney disease (CKD). These guidelines emphasize the need to assess kidney function using predictive equations rather than serum creatinine alone (25). However, they also highlight the fact that these equations still need to be validated in large samples of subjects, and in particular that they should be tested in non-US populations and in individuals with mild decrease in kidney function or normal GFR (25). Validation of the predictive formulas is also particularly important for patients aged 65 and older, who have by far the highest incident rates of ESRD (27, 23, 14, 4, 22).
The formulas that are most widely used to estimate kidney function, and that are recommended in adults by the K/DOQI guidelines (25), are the Cockcroft- Gault (CG) formula (8) and the recently developed (19) and later simplified (21) Modification of Diet in Renal Disease (MDRD) formula. The CG formula is an estimate of creatinine clearance originally developed in a population of 236 Canadian patients, 209 of which were males. The MDRD formulas have been developed as an estimation of 125 I-Iothalamat e renal clearance- based GFR measurement in a population of 1,628 patients with previously diagnosed Chronic Kidney Disease (27, 23, 14, 4, 22). The mean GFR in this population was 39.8 ± 21.2 mL/min /1 .73m2 and the mean age of the cohort was
50.6 ± 12.7 years.
The K/DOQI CKD guidelines have established a five- stage classification of patients with CKD that is based solely on kidney function. These stages are defined by GFR ³ 90 mL/min /1.73m2 (stage 1), 60 to 89 mL/min /1 .73m2 (stage 2), 30 to 59 mL/min /1 .73m2 (stage 3), 15 to 29 mL/min /1 .73m2 (stage 4), and <15 mL/min /1.73m2 (stage 5), (25). The guidelines state that the stage of kidney disease should be determined for each CKD patient, and that a clinical action plan should be developed based on the stage of disease (25). Thus, inaccurate estimation of kidney function may be responsible for misclassification of some patients and lead to inappropriate evaluation or treatmen t of these patients (13). However, so far, few studies have assessed the applicability of the MDRD and CG formulas to large cohorts of subjects with wide ranges of renal function. One study compared various formulas with 125I-iothalamate GFR, in a cohort of 1,703 African Americans with presumed hypertensive nephrosclerosis and mean serum creatinine levels of 1.85 ± 0.88 mg/dL (27, 23, 14, 4, 22). All other studies focused on much smaller cohorts of subjects with or without CKD (27, 23, 14, 4, 22). Furthermore, with one exception (14), no particular attention was paid to calibration of serum creatinine measurements, while this has been shown to be of critical importance for subjects with normal or near normal serum creatinine values (10, 9). In this study, we compare renal clearance of 51Cr-EDTA (measured GFR) with GFR estimated by the CG formula (CG GFR) or the MDRD equation (MDRD GFR) in a cohort of 2,095 European subjects. Our findings support the preferential use of the MDRD formula, but raise caution regarding its usage in some subgroups of subjects such as young adults with normal renal function or stage 2 CKD or underweight subjects.
MATERIALS AND METHODS
Patient selection
Records of all patients referred to our Department of Physiology between January 1990 and April 2004 in order to perform GFR measurements were retrospectively reviewed. For patients who had more than one GFR measurement , only the first one was considered. Renal transplant patients and subjects under 18 years of age were excluded. Among the remaining 2,178 independent patients, only 83 were black. Since ethnicity is one of the determinants of the MDRD equation, we decided to exclude black patients and restrict the analysis to the 2,095 non-black individuals, in order to ensure statistical relevance of the study. Among them, 1,933 had CKD and 162 were healthy potential kidney donors.
GFR measuremen ts
Renal clearance of 51Cr-EDTA was determined as previously described (27, 23, 14, 4, 22). Briefly, 3.5 MBq of 51Cr-EDTA (Amersham Health SA) were injected intravenously as a single bolus. The injected dose was reduced to 1.8 MBq in patients with an estimated GFR derived from the CG formula of less than 30 mL/min and in case of body weight lower than 40 kg. After allowing one hour for distribution of the tracer in the extracellular fluid, urine was collected and discarded. Then, average renal 51 Cr-EDTA clearance was determined on five consecutive 30-min clearance periods. Blood was drawn at the midpoint of each clearance period and up to 300 min after injection. The radioactivity measurements in 1-ml plasma and urine samples were carried out on a 3-inch crystal gamma- ray well counter (Packard Cobra, Alberta, MN). When timed
urine samples could not be obtained, plasma clearance of 51Cr-EDTA was calculated according to a simplified method described by Brochner- Mortensen (5). This was performed in 219 patients (10.5 %). In our hands, the coefficients of variation of renal clearance of 51Cr-EDTA and plasma clearance of 51Cr-EDTA were 8.4 ± 5.0 % and 9.0 ± 5.3 %, respectively, while the coefficient of variation of inulin clearance was 9.1 ± 6.3 % in the same 22 patients. When compared to inulin renal clearance the mean bias of EDTA renal clearance was 4.0 ± 4.9 mL/min /1 .73m2 (Froissart et al. manuscript in preparation).
Creatinine assay
All creatinine measurements were performed in the same laboratory. Blood samples were obtained simultaneously with the GFR measurement. A modified kinetic Jaffé colorimetric method was used with a Bayer RA-XT and a Konelab 20 analyzer. A five point calibration was applied in each assay. Prior to measurement, ultrafiltration of plasma through a 20 kDa cut- off membrane (MPS-1, Amicon, Beverly, MA) was performed in order to discard chromogens linked to albumin and other heavy proteins. In the absence of an international standard for creatinine assay, the linearity of the measurements was verified by using plasma samples from normal subjects in which increasing amounts of desiccated creatinine hydrochloride (MW 149.6; Sigma Chemicals, Perth, Australia) had been added.
Linear regression analysis showed that the slope of the relationship between measured and expected creatinine concentrations was1.008 ± 0.006 (95% confidence interval 0.997 - 1.020) and that the Y-intercept was 0.014 ± 0.013 (95% confidence interval -0.013 - 0.041), (Figure 1). Squared Spearman rank coefficient of correlation was
0.998. Internal quality controls showed a coefficient of variation of 2.3 % during the period. An indirect evaluation of the stability of the measurement was obtained from the ratiometric expression of MDRD/GFR values over time. No clear shift was observed during the entire study period, supporting the absence of variation in creatinine calibration (data not shown). Calibration of our creatinine measurements [HEGPcr.] to the ones of the MDRD laboratory [MDRDcr.] (Dr F. Van Lente) showed a linear relationship defined by the following equation :
[MDRDcr.] = 1.151 x [HEGPcr.] – 0.107
Thus for serum creatinine ranging from 0.6 to 1.2 mg/dL, the difference between both measurements (MDRDcr. – HEGPcr.) is comprised between -0.016 and +0.074 mg/dL.
Creatinine based estimation of GFR
The two formulas that we studied in order to predict GFR from serum creatinine were the one proposed by Cockcroft and Gault (8):
CG GFR = [(140 - Age (yr)) x Weight (kg) / (7.2 x PCr (mg/dL)] x (0.85 if Female) and the simplified form of the MDRD formula (21):
MDRD GFR = 186.3 x PCr (mg/dL)-1.154 x Age (yr)-0.203 x (1.212 if Black) x (0.742 if Female);
Where PCr is plasma creatinine concentration.
A correction for body surface area was necessary for CG formula. This was performed using estimated BSA according to Du Bois (11):
BSA = Weight (kg)0.425 x Height (m)0.725 x 0.20247
Statistical analysis
Demographic data were expressed as mean ± standard deviation (SD) or median and Interquartile Range (IQR), as appropriat e.
Estimated and measured GFR are statistically dependent variables. In order to compare the creatinine- based estimations of GFR with the renal clearance of 51 Cr-EDTA, we used Bland and Altman recommendations for such evaluations (1). The mean difference between estimated and measured GFR values directly estimat es the global bias. The width of the standard deviation of the mean difference is an estimation of precision; a large width meaning a low precision.
The absolute of the difference between estimated and measured GFR was used to estimate the accuracy of the creatinine- based formulas. It was expressed either in mL/min /1.73m2 or in percentage of GFR values and was represented in percentiles (50th, 75th, and 90th), allowing to draw absolute and relative boundaries for the lack of accuracy. The accuracy was also measured as the percentage of results not deviating more than 15, 30 and 50% from the measured GFR.
The combined root mean square error (CRMSE) was examined. CRMSE is calculated as the square root of [(mean difference between estimated and measured GFR)2 + (SD of the difference)2]. It measures both bias and precision (27, 23, 14, 4, 22).
Statistical analyses were performed using Statview 5.0 software (SAS, Cary, NC)
RESULTS
1. Demographics and GFR distribution.
The main characteristics of the study population are shown in Table 1. All 162 kidney donors were under 65 years of age. Measured GFR values were equally distributed above (1,044 subjects) and below (1,051 subjects) 60 mL/min /1 .73m2. For subsequent analyses, the study population was divided into subgroups according to gender, age (18 to 64 years versus 65 years or older), and /or measured GFR (³ 60 mL/min /1 .73m2 versus < 60 mL/min /1.73m2).
Two-way ANOVA test showed that measured GFR values differed with respect to gender and age. Females had higher measured GFR values than males (65.8 ± 33.8 versus 57.9 ± 31.5 mL/min /1 .73m2, p < 0.0001). Subjects 65 years or older had lower GFR values than younger ones (45.2 ± 24.3 versus 67.4 ± 33.4 mL/min /1.73m2, p < 0.0001). However no significant interaction between gender and age was observed (p = 0.2880).
2. Relationships between creatinine- based estimations of GFR and measured
GFR
The relationships between measured GFR and MDRD GFR or CG GFR are depicted in Figures 2 and 3, respectively. As shown in Figures 2A and 3A, standard regression analyses of these relationships showed a good global agreement between the two variables (r = 0.910 and 0.894, respectively). However, as extensively studied by Bland and Altman, the measurement of agreement between two methods should be preferentially expressed using bias plots of the difference against the average (27, 23,
14, 4, 22). Such a plot showed a mean difference of - 0.99 mL/min /1 .73m2 between MDRD GFR and measured GFR (Figure 2B), which corresponds to a statistically significant (p = 0.001) but rather limited bias of the MDRD equation. Similarly, when applied to CG GFR, the Bland and Altman plot showed a mean difference of 1.94 mL/min /1.73m2 (Figure 3B), which is highly statistically significant (p < 0.0001) but has limited clinical implications. However, for both formulas, the biases were not uniform over the whole range of GFR values (Table 2A).
The performance of an equation largely depends on its precision. The standard deviation of the mean difference was used to characterize the precision of each equation. It was 13.7 and 15.4 mL/min /1.73m2 for the MDRD and CG formulas, respectively. However, as observed in Figures 2B and 3B, this lack of precision was not identical throughout the whole range of GFR values, and both formulas were much more precise for low GFR values. This led us to analyze the precision of each formula according to GFR levels (Table 2A). For all categories of GFR, the MDRD formula was more precise than the CG one (Table 2A).
Accuracy is a global indicator of the performance of a formula, that takes into account its bias and its precision. We tested the accuracy of both formulas in subjects with measured GFR higher and lower than 60 mL/min /1 .73m2 by calculating CRMSE and by determining the percentage of subjects not deviating from more than 15, 30 and 50% from measured GFR (Accuracy within in Table 2B). In all cases, and with both measurements of accuracy, the MDRD formula had better performances than the CG one (Table 2B).
Since, the performance of a regression- based equation depends on the population the
equation is applied to, we tested the performance of the equations in CKD patients and in kidney donors (Table 3A and 3B). We also assessed the sensitivity and specificity of the two formulas for assigning CKD patients to the categories defined by the KDOQI CKD classification (Table 3A) (25). Performance of the MDRD equation was slightly but not significantly bett er in kidney donors (Table 3B) than in stage 1 or 2 CKD patients (Anova, p = 0.49, NS). The CG formula was less biased in stage 1 or 2 CKD patients than in kidney donors (Anova, p = 0.001).
3. Comparison of bias and precision of estimated GFR values according to gender and
age
Besides plasma creatinine values, gender, age and weight are the three parameters that are taken into account in the MDRD and /or CG formulas. We thus analyzed the performance of these two formulas according to age, gender, and BMI. As a first step, we focused on gender and age, since these parameters are used in both formulas. Biases of the MDRD and CG formulas with respect to gender and in two different age groups are shown in Figure 4. A cut- off age of 65 years was chosen, since data from the United States Renal Data System show that the incident rates of ESRD are more than two- fold higher in subjects 65 years or older than in younger ones (32). The bias of the MDRD formula was very small in all subgroups, except for female under 65 years of age (bias: -3.1 ± 17.2 mL/min /1.73m2), while the biases of the CG formula were always significantly larger (p < 0.0001).
The precision, and accuracy of the two formulas according to gender and age are reported in Table 4. The MDRD formula was more precise and accurate than the CG
one in all subgroups of patients; the only exception being the subgroup of female 65 years or older with a measured GFR <60 mL/min /1 .73m2.
Another approach to estimate the global accuracy of the formulas was to analyze the absolute of the difference between estimated and measured GFR values (27, 23, 14, 4, 22). It was expressed both in mL/min /1 .73m2 and as a percentage of GFR values, and represent ed in percentiles (50th, 75th, and 90th), to allow the drawing of absolute and relative boundaries for the lack of accuracy (Figures 5A and 5B). In all cases, the MDRD formula was at least as accurate as the CG one. The CG formula principally lacked accuracy in subjects younger than 65 years and with GFR values <60 mL/min /1.73m2 while the accuracy of the MDRD formula was much more uniform (Figure 5B).
4. Comparison of bias and precision of estimated GFR values according to body
mass index
The cohort was divided into four standard subgroups according to body mass index (BMI) values: < 18.5 kg/m2 (underweight, 94 subjects), between 18.5 and 24.9 kg/m2 (normal, 1,010 subjects), between 25 and 29.9 kg/m2 (overweight, 712 subjects) and ³ 30 kg/m2 (obese, 279 subjects). ANOVA analysis showed that each BMI class was associated with statistically different GFR values (55.1 ± 32.0, 64.3 ± 32.9, 60.9 ± 32.2, and 52.2 ± 31.5 mL/min /1.73m2 from underweight to overweight subjects, respectively, p < 0.0001). As shown in figure 6, the MDRD formula largely overestimated kidney function in underweight subjects; the bias observed for this subgroup (12.2 ± 24.8 mL/min /1 .73m2) being significantly higher than the one
observed for all other classes of BMI (p < 0.0001 by ANOVA test). In all other subgroups, the MDRD formula was less biased, more precise and more accurate than the CG one (Figure 6).
5. Consequences of the limitations of the MDRD and Cockcroft formulas on the
K/DOQI CKD classification
The K/DOQI guidelines recommend to define a clinical action plan for each patient with CKD, based on the stage of disease as defined by the K/DOQI CKD classification (25). Therefore, we evaluated the consequences of the limitations of the MDRD and CG formulas on the classification of CKD patients (Table 5A). This analysis was based solely on results of GFR determinations and all 2,095 subjects were considered, whether or not they had kidney damage. For subjects with GFR ³ 90 mL/min /1.73m2, the CG formula was slightly more accurate than the MDRD one, but for all other GFR levels, more subjects were classified in the proper stage by the MDRD formula than by the CG one (Table 5A). Overall, only 70.8% and 67.6% of subjects were classified in the correct stage by the MDRD and CG formulas, respectively. Using the average values of both formulas to estimate GFR did not improve the accuracy of the prediction (Table 5B). The consequences of the limitations of the formulas can also be depicted by a figure plotting prediction intervals of measured GFR as a function of estimated GFR (Figure 7).
DISCUSSION
In this study, we evaluated the performances of the CG and MDRD formulas for estimating GFR, in a cohort of 2,095 subjects. As recommended by the K/DOQI guidelines, these two formulas are increasingly used in daily clinical practice and decisions regarding the care of CKD patients are based on estimated GFR, but their accuracy is still debat ed (20).
An important characteristics of our cohort is that it included subjects whose measured GFR ranged from 2.3 to 166.4 mL/min /1.73m2 (IQR: 33.6 - 87.3 mL/min /1 .73m2), with similar numbers of subjects having measured GFR values above and below 60 mL/min /1.73m2 (1,044 and 1,051 subjects, respectively). Thus, the performances of the CG and MDRD formulas could be assessed over a wide range of kidney function. Furthermore, since the vast majority of patients included in this study were Europeans the performances of the MDRD and CG formulas could be assessed in a group of subjects whose anthropometric charact eristics are slightly different from those of Americans. For example, when compared to the MDRD cohort (27, 23, 14, 4, 22), the mean weight of our study population was 11.2% lower (70.7 ± 15.3 kg versus 79.6 ± 16.8 kg), and the mean body surface area was 6.3% lower (1.79 ± 0.21 kg/m2 versus 1.91 ± 0.23 kg/m2), while on average our patients were only 2.2 years older than those included in the MDRD cohort (52.8 ± 16.5 years versus 50.6 ± 12.7 years) and while a similar percentage of subjects were male in both cohorts (59% versus 60%).
Recent studies have emphasized the importance of careful calibration of serum creatinine measurements to reliably estimate GFR in patients with normal or near normal renal function, using creatinine-based equations (10, 9). In the absence of international standard, we have used
plasma samples supplemented with precise amounts of creatinine hydrochloride to calibrate our assay. Analysis of the relationship between expected and measured creatinine concentration strongly suggests that our assay reliably measures creatinine concentrations. The relationship between measured and expected creatinine concentrations was linear over a wide range of values, and not different from the identity line. Furthermore, in our population, the ratio of MDRD GFR over measured GFR did not vary over time, which suggests that no calibration bias occurred over time. This careful calibration of plasma creatinine measurements may explain that, for subjects with normal or near normal kidney function, we found much less differences between estimated and measured GFR than in other studies (27, 23, 14, 4, 22).
In this study, GFR was measured by renal clearance of 51Cr-EDTA, while renal clearance of 125 I-iothalamate has been used by studies in North America. However, the performance of our method is similar to what has been reported for iothalamate clearance (26).
Analysis of bias, a measure of systematic error, in the entire study population showed a very good global agreement between estimated and measured GFR for each of the two formulas. On average, estimated GFR was only 1.0 mL/min/1.73m2 lower than measured GFR with the MDRD formula and 1.9 mL/min/1.73m2 higher with the CG formula. A similar bias has been observed when the CG formula was compared to GFR measured by 125I-iothalamate clearance in all patients screened for the AASK study; the mean difference between estimated and measured GFR being –2.7 mL/min/1.73m2 (27, 23, 14, 4, 22). In contrast, in the MDRD cohort, the CG formula was shown to largely overestimate measured GFR (19). The reasons for this discrepancy are not clear, but it may be due to differences in patients characteristics.
When estimating the performance of a formula, precision is probably more important than bias. Our study showed that both the MDRD and CG formulas largely lack
highlighted the global lack of precision of these two formulas (27, 23, 14, 4, 22). However, in our analysis their performances were quite different in various subgroups of subjects. The greatest lack of precision was observed for subjects less than 65 years with measured GFR above 60 mL/min /1 .73m2, for underweight subjects, and, in the case of the CG formula, for obese subjects.
Analysis of the ability of a formula to classify patients in different subgroups depends on the charact eristics of the population. In particular, it depends on the proportion of patients who happen to be near the boundaries of the subgroups. In our series, analysis of the performance of both formulas to classify patients according to the K/DOQI CKD classification showed that only 70.8% of subjects were classified in the proper category when using the MDRD formula and 67.6% when using the CG one, which clearly highlights the limitations of both formulas. For example, when using the CG and the MDRD formulas, 28.8% and 16.7% of stage 4 CKD patients were misclassified as stage 3 CKD patients, respectively, which could introduce undue delays in the preparation for renal replacement therapy. By contrast, about 20% of subjects with measured GFR ³ 60 mL/min /1 .73m2 were classified as having stage 3 CKD with both formulas, which could lead to unnecessary assessment of CKD-related complications. Use of the average of the two formulas did not decrease the misclassification rate, which answers to one the K/DOQI research recommendations (25). In order not to be misled by the use of the formulas when taking care of individual CKD patients, it is probably important to keep in mind the width of the prediction interval for GFR associated with each value of estimated GFR (Figure 7).
In conclusion, in a study population of 2,095 European subjects, the MDRD formula provided more reliable estimations of kidney function than the CG formula. However, both formulas lacked precision, and using either one of them for defining the stage of disease according to the K/DOQI CKD classification would have led to inappropriate staging of about 30% of subjects.
ACKNOWLEDGEMENTS
We gratefully thank Dr Van Lente for measuring plasma creatinine samples at the Cleveland Clinic Foundation.
Part of this work was presented during the annual meeting of the American Society of Nephrology in 2002.
REFERENCES
1. Bland, JM & Altman, DG: Statistical methods for assessing agreement between two methods of clinical measurement. Lancet, 1: 307-10, 1986.
2. Bland, JM & Altman, DG: Comparing methods of measurement: why plotting difference against standard method is misleading. Lancet, 346: 1085-7, 1995.
3. Bland, JM & Altman, DG: Measuring agreement in method comparison studies. Stat Methods Med Res, 8: 135-60, 1999.
4. Bostom, AG, Kronenberg, F & Ritz, E: Predictive performance of renal function equations for patients with chronic kidney disease and normal serum creatinine levels. J Am Soc Nephrol, 13: 2140-4, 2002.
5. Brochner-Mortensen, J: A simple method for the determination of glomerular filtration rate. Scand. J. Lab. Invest., 30: 271-274, 1972.
6. Brochner-Mortensen, J & Freund, LG: Reliability of routine clearance methods for assessment of glomerular filtration rate in advanced renal insufficiency. Scand. J. Lab. Invest., 41: 91-97, 1981.
7. Chantler, C, Garnett, ES, Parsons, V & Veall, N: Glomerular filtration rate measurement in man by the single injection methods using 51Cr-EDTA Clin. Science., 37: 169-180, 1969. 8. Cockcroft, DW & Gault, MH: Prediction of creatinine clearance from serum creatinine. Nephron, 16: 31-41, 1976.
9. Coresh, J, Astor, BC, McQuillan, G, Kusek, J, Greene, T, Van Lente, F & Levey, AS: Calibration and random variation of the serum creatinine assay as critical elements of using equations to estimate glomerular filtration rate. Am. J. Kidney Dis., 39: 920-929, 2002.
10. Coresh, J, Eknoyan, G & Levey, AS: Estimating the prevalence of low glomerular filtration rate requires attention to the creatinine assay calibration. J Am Soc Nephrol, 13: 2811-2; discussion 2812-6, 2002.
11. Du Bois, D & Du Bois, EF: A formula to estimate the approximate surface area if height and weight are known. Arch. Intern. Med., 17: 863-871, 1916.
12. ERA-EDTA: ERA-EDTA Registry 2002 Annual Report (, Amsterdam, The Netherlands, Academic Medical Center 2004.
13. Froissart, M, Fouqueray, B, Houillier, P, Jacquot, C, Prie, D, Rossert, J, Urena, P &
Vrtovsnik, F: Classification of the stages of chronic renal disease: limitations and pitfalls using
Cockcroft's formula versus GFR measurement. J Am Soc Nephrol, 13: 431A, 2002.
14. Hallan, S, Asberg, A, Lindberg, M & Johnsen, H: Validation of the Modification of Diet in Renal Disease formula for estimating GFR with special emphasis on calibration of the serum creatinine assay. Am J Kidney Dis, 44: 84-93, 2004.
15. Jager, KJ, van Dijk, PC, Dekker, FW, Stengel, B, Simpson, K & Briggs, JD: The epidemic of aging in renal replacement therapy: an update on elderly patients and their outcomes. Clin
Nephrol, 60: 352-60, 2003.
16. Jungers, P, Chauveau, P, Descamps-Latscha, B, Labrunie, M, Giraud, E, Man, NK, Grunfeld, JP & Jacobs, C: Age and gender-related incidence of chronic renal failure in a French urban area: a prospective epidemiologic study. Nephrol Dial Transplant, 11: 1542-6, 1996.
17. Klahr, S, Levey, AS, Beck, GJ, Caggiula, AW, Hunsicker, L, Kusek, JW & Striker, G: The effects of dietary protein restriction and blood pressure control on the progression of chronic renal disease. New Engl J Med, 330: 877-884, 1994.
18. La Batide-Alanore, A, Azizi, M, Froissart, M, Raynaud, A & Plouin, PF: Split renal function outcome after renal angioplasty in patients with unilateral renal artery stenosis. J Am Soc
Nephrol, 12: 1235-41, 2001.
19. Levey, AS, Bosch, JP, Lewis, JB, Greene, T, Rogers, N & Roth, D: A more accurate method to estimate glomerular filtration rate from serum creatinine: a new prediction equation.
Modification of Diet in Renal Disease Study Group. Ann Intern Med, 130: 461-470, 1999. 20. Levey, AS, Coresh, J, Eknoyan, G & Levin, N: K/DOQI clinical practice guidelines on chronic kidney disease. Am. J. Kidney. Dis., 39: S1-S266, 2002.
21. Levey, AS, Greene, T, Kusek, JW & Beck, GJ: A simplified equation to predict glomerular filtration rate from serum creatinine. J Am Soc Nephrol, 11: 155A, 2000.
22. Lewis, J, Agodoa, L, Cheek, D, Greene, T, Middleton, J, O'Connor, D, Ojo, A, Phillips, R, Sika, M & Wright, J, Jr.: Comparison of cross-sectional renal function measurements in African Americans with hypertensive nephrosclerosis and of primary formulas to estimate glomerular filtration rate. Am J Kidney Dis, 38: 744-53, 2001.
23. Lin, J, Knight, EL, Hogan, ML & Singh, AK: A Comparison of Prediction Equations for Estimating Glomerular Filtration Rate in Adults without Kidney Disease. J Am Soc Nephrol, 14: 2573-80, 2003.
24. Manjunath, G, Sarnak, MJ & Levey, AS: Prediction equations to estimate glomerular
filtration rate: an update. Curr. Opin. Nephrol. Hypertens., 10: 785-792, 2001.
25. NKF: K/DOQI Clinical practice guideline to define chronic kidney disease : Evaluation, classification and stratification. Am J Kidney Dis, 39 Suppl. 1: S1-S266, 2002.
26. Perrone, RD, Steinman, TI, Beck, GJ, Skibinski, CI, Royal, HD, Lawlor, M & Hunsicker, LG: Utility of radioisotopic filtration markers in chronic renal insufficiency: simultaneous comparison of 125I-Iothalamate, 169Yb-DTPA, 99mTc-DTPA, and inulin. Am. J. Kidney Dis., 26: 224-235, 1990.
27. Rule, AD, Gussak, HM, Pond, GR, Bergstralh, EJ, Stegall, MD, Cosio, FG & Larson, TS: Measured and estimated GFR in healthy potential kidney donors. Am J Kidney Dis, 43: 112-9, 2004.
28. Schaubel, DE, Morrison, HI, Desmeules, M, Parsons, DA & Fenton, SS: End-stage renal disease in Canada: prevalence projections to 2005. C M A J, 160: 1557-63, 1999.
29. Stengel, B, Billon, S, Van Dijk, PC, Jager, KJ, Dekker, FW, Simpson, K & Briggs, JD: Trends in the incidence of renal replacement therapy for end-stage renal disease in Europe, 1990-1999. Nephrol Dial Transplant, 18: 1824-33, 2003.
30. Stoves, J, Lindley, EJ, Barnfield, MC, Burniston, MT, Newstead, CG, Vervoort, G, Willems, HL & Wetzels, JF: MDRD equation estimates of glomerular filtration rate in potential living kidney donors and renal transplant recipients with impaired graft function
Assessment of glomerular filtration rate in healthy subjects and normoalbuminuric diabetic patients: validity of a new (MDRD) prediction equation. Nephrol Dial Transplant, 17: 2036-7., 2002.
31. Toto, RD, Kirk, KA, Coresh, J, Jones, C, Appel, L, Wright, J, Campese, V, Olutade, B & Agodoa, L: Evaluation of serum creatinine for estimating glomerular filtration rate in African Americans with hypertensive nephrosclerosis: results from the African-American Study of Kidney Disease and Hypertension (AASK) Pilot Study. J Am Soc Nephrol, 8: 279-87, 1997. 32. USRDS: Incidence and Prevalence of ESRD. In: U.S. Renal Data System 2003 Annual Data Report. Bethesda, MD, National Institutes of Health. National Institutes of Diabetes and Digestive and Kidney Diseases, 2003, pp 47-60.
33. Vervoort, G, Willems, HL & Wetzels, JF: Assessment of glomerular filtration rate in healthy subjects and normoalbuminuric diabetic patients: validity of a new (MDRD) prediction equation. Nephrol Dial Transplant, 17: 1909-1913, 2002.
Table 1: Demographic and clinical characteristics of study population. Data are given as mean ± SD (median / interquartile range)
BSA: body surface area; BMI: body mass index
Overall Female (n = 863) Male (n = 1,232) (n = 2,095) Age < 65 (n = 630) Age ³ 65 (n = 233) Age < 65 (n = 870) Age ³ 65 (n = 362) Plasma creatinine (mg/dL) 1.69 ± 1.25 (1.24 /0.91- 2.01) 1.29 ± 1.06 (0.91/0.75- 1.39) 1.58 ± 1.12 (1.22/0.89- 1.94) 1.79 ± 1.31 (1.31/0.97- 2.10) 2.22 ± 1.27 (1.77/1.31- 2.75) GFR (mL/min /1.73m2) 61.1 ± 32.7 (59.8 /33.6- 87.3) 72.2 ± 34.1 (79.0 /41.2- 97.6) 48.3 ± 26.0 (45.8/27.3- 64.2) 64.0 ± 32.5 (65.7/35.5- 90.0) 43.3 ± 22.9 (41.9/23.0- 60.4) Age (year) 52.8 ± 16.5 (53.2 /40.2- 66.7) 43.5 ± 12.2 (44.8 /34.8- 53.2) 72.9 ± 5.1 (73.0/68.7- 76.1) 46.0 ± 12.3 (47.9/36.6- 56.0) 72.5 ± 4.8 (72.2/68.3- 75.4) Weight (kg) 70.7 ± 15.3 (69.4 /60.0- 80.0) 62.7 ± 15.0 (60.0 /53.0- 69.2) 64.5 ± 11.1 (64.0/56.0- 72.0) 76.1 ± 14.1 (75.2/67.0- 84.3) 75.8 ± 13.2 (74.4/67.0- 82.6) Height (cm) 167 ± 9 (168/161- 174) 161 ± 7 (161/157- 166) 157 ± 6 (156/152- 160) 173 ± 7 (173/169- 178) 170 ± 7 (170/165- 174) BSA (m2) 1.79 ± 0.21 (1.79 /1.64- 1.93) 1.65 ± 0.18 (1.63/1.54- 1.75) 1.64 ± 0.14 (1.64/1.54- 1.74) 1.90 ± 0.18 (1.89/1.78- 2.01) 1.87 ± 0.17 (1.85/1.76- 1.97) BMI (kg/m2) 25.2 ± 4.8 (24.7 /22.0- 27.8) 24.1 ± 5.8 (22.8 /20.6- 26.7) 26.3 ± 4.4 (26.2/23.0- 29.3) 25.3 ± 4.2 (25.0/22.5- 27.7) 26.2 ± 4.4 (25.8/23.8- 28.2)
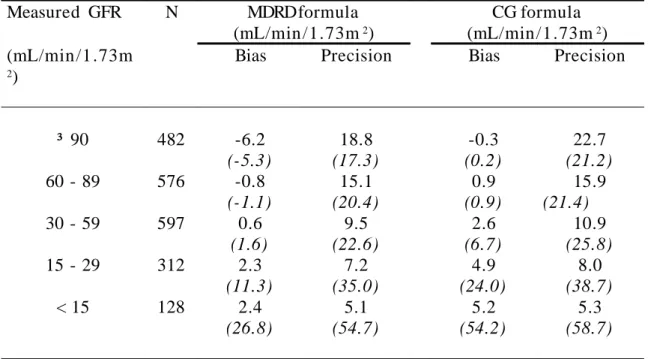
Table 2A: Bias and precision of the MDRD and CG formulas. Results obtained with these formulas were compared to GFR values obtained by measuring the renal clearance of 51Cr EDTA. The study population was divided into five categories,
according to the GFR levels used to define the five stages of CKD in the K/DOQI CKD classification [NKF, 2002 #411]. Measured GFR N MDRD formula (mL/min /1.73m2) CG formula (mL/min /1 .73m2) (mL/min /1 .73m 2)
Bias Precision Bias Precision
³ 90 482 -6.2 (-5.3) 18.8 (17.3) -0.3 (0.2) 22.7 (21.2) 60 - 89 576 -0.8 (-1.1) 15.1 (20.4) 0.9 (0.9) 15.9 (21.4) 30 - 59 597 0.6 (1.6) 9.5 (22.6) 2.6 (6.7) 10.9 (25.8) 15 - 29 312 2.3 (11.3) 7.2 (35.0) 4.9 (24.0) 8.0 (38.7) < 15 128 2.4 (26.8) 5.1 (54.7) 5.2 (54.2) 5.3 (58.7)
Bias is defined as the mean difference between Estimated and Measured GFR. Precision is one standard deviation of bias.
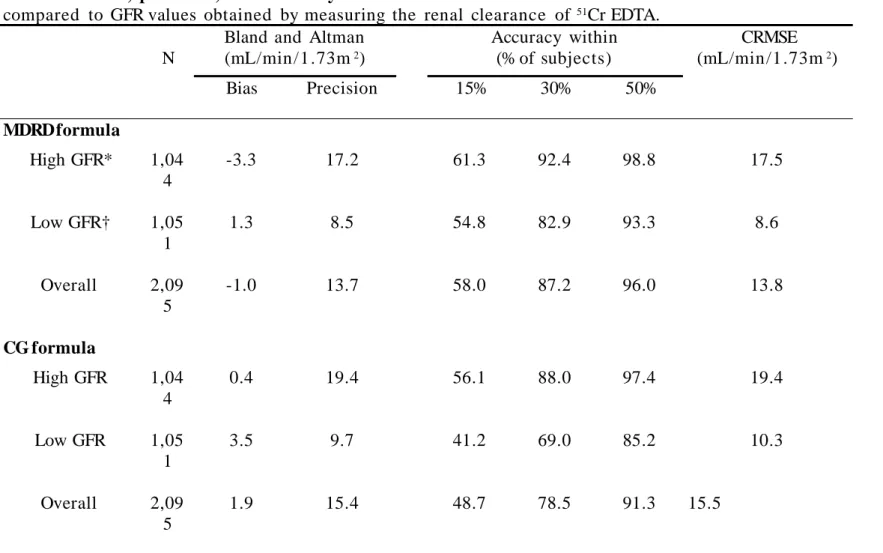
Table 2 B: Bias, precision, and accuracy of the MDRD and CG formulas . Results obtained with these formulas were
compared to GFR values obtained by measuring the renal clearance of 51Cr EDTA.
N
Bland and Altman (mL/min/1.73m2) Accuracy within (% of subjects) CRMSE (mL/min/1.73m2) Bias Precision 15% 30% 50% MDRD formula High GFR* 1,04 4 -3.3 17.2 61.3 92.4 98.8 17.5 Low GFR† 1,05 1 1.3 8.5 54.8 82.9 93.3 8.6 Overall 2,09 5 -1.0 13.7 58.0 87.2 96.0 13.8 CG formula High GFR 1,04 4 0.4 19.4 56.1 88.0 97.4 19.4 Low GFR 1,05 1 3.5 9.7 41.2 69.0 85.2 10.3 Overall 2,09 5 1.9 15.4 48.7 78.5 91.3 15.5
*High GFR: measured GFR ³ 60 mL/min /1.73m2, †Low GFR: measured GFR < 60 mL/min/1.73m2
Bias is defined as the mean difference between Estimated and Measured GFR. Precision is one standard deviation of bias. Accuracy was assessed by determining the percentage of subjects not deviating from more than 15, 30 and 50% from measured GFR, and by calculating the combined root mean square error (CRMSE).
Table 3A: Performances of the MDRD and CG formulas according to CKD classes in CKD patients. CKD patients were
divided into five categories, according to the GFR levels used to define the five stages of CKD in the K/DOQI CKD
classification [NKF, 2002 #411]. Results obtained with these formulas were compared to GFR values obtained by measuring the renal clearance of 51Cr EDTA. Sensitivity and specificity of each formula for assigning patients to the K/DOQI categories
of CKD as defined by GFR was also analyzed.
Measured GFR N MDRD formula (mL/min/1.73m2) CG formula (mL/min/1.73m2) (mL/min/1.73m 2)
Bias Precision Sensitivity Specificity Bias Precision Sensitivity Specificity
³ 90 370 -6.3 19.8 65.7 94.9 -1.4 24.0 69.2 93.5
60 - 89 526 -1.0 15.5 62.7 86.1 0.2 15.9 59.7 85.9
30 - 59 597 0.6 9.5 78.1 86.8 2.6 10.9 77.9 84.5
15 - 29 312 2.3 7.2 78.9 93.9 4.9 8.0 67.6 92.8
< 15 128 2.4 5.1 64.8 99.3 5.2 5.3 43.0 99.5
Bias is defined as the mean difference between Estimated and Measured GFR. Precision is one standard deviation of bias. Sensitivity is the percentage of well-classified patients within each CKD class.
Specificity is the percentage of patients not belonging to the CKD class of interest that are not classified in this category by the formula.
Table 3 B: Performances of the MDRD and CG formulas according to CKD classes in kidney donors. Kidney donors were divided into two categories, according to the GFR levels used to define the five stages of CKD in the K/DOQI CKD classification [NKF, 2002 #411]. Results obtained with these formulas were compared to GFR values obtained by measuring the renal clearance of 51Cr EDTA.
Measured GFR N MDRD formula (mL/min /1 .73m2) CG formula (mL/min /1 .73m2) (mL/min /1 .73m 2)
Bias Precision Bias Precision
³ 90 112 -5.8 15.3 3.3 17.3
60 - 89 50 0.6 11.5 8.3 14.3
Bias is defined as the mean difference between Estimated and Measured GFR. Precision is one standard deviation of bias.
Table 4: Performance of the MDRD and CG formulas according to gender, age and GFR levels . Data are presented as bias (absolute / relative), precision (absolute /
relative) and (CRMSE), all in mL/min /1 .73m2 or in %.
MDRD GFR CG GFR
Male Female Male Female
High GFR* Age ≥ 65 yr. -5.9 / -8.0 12.1 / 16.2 (13.5) -1.6 / -1.0 11.5 / 14.2 (11.6) -14.5 / -19.7 10.4 / 13.4 (17.9) -10.7 / -12.4 12.2 / 13.5 (16.2) Age < 65 yr. -0.6 / -0.2 16.4 / 18.6 (16.4) -6.1 / -5.4 19.3 / 20.7 (20.3) 3.2 / 4.1 17.1 / 19.2 (17.4) 2.5 / 3.7 22.2 / 22.7 (22.3) Low GFR† Age ≥ 65 yr. 0.5 / 5.6 6.7 / 31.4 (6.7) 1.2 / 7.6 8.2 / 34.1 (8.3) -2.3 / -0.2 7.2 / 32.0 (7.6) -0.1 / 7.6 8.0 / 36.2 (8.0) Age < 65 yr. 1.4 / 7.0 8.2 / 27.5 (8.3 ) 2.3 / 10.5 10.7 / 41.6 (10.9 ) 5.9 / 24.8 8.8 / 35.2 (10.6) 8.7 / 32.8 10.5 / 43.6 (13.6) Overall -0.2 / 2.7 12.2 / 25.1 (12.2) -2.2 / 1.5 15.6 / 30.6 (15.7) 1.5 / 8.0 13.7 / 30.7 (13.7) 2.5 / 10.7 17.6 / 34.5 (17.7)
*High GFR : ≥ 60 mL/min /1 .73m2, †Low GFR : < 60 mL/min /1.73m2
Table 5A: Classification of the study population according to the MDRD and CG formulas . Measured GFR was used to
divide the study population into five categories corresponding the five stages of CKD in the K/DOQI CKD classification [NKF, 2002 #411]. For each category, the subjects were then reclassified according to the MDRD formula and to the CG formula. Numbers in bold correspond to the percentages of subjects who did not change stage when their GFR level was estimated using a creatinine- based formula. The existence of kidney damage was not taken into account for this analysis. Subjects with measured GFR (mL/min/1.73m2) N Classification based on the MDRD formula Classification based on the CG formula Stage 1 Stage 2 Stage 3 Stage 4 Stage 5 Stage 1 Stage 2 Stage 3 Stage 4 Stage 5 ³ 90 (stage 1) 482 66.8% 32.6% 0.6% 0% 0% 72.2% 27.6% 0.2% 0% 0% 60 – 89 (stage 2) 576 15.6% 63.7% 20.5% 0.2% 0% 21.7% 58.7% 19.4% 0.2% 0% 30 – 59 (stage 3) 597 0.5% 11.9% 78.1% 9.5% 0% 0.5% 13.9% 77.9% 7.7% 0% 15 – 29 (stage 4) 312 0% 0.3% 16.7% 78.8% 4.2% 0% 0.6% 28.8% 67.6% 2.9% < 15 (stage 5) 128 0% 0% 3.1% 32.0% 64.8% 0% 0% 3.1% 53.9% 43.0%
Table 5B: Classification of the study population according to the average of MDRD and CG formulas. Measured GFR was used to divide the study population into five categories corresponding the five stages of CKD in the K/DOQI CKD classification [NKF, 2002 #411]. For each category, the subjects were then reclassified according to the average of MDRD and CG formulas. Numbers in bold correspond to the percentages of subjects who did not change stage when their GFR level was estimated using a creatinine- based formula. The existence of kidney damage was not taken into account for this analysis.
Subjects with measured GFR (mL/min /1 .73m2)
N Classification based on the
average of CG and MDRD formulas Stage 1 Stage 2 Stage 3 Stage 4 Stage 5 ³ 90 (stage 1) 482 69.5% 30.5% 0% 0% 0% 60 – 89 (stage 2) 576 17.9% 63.5% 18.4% 0.2% 0% 30 – 59 (stage 3) 597 0.3% 12.1% 80.1% 7.5% 0% 15 – 29 (stage 4) 312 0% 0.3% 22.1% 74.4% 3.2% < 15 (stage 5) 128 0% 0% 3.9% 40.6% 55.5%
FIGURES (figures are separately submitted as Tiff or eps files)
Figure 1
Figure 2
A B
Figure 3
A B
Figure 4
Figure 5A
Figure 5B
Figure 7
LEGENDS TO FIGURES
Figure 1: Relationship between theoretical and measured plasma creatinine concentrations. Increasing amounts of desiccated creatinine hydrochloride were added to plasma samples drawn from normal subjects; creatinine concentrations were measured. The measured values were then plotted against the expected values. Solid line represents the linear regression relationship; dashed lines represent the upper and lower boundaries of the 95% confidence interval of the slope of the relationship.
Figure 2: (A) Relationship between measured GFR and MDRD GFR. (B) Bland and Altman plot comparing measured GFR and MDRD GFR. The mean difference (M) is represent ed by the dashed line.
Figure 3: (A) Relationship between measured GFR and CG GFR. (B) Bland and Altman plot comparing measured GFR and CG GFR. The mean difference (M) is represented by the dashed line.
Figure 4. Representation of the mean difference between estimated and measured GFRs in the study population . Mean differences are shown according to the formula used to estimate GFR, and to age groups and gender.
Figure 5: Comparison of accuracy of the MDRD (solid lines) and CG (dashed lines) formulas in GFR prediction, according to gender, age, and measured GFR levels (high GFR: ³ 60 mL/min/1.73m2, low GFR: < 60 mL/min/1.73m2). (A) Plotted values are absolute of
difference between estimated and measured GFR (expressed in mL/min /1.73m2). (B) Plotted values are absolute of relative error between estimated and measured GFR (expressed in %).
Figure 6: Representation of the mean difference between estimated and measured GFRs in the study population . Mean differences are shown according to the formula used to
estimate GFR, and to BMI. The bars in the upper part of the figure represent the bias value in the whole population. Precision is equal to the standard deviation of the mean difference.
Figure 7: Predicted values of the measured GFR as a function of the estimated GFR value using the MDRD formula. Solid lines represent the upper and lower boundaries of the 95% confidence interval of the measured GRF values for each value of estimat ed GFR. Dotted line represents the mean measured GFR value for each value of estimated GFR.