HAL Id: hal-02896884
https://hal.archives-ouvertes.fr/hal-02896884
Submitted on 27 Aug 2020
HAL is a multi-disciplinary open access
archive for the deposit and dissemination of
sci-entific research documents, whether they are
pub-lished or not. The documents may come from
teaching and research institutions in France or
abroad, or from public or private research centers.
L’archive ouverte pluridisciplinaire HAL, est
destinée au dépôt et à la diffusion de documents
scientifiques de niveau recherche, publiés ou non,
émanant des établissements d’enseignement et de
recherche français ou étrangers, des laboratoires
publics ou privés.
Distributed under a Creative Commons Attribution| 4.0 International License
growth processes on calcite exposed to chromium-rich
fluids
Marthe Guren, Christine Putnis, German Montes-Hernandez, Helen King,
François Renard
To cite this version:
Marthe Guren, Christine Putnis, German Montes-Hernandez, Helen King, François Renard. Direct
imaging of coupled dissolution-precipitation and growth processes on calcite exposed to
chromium-rich fluids. Chemical Geology, Elsevier, 2020, 552, pp.119770. �10.1016/j.chemgeo.2020.119770�.
�hal-02896884�
Contents lists available atScienceDirect
Chemical Geology
journal homepage:www.elsevier.com/locate/chemgeo
Direct imaging of coupled dissolution-precipitation and growth processes on
calcite exposed to chromium-rich
fluids
Marthe G. Guren
a,⁎, Christine V. Putnis
b,c, German Montes-Hernandez
d, Helen E. King
e,
François Renard
a,daThe Njord Centre, Departments of Geosciences and Physics, University of Oslo, Norway bInstitute für Mineralogie, University of Münster, 48149 Münster, Germany
cSchool of Molecular and Life Science, Department of Chemistry, Curtin University, Perth 6845, Australia dUniversité Grenoble Alpes, Univ. Savoie Mont Blanc, CNRS, IRD, IFSTTAR, ISTerre, 38000 Grenoble, France eDepartment of Earth Sciences, Utrecht University, Princetonlaan 8a, 3584CB Utrecht, the Netherlands
A R T I C L E I N F O
Editor: Karen Johannesson Keywords:
Hexavalent chromium Calcite
Coupled dissolution-precipitation Crystal growth
Atomic force microscopy Flow-through reactor
A B S T R A C T
Recent increases in industrial activity have resulted in elevated chromium (Cr) pollution in the natural en-vironment, from the degradation of concrete and the leakage of water from landfills or mine waste. The release of toxic chromate ions into the environment could have harmful consequences. Methods for Cr removal are therefore becoming increasingly important to control the release of this highly toxic metal into the environment. This study examines how chromate (CrO42−) can be incorporated into a new, stable solid phase at a dissolving
calcite surface. To study the relationship between solutions containing chromate and calcite, we performed two series of time-lapse atomic force microscopy (AFM) experiments to identify calcite dissolution and growth rates in the presence of chromate. In addition, we conducted complementary experiments in a stirredflow-through reactor to determine the amount of Cr removal from solution. All experiments were performed at room tem-perature and under a constant initial pH in the range 6–12. During the AFM experiments, we observed calcite dissolution via etch pit formation and propagation. In the presence of chromate, nanoparticles of a new phase nucleated and grew at the calcite surface by a coupled dissolution-precipitation process. In experiments with concentrations above 10 ppm Cr or at pH 10 and higher, we observed many nanoparticle precipitates, while precipitates were rarely observed at lower concentrations of Cr. At pH 10.5, the precipitates covered the calcite surface. This partly passivated further calcite dissolution, an observation confirmed by the low amounts of Cr removal measured in theflow-through experiments. Scanning electron microscopy analysis demonstrated that Cr was associated with the precipitates, indicating that Cr could be captured from solution and trapped in solid nanoparticles in the presence of calcite. However, the passivation of the calcite surface by a new precipitate may eventually slow down Cr sequestration.
1. Introduction
Chromium (Cr) is one of the most toxic metals. In natural en-vironments Cr is found in two stable oxidation states, Cr(III)and Cr(VI), where Cr(VI)is more soluble, has a high mobility and is toxic to animals
and plants (e.g.Bartlett and James, 1979;Rakhunde et al., 2012). Thus, if the redox conditions change in the environment, the Cr oxidation state can change, altering the toxicity level. As such, the contaminant level for drinking water is dictated by the total amount of Cr. US En-vironmental Protection Agency (EPA) regulations stipulate that a maximum of 100 ppb Cr can be present in drinking water, whereas in European countries the limit is placed at 50 ppb by the European Food
Safety Authority (EFSA, 2014;Hua et al., 2007;Moraetis et al., 2012). Natural Cr occurrence varies depending on rock types. For example, carbonate rocks and sandstones account for low Cr concentrations (10–19 ppb) in groundwater, while the reaction of ultramafic and ig-neous rocks results in higher Cr concentrations (32 ppb) (Fantoni et al., 2002). Anthropogenic Cr pollution is a significant problem that has been accelerated due to increased mining and the widespread use of Cr in industrial activities due to its resistance to corrosion. Thus, the use of Cr and its mobilization behavior has attracted much interest in tech-nique development aimed at controlling its leachability and/or its re-moval from wastewaters (Zhang and Reardon, 2003; Cornelis et al., 2008;Sánchez-Pastor et al., 2010;Hajji et al., 2019).
https://doi.org/10.1016/j.chemgeo.2020.119770
Received 5 September 2019; Received in revised form 15 June 2020; Accepted 24 June 2020
⁎Corresponding author.
E-mail address:m.g.guren@geo.uio.no(M.G. Guren).
Chemical Geology 552 (2020) 119770
Available online 27 June 2020
0009-2541/ © 2020 The Authors. Published by Elsevier B.V. This is an open access article under the CC BY license (http://creativecommons.org/licenses/by/4.0/).
Recent studies have shown that Cr can be effectively incorporated into minerals as a method of removing it from aqueous solution.Hajji et al. (2019)used a stirredflow-through reactor to study the adsorp-tion/sequestration of Cr and As in three different iron minerals; ferri-hydrite, goethite and siderite. Their results indicated that siderite was the most effective at removing Cr(VI)from water, followed by
ferrihy-drite and goethite. Ca-bearing mineral reactants have also shown pro-mise for removing Cr from solution. For instance,Zhang and Reardon (2003) used hydrocalumite (Ca2Al2(OH)12(OH)2·6H2O) and ettringite
(Ca6Al2(OH)12(SO4)3·26H2O) to extract B, Cr, Mo and Se from
waste-water. They found that both hydrocalumite and ettringite effectively trapped Cr, where hydrocalumite was the most effective as it could reduce the Cr concentration in solution to below US drinking water standards (Zhang and Reardon, 2003).
The more toxic form of Cr in groundwater, Cr(VI), forms the oxya-nion chromate (CrO42−) in aqueous solution. This form has the
po-tential to be incorporated into other oxyanion-bearing minerals, such as calcite (CaCO3) as demonstrated byHua et al. (2007)andTang et al.
(2007). Coprecipitation experiments byHua et al. (2007)showed that chromate becomes immobilized through incorporation into the calcite structure when introduced to a calcite synthesis solution. In addition, analysis of Cr distribution usingμ-X-ray fluorescence demonstrated that Cr(VI)phases have a preferred precipitation position along the obtuse
angle on the calcite surface and that the amount of Cr(VI)in calcite increases with increasing Cr(VI)concentration in the solution. In
con-trast, if chromate was added after the calcite formation, the oxyanion was removed from the solution but could be released again when the calcite was exposed to acidic solutions (Hua et al., 2007).
In recent years, nanoscale imaging studies have shown that coupled carbonate dissolution and precipitation of nanoparticles occurs easily at mineral surfaces (e.g.Ruiz-Agudo et al., 2014). These nanoparticulate phases can trap various oxyanion pollutants including Se, As and Sb (e.g.Putnis et al., 2013;Renard et al., 2013, 2015, 2018). This coupled dissolution-precipitation occurs in the boundary layer at the mineral-water interface (Putnis and Putnis, 2007; Ruiz-Agudo et al., 2014; Renard et al., 2019). Therefore, althoughHua et al. (2007)predict that exposure of calcite to chromate-bearing solutions results in chromate uptake via adsorption, uptake levels could equally be explained via the formation of a new phase that is below the detection limit of X-ray diffraction. The longevity of chromate uptake would be different in the two scenarios as nanoparticles have the potential to transform to more stable phases, whereas adsorption would constitute a more labile chromate pool. The aim of the present study is thus to directly observe and quantify the interaction between calcite and Cr-rich solutions and evaluate how Cr(VI)interacts with calcite by either a coupled
dissolu-tion-precipitation mechanism, adsorption or by Cr-substituted calcite growth.
To study the interactions between calcite and Cr-rich solutions, pH values and Cr(VI) concentrations were selected to represent natural
systems. The amount of Cr in different systems varies from 10 to 19 ppb in carbonate rocks and sandstone (Fantoni et al., 2002) and up to 60 ppm in pore water in soils (Robertson, 1975). The presence of Cr(VI)
in various geological and industrial systems (e.g. Robertson, 1975; Deakin et al., 2001;Cornelis et al., 2008;Fantoni et al., 2002;Moraetis et al., 2012), occurs with a wide range of alkalinity. In ground water and soils, with the presence of Cr, the pH is in the range 7.45–8.1 (Moraetis et al., 2012), while in ophiolitic rocks, serpentine and lime-stones, the pH varies in the range 7–10.5 (Fantoni et al., 2002;Moraetis et al., 2012). In leachates from cement systems, alkaline solid waste and smelter waste from chromate ore processing, the pH is in the range 10–13 (Deakin et al., 2001;Cornelis et al., 2008). In particular,Deakin et al. (2001) found thatfluid leachate containing Ca2+-cations and
CrO42−-anions were hyperalkaline with pH between 10.3 and 11. We
have built on thesefindings, and adapted to our experimental design, e.g. a certain amount of Cr is necessary to observe reactions within experimental time. The tested solutions thus have Cr(VI)concentrations
in the range 10–150 ppm and pH in the range 6–12. 2. Methods
2.1. Atomic force microscopy (AFM) experiments
We performed two series of AFM experiments, labelled CaCrD and CaCrG, where Ca and Cr stand for Calcium and Chromium, respectively. The D refers to the coupled dissolution-precipitation experiments and the G refers to the growth experiments.
2.1.1. Calcite and solutions
A calcite crystal (Iceland spar, Vizcaya, Mexico) was obtained from the Natural History Museum in London. Inductively Coupled Plasma-Optical Emission Spectroscopy (ICP-OES) analyses indicated the high purity of the calcite crystal, with only trace amounts of Mn (31 ppb), Mg (2.8 ppb), and Sr (11.4 ppb). Freshly cleaved rhombohedral frag-ments (~3 × 3 × 1 mm) were cleaved directly before each experiment from a single calcite crystal by putting pressure on a knife blade along one of the cleavage planes.
2.1.1.1. Coupled dissolution-precipitation experiments. As well as deionized water, solutions containing Cr(VI)oxyanions were used and
tested in a range of pH values 6–12. First, double-deionized water (resistivity≥18.2 MΩ·cm−1) was injected in theflow-through fluid cell
of the AFM (Fig. S1a) to initiate dissolution at the calcite surface. Then, solutions with Cr(VI) oxyanions were injected in the fluid cell with increasing concentrations of Cr(VI) but with the same pH. These
solutions were prepared by diluting a stock solution with a concentration of 0.5 M Cr(VI)and 5 M NaCl to obtain solutions with
concentrations of 1, 10, 50 and 100 ppm Cr(VI). Na2CrO4salt was used
as the Cr(VI)source. NaOH and NaCl were used to adjust the pH and
ionic strength (0.05 M) of the solutions.
2.1.1.2. Calcite growth experiments. Three different aqueous solutions were used; deionized water and growth solutions with and without Cr(VI). The growth solutions contained CaCl2 and NaHCO3 and the
amounts were adjusted based on thermodynamic calculations using the PHREEQC software (version 3,Parkhurst and Appelo, 2013) such that the solutions were supersaturated with respect to calcite, with logΩ in the range 0.7 to 1.7. For the growth experiments, we started the experiments by injecting deionized water to dissolve the calcite surface. Then we injected the growth solution without Cr(VI)oxyanions before
we injected the growth solutions with increasing Cr(VI)concentrations: 1, 10, 50 and 150 ppm Cr(VI). The pH was constant in each initial
solution and was varied in the range 8–11 between experiments. The pH of the solutions was also measured independently using a pH meter.
2.1.2. Experimental procedure
The calcite surfaces were imaged with nanometer height resolution and micrometer spatial resolution at room temperature (21 ± 2 °C) by using a Bruker Multimode Atomic Force Microscope (AFM) with a scan rate of 4 Hz and Si3N4tips (Bruker, tip model NP-S20) with spring
constants 0.12 N/m and 0.58 N/m. Thefluid cell was sealed with an O-ring, giving afluid cell with a volume of 50 μL. The volume of the fluid in the cell was reduced to approximately 35μL after subtracting the volume occupied by the calcite crystal. For all the experiments, the same procedure was followed to ensure that the results would be comparable. Thefirst image of the surface was taken in air before any fluid had been introduced. All the AFM images were sequentially ac-quired by scanning in the downward direction. Subsequently the aqu-eous solutions were manually injected after each scan, giving regular time intervals of ~70 s (scan time) and a constant volume of 2 mL using a syringe, giving an effective flow rate of ~30 μL/s. The calcite crystal wasfirst exposed to deionized water that was injected for 20–30 min to initiate dissolution and to observe the reactivity of the surface. Then,
the solutions with Cr(VI) were injected with increasing Cr(VI) con-centration.
2.1.2.1. Imaging procedure. For the dissolution experiments, we started with the lowest concentration of Cr(VI)and acquired at least ten scans
with 2 mL offluid injection between each scan. Then, the AFM tip was lifted up for 10 min, to leave enough time for nanoparticle precipitates to grow in experiments where they formed and to avoid the influence of the scanning tip, followed by two scans without any fluid injection before continuing the same procedure with the next solution with higher Cr(VI)concentration. After injecting the last solution, and waiting for 10 min, a few extra scans were acquired from different areas on the calcite surface to confirm that the observations in one area of the calcite surface were representative of the entire surface.
For the growth experiments, we acquired eight scans with 2 mL of fluid injection between each scan. In contrast to the dissolution ex-periment, we did not lift the tip up for 10 min between each solution, but injected the nextfluid directly after the previous one. As for the dissolution experiments, we scanned in several areas on the surface after the last injection.
The samples were studied in the AFM for 2–3 h before they were removed from thefluid cell. Eight of the dissolution samples (Table 1) andfive of the growth samples (Table 2) were left in contact with their last solution between 12 and 118 h before we imaged them again in the AFM to search for precipitate development.
2.1.2.2. Scanning electron microscopy. After the twelve samples were removed from their corresponding solutions and imaged in the AFM, they were coated with a thin layer of gold under the conditions of 20 mA for 80 s before the surface was imaged with a Hitachi SU5000 field-emission Scanning Electron Microscope (SEM). The chemical content of major elements was acquired using semi-quantitative energy-dispersive spectrometry (EDS) in the SEM.
2.1.2.3. Raman spectroscopy. Raman spectroscopic analysis was performed after the AFM experiments to provide additional identification information of the precipitated phase. A WITec Alpha 300R Raman spectrometer equipped with an optical microscope was used for this analysis, operated with a 785 nm line of a HeeNe laser, with a grating of 300 grooves/mm. A 50× long working distance optical lens (numerical aperture: 0.55) was used, providing a lateral resolution of approximately 2μm at the sample surface and a depth resolution of approximately 3μm. An integration time of five seconds Table 1
List of the atomic force microscopy dissolution experiments in the presence of Cr(VI)and formation of precipitates. All the experiments were performed at
room temperature and with a constant ionic strength of 0.05 M. Two sets of experiments were performed under the same conditions for each concentration to check reproducibility. The duration that the calcite was left in solution after the experiment is indicated.
Experiment [Cr(VI)] pH Precipitates Hours in
solution after SEM Raman band centers (cm−1) CaCrD01 1 10 50 100 6.7 7.7 7.7 8.0 None None A few A few 24 Yes CaCrD02 1 10 50 100 11.9 12.0 12.0 12.0 A lot A lot A few A lot 24 Yes CaCrD03 1 10 10.8 10.5 A few Passivation of the surface 24 Yes 362 605 818 CaCrD04 50 100 10.5 10.4 A few A few 0 No CaCrD06 1 10 50 100 8.2 8.5 8.8 8.9 None None A few None 24 Yes CaCrD07 (Same as CaCrD06) 1 10 50 100 8.2 8.5 8.8 8.9 None None A few None 24 Yes CaCrD08 1 10 50 100 6.2 6.3 6.5 6.3 None A few None A few 24 Yes CaCrD09 (Same as CaCrD03) 1 10 10.8 10.5 A few Passivation of the surface 0 No CaCrD10 1 10 50 9.4 8.1 9.5 A few A lot A lot 52 Yes CaCrD12 1 10 50 10.4 10.6 10.5 A few A lot A lot 88 Yes Table 2
List of the atomic force microscopy calcite growth experiments in the presence of Cr(VI). All the experiments were performed at room temperature. Two sets of
experiments were performed under the same conditions to check reproduci-bility. [Cr(VI)] = 0: Growth solution without Cr(VI). The time that the calcite was
left in solution after the AFM experiment is indicated. Saturation index of the solution with respect to calcite if given (logΩ, where Ω = [Ca2+][CO
32−] /
Calcite Ksp).
Experiment [Cr(VI)] pH logΩ Hours in solution after SEM
CaCrG01 0 1 10 50 150 9 9 9 9 9 0.74 0 No CaCrG02 0 1 10 50 150 11.2 11.2 11.2 11.2 11.2 1.65 112 Yes CaCrG03 0 1 10 50 150 11.2 11.2 11.2 11.2 11.2 1.65 109 Yes CaCrG04 0 1 10 50 150 10.2 10.2 10.1 10.0 9.9 1.60 118 Yes CaCrG05 (Same as CaCrG04) 0 1 10 50 150 10.2 10.2 10.1 10.0 9.9 1.60 0 No CaCrG06 (Same as CaCrG04) 0 1 10 50 150 10.2 10.2 10.1 10.0 9.9 1.60 113 Yes CaCrG07 0 1 10 50 150 9.0 9.2 9.0 8.8 7.9 1.68 19 Yes CaCrG08 (Same as CaCrG07) 0 1 10 50 150 9.0 9.2 9.0 8.8 7.9 1.68 0 No CaCrG09 (Same as CaCrG07) 0 1 10 50 150 9.0 9.2 9.0 8.8 7.9 1.68 0 No
and ten accumulations was required to obtain a spectrum with a high enough signal to noise ratio to detect bands related to the precipitates on the calcite surface. During the analysis, no change in the material was observed either in the optical microscope image or spectrum. Background removal and peakfitting were performed using the WITec Project Plus software (version 4).
2.1.2.4. Water resistance. For two of the samples that had been exposed to solutions for a longer period, we tried to dissolve the newly-formed layer on top of the calcite surface to test the chemical resistance of the layer. To do so, 2 mL of deionized water was injected between every scan during the first 5–10 scans, then 5 scans were acquired without any injection, one injection and 5 scans again. The sample was in the fluid cell for ~80 min.
2.1.2.5. Image processing. All AFM images were processed using the NanoScope Analysis Software (Version 1.5). Etch pit spreading rates and growth rates were calculated from sequential images where the length increase of two opposite parallel steps were measured (Ruiz-Agudo and Putnis, 2012;Renard et al., 2019).
2.2. Stirredflow-through experiments
To study if Cr(VI)could be incorporated into calcite, we performed a series of experiments with a stirred flow-through reactor (Fig. S1b) using synthetic calcite, following the experimental procedure as de-scribed by e.g.Hajji et al. (2019)andRenard et al. (2017). These ex-periments complement the dissolution exex-periments in the AFM as we use a solution that is undersaturated with respect to calcite. The calcite was synthesized by aqueous carbonation of portlandite with com-pressed CO2(55 bar) at room temperature, following the reaction Ca
(OH)2+ CO2= CaCO3+ H2O. The mineral composition and/or purity
was determined by X-ray diffraction analysis. Further details on the experimental procedure for synthetic nano-calcite and determination of textural properties are found in Montes-Hernandez et al. (2007)and Montes-Hernandez et al. (2008), respectively. Theflow-through setup consisted of a beaker with the initial solution, a pump, and two stirred fluid-cell reactors with an internal volume of 50 mL. We performed five flow-through experiments with solutions containing concentrations of either 10 or 100 ppm Cr(VI)and pH between 10 and 12. This pH range was selected because here most precipitates were observed in the AFM experiments. K2CrO4salt was used as Cr(VI)source. The experimental
conditions are given inTable 3. For all the experiments, the pump had a constantflow rate of 2.1 mL/min. The reactors were placed on a plate that maintained a temperature of 20 °C and the magnetic stirrers had a constant rate of 750 rpm. In one of the reactors, we placed 1 g synthetic chemically pure calcite, while the other reactor did not contain any mineral. Thefluid injected in the reactor without calcite was used as a passive tracer, to quantify if Cr is adsorbed on the walls of the reactor during percolation (Hajji et al., 2019). We ran 1.3 L of solution through
the reactors and took samples of the output solution after 5, 15 and 30 min, followed by every 30 min until it had been running for 5 h. Each output sample contained 13 mL of solution and it took around 6 min to retrieve each sample. These samples were acidified by the addition of three drops of 2 N HNO3. All solutions with 100 ppm Cr(VI)
were diluted ten times before they were analyzed by Inductively Cou-pled Plasma Atomic Emission Spectroscopy (ICP-AES). After the ex-periments, the remaining particles were retrieved from the reactors. The excess water was poured out and the samples were allowed to dry at 60 °C for 12 h. The amount of Cr(VI)in the powder retrieved from the
reactor was quantified by Inductively Coupled Plasma Mass Spectro-metry (ICP-MS) analysis. To dissolve the powder for analysis, 50 mg of the material was measured and dissolved in 3 mL of 14 N HNO3for 2 h
at 120 °C. The liquid was then evaporated at the same temperature and the residue was again re-dissolved in 3 mL 7 N HNO3and re-evaporated
at 120 °C. Thefinal residue was re-dissolved in 7 N HNO3before diluted
in 2% HNO3. These liquid samples were then analyzed by ICP-MS. The
amount of Cr(V)in each sample was normalized by the surface area of calcite (9 m2/mg).
3. Results
3.1. Dissolution of the calcite surface in the presence of Cr(VI)and
precipitation of nanoparticles
During thefirst 10–20 AFM scans (i.e. 15 to 30 min), the calcite surface was slowly dissolved when exposed to deionized water. The dissolution of the surface was characterized by the formation and growth of rhombohedral etch pits that progressively increased in size as the surface continuously dissolved. Within two scans (~3 min) after injection of thefirst solution containing Cr(VI), the shape of the etch pits
changed to show a rounding of the obtuse corners. The surface then continued dissolving via etch pit propagation with the altered shape.
The dissolution rate at the calcite surface was calculated by mea-suring the length increase of two opposite etch pit sides between two sequential images (Ruiz-Agudo and Putnis, 2012). The dissolution rate of the etch pits, V, was calculated using:
= + − + ∗ ∆ + V l l l l t ( ) ( ) 2 x y i 1 x y i (1) where lxand lyare the lengths of the etch pit sides, i is image number
andΔt is the time difference between two sequential images.
The dissolution rate is dependent on Cr(VI)concentration and pH as
shown inFig. 1. The rate is almost constant for all the experiments with deionized water, and ranges between 0.8 ± 0.3 and 1.8 ± 0.9 nm/s, in agreement with previous studies (Ruiz-Agudo et al., 2010). A con-stant or slight decrease in the dissolution rate from 2.3 ± 0.6 nm/s to 1.6 ± 0.9 nm/s is observed when the Cr(VI)concentration is increased
from 1 to 10 ppm. This slight decrease could be an effect of change in Cr(VI)concentration, but the dissolution rate variations are within the error bars and are therefore within experimental uncertainty. However, above 10 ppm Cr(VI), the dissolution rate increases with increasing Cr(VI)
concentration from 1.6 ± 0.9 nm/s to 3.2 ± 0.7 nm/s. There is also a small correlation between etch pit dissolution rate and pH. At higher pH values, the etch pit dissolution rate is slower than at lower pH values. The measured values for Cr-rich solutions, independent of pH, varies between 1.2 and 4.3 nm/s.
In the presence of a Cr-rich solution, the formation of precipitates is observed in situ, during the dissolution of the calcite surface and within minutes of initial scanning. At high pH, rounded precipitates are ob-served after injecting 1 ppm Cr(VI)into thefluid-cell, while at lower pH
values, a higher concentration of Cr(VI)is required to observe these
precipitates (Fig. 2a). The number of precipitates is highest at high concentrations of Cr(VI)and/or high pH values (Fig. 2a).
During the experiments, most of the scans were acquired over a surface area of 5 × 5μm2. Scans over a surface area of 7 × 7μm2were Table 3
List of stirredflow-through experiments. All experiments were performed at 20 °C, with a constant stirring rotation of 750 rpm and constantflow rate of 2.1 mL/min. The initial Cr concentration is given. The Cr concentration of the calcite powder was measured after dissolution in nitric acid using ICP-MS. Results are given in ppm and divided by the surface area of calcite with 10% standard deviation.
Exp. no. [Cr(VI)] ppm pH ICP-MS
Cr(VI)ppm ICP-MS Cr(VI)mg/m2 1 10 10 5.6 6.2·10−4 2 100 10 11 1.2·10−3 3 100 12 7.1 7.9·10−4 4 10 12 7.0 7.8·10−4 5 100 12 13 1.4·10−3
acquired to see if the tip had removed precipitates out of our initial 5 × 5μm2view area. Occasionally, we observed that the precipitates had been removed out of the 5 × 5μm2scan-window, probably by the
scanning tip, which indicates that the precipitates were initially weakly attached to the surface.
In the scans where the precipitates were not removed by the tip, the nanoparticle precipitates are evenly distributed over the surface, except in experiment CaCrD03, where a preferred location for growth of cipitates near the edges of large etch pits is observed, similar to pre-vious observations byRenard et al. (2018) on the calcite‑antimony system. A preferred location during incorporation of Cr into the calcite structure has been reported by the experiments fromTang et al. (2007), where Cr was found mainly along the obtuse angles.
The nanoparticle diameters and heights were measured in images obtained during dissolution experiments and collected at different times and with different experimental conditions (Fig. 2b). Particle diameters have an average size of 111 ± 29 nm and height of 3 ± 2 nm, giving a very low height to diameter aspect ratio. Such low height to diameter aspect ratio was observed in other studies (e.g.Renard et al., 2017) and indicates the formation of a thin nanolayer with wider surface area, formed by the merging or coalescence of adjacent nanoparticles. This process was observed in situ in the AFM. For the samples exposed to their corresponding solution for 24 h after the AFM imaging, larger precipitates are observed with an average diameter of 1.6 μm and
0
1
10
50
100
Cr
(VI)concentration (ppm)
0
2
4
6
Etch pit dissolution rate (nm/s)
6
12
pH
Fig. 1. Etch pit dissolution rate as a function of Cr(VI)concentration. Color code indicates the pH of the experiment. [Cr(VI)] = 0: Deionized water. (For
inter-pretation of the references to color in thisfigure legend, the reader is referred to the web version of this article.)
Initial formation of precipitates
Growth after 24 h in solution
A
B
C
6
8
10
12
14
16
pH
0
1
10
50
100
Cr
(VI)concentration (ppm)
lot of precipitates
no precipitates
few precipitates
0
50
100
150
200
250
Particle diameter (nm)
0
4
8
12
16
Particle height (nm)
CaCrD02
CaCrD04
CaCrD07
CaCrD08
Fig. 2. A) Amount of precipitates on a calcite surface in the presence of Cr(VI)-rich solutions with different Cr(VI)concentrations and pH. B) Analysis of the shape of the
precipitated particles on the calcite surface given by particle height vs particle diameter (nm). C) Formation and growth of precipitates on calcite in Cr-rich solution (AFM deflection image of sample CaCrD01). Left: Nanoparticles formed during the experiment under the AFM. Right: Nanoparticles imaged after the sample was left 24 h in solution.
heights up to 320 nm (Fig. 2c). These appear to be formed via merging of smaller particles. When studying the surface in the AFM we observe that 30% of the experiments contained a lot of precipitates (e.g. sample CaCrD02) while 20% of the experiments did not contain any pre-cipitates (e.g. sample CaCrD06).
The Raman bands associated with the precipitates indicate that they have a different composition than the background material (calcite). The precipitates consistently produce three bands at 362, 605 and 818 cm−1(Table 1) where the most intense band is found at 818 cm−1 (Fig. 3d), a characteristic band associated with chromate-bearing mi-nerals (Kiefer and Bernstein, 1972;Sánchez-Pastor et al., 2010). The indication of a chromate-bearing mineral is consistent with the detec-tion of Cr in the particles using EDS (Fig. 3a-c).
3.2. Calcite growth in the presence of Cr(VI)
For the experiments with growth solutions, the calcite surface was initially exposed to deionized water before the growth solution was injected. Etch pits formed in the presence of deionized water. However, as soon as the growth solution was injected the surface changed with islands and pyramidal hillocks (growth spirals) forming across the whole surface as well as closure of the initial etch pits. These features characterize classical calcite growth (Ruiz-Agudo and Putnis, 2012). To measure the growth rate and how it changed with pH and Cr(VI)
-con-centration, the width of islands and/or pyramid hillocks was measured between two sequential images and calculated using Eq.(1). Fig. 4a displays how the growth rate changes with pH and Cr(VI)-concentration.
Results show that the growth rate depends more on pH than on Cr(VI)
-1 µm
1 µm
1 µm
SE
SE Cr
Cr
A
B
C
605
362
818
D
Calcite
CaCrD03
Intensity (arbitrary units)
0
0
2
1
0
0
4
0
0
2
600
800
1000
Raman Shift (cm
-1)
Fig. 3. Identification of the precipitates. A–C) SEM and EDS mapping of chromium (Cr). D) Raman spectra of a reference calcite and of nanoparticles from sample CaCrD03, with positions of the main Raman peaks indicated.
concentration.
For the Cr-free growth solution, the growth rate decreased with increasing pH from 14.1 ± 5.1 nm/s at pH 9 to 2.9 ± 1.4 nm/s at pH 11.2. For the Cr(VI)-rich growth solutions at pH 11.2, the growth rate was between 2.8 ± 0.6 to 3.2 ± 0.6 nm/s. At lower pH values (9–10.2), the growth rate varied more and the highest growth rate was 18.5 ± 1.2 nm/s at pH 10.2 and lowest growth rate at 5.3 ± 0.6 nm/s at pH 9.9. The experiments with solutions with pH 11.2 had a super-saturation of logΩ = 0.7 with respect to calcite while the experiments with pH 9–10.5 had a higher supersaturation with log Ω = 1.7. This difference in supersaturation would most likely impact the growth rate, but it is uncertain whether it is the pH, the supersaturation or a com-bination of both that causes the growth rate for the experiments at pH 11.2 to be significantly slower, however it has been shown that calcite growth decreases with increasing pH above ~9 (Ruiz-agudo et al., 2011) and both supersaturation and increasing OH− concentra-tion probably play a role.
During spiral growth, we observed that the obtuse corners of the pyramids were prevented from normal growth (Fig. 4c) and that corner became rougher and more curved. This corner also seemed to be pinned and grew at a slower rate. This feature appeared after the growth
solution with Cr(VI)was introduced, indicating that the Cr(VI)had an effect on the growth mechanism. The samples were later studied in the SEM, and a similar feature was observed where two sides of a growth island showed rougher step edges (Fig. 4d).
3.3. Passivation of the calcite surface and resistance of the newly formed layer
Precipitates were observed to eventually completely cover the cal-cite surface in the coupled dissolution-precipitation experiments at pH 10.5 and 10 ppm Cr(VI) (CaCrD03). Fig. 4a and Supplementary Movie S1 show how these precipitates grew in diameter and, within 30 min, covered the whole surface. Even though it had been exposed continuously to a Cr(VI)-rich solution, the surface topography was
al-most identical between the initial and precipitate covered surface (Fig. 5a, images taken with 18.5 min time interval). After the formation of the new surface layer, deionized water was injected into thefluid cell for around 40 min, without any observable change to the surface fea-tures indicating that a stable phase had formed and no continued dis-solution of the underlying calcite occurred.
The same passivation process was observed in the growth
0
1
10
50
150
Cr
(VI)concentration (ppm)
0
4
8
12
16
20
Growth rate (nm/s)
9
11.5
pH
CaCrG03.033
1.0 µmPrevented growth
4.0 µm
Prevented
growth
CaCrG06.017
C
B
A
D
Fig. 4. A) Growth rate as a function of Cr(VI)concentration. Color code indicates the pH of the experiment. [Cr(VI)] = 0: Growth solution. B) AFM deflection image
(CaCrG06) showing spiral growth without any influence of Cr. The green dotted lines show the four straight sides of the pyramidal hillock. C) AFM deflection image (CaCrG03) showing inhibited step propagation on two sides of a spiral growth hillock when exposed to a Cr-rich solution. D) SEM image (CaCrG07) showing a growth island with two rough sides interpreted as related to prevented growth. (For interpretation of the references to color in thisfigure legend, the reader is referred to the web version of this article.)
t = 0
t = 19.8 min
A
B
t = 2.3 min
t = 4.6 min
t = 7.5 min
t = 10.5 min
t = 12.8 min
t = 15.1 min
t = 0
t = 38.5 min
t = 3.5 min
t = 8.2 min
t = 17.5 min
t = 22.2 min
t = 26.8 min
t = 33.8 min
A
B
CaCrD03.039
CaCrD03.041
CaCrD03.043
CaCrD03.046
CaCrD03.048
CaCrD03.050
CaCrD03.052
CaCrD03.056
CaCrG09.015
CaCrG09.018
CaCrG09.022
CaCrG09.030
CaCrG09.034
CaCrG09.038
CaCrG09.42
CaCrG09.046
Fig. 5. Time-lapse AFM images of the passivation of the surface in a dissolution experiment (A) and a growth experiment (B). A) Formation of precipitates (CaCrD03) in a dissolution experiment. The particle shape evolves from round to elongated and eventually the precipitates cover the whole surface. Limited reactivity of the surface after layer formation is observed by comparing image with a 19.8 min time interval, that show the same features. All the scans of this experiment are displayed in the Supplementary material (Movie S1). B) Growth of a new layer, which slowly covers the whole surface in a growth experiment (CaCrG09). The red circle indicates a surface structure (image at time 0 and 38.5 min) that is still visible after 38.5 min of injection of Cr(VI)-richfluids. (For interpretation of the
experiments at pH 7.9–9.2 and 0–150 ppm Cr(VI)
(CaCrG09) under the AFM. A layer was observed growing over the calcite surface (Fig. 5b) after injecting a solution with 1 ppm Cr(VI)at pH 9.2. Unlike the
pas-sivation in the dissolution experiments, in the growth experiments, is-lands still grew underneath the newly formed layer (Fig. S2) indicating that in some areas, an open space between the new layer and the calcite surface or possibly porosity within the precipitated layer allowed con-tinuous access of thefluid and hence continued reaction.
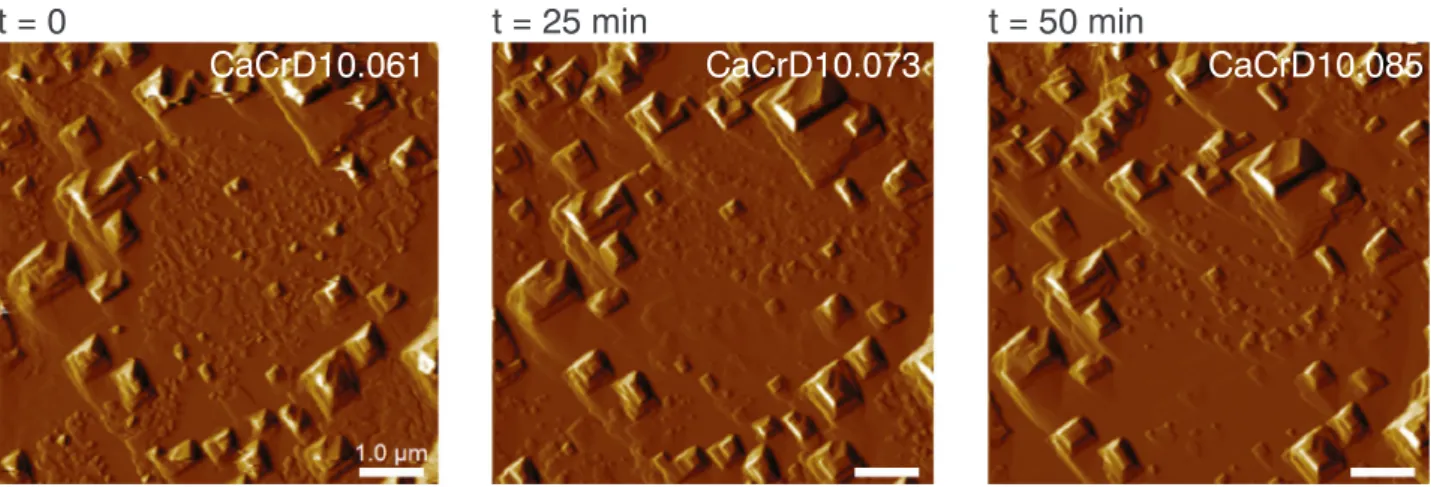
The samples CaCrD10 and CaCrG04, that had been left in solution for 52 and 118 h, respectively, were exposed to deionized water for approximately 80 min to measure how the newly formed layer on top of the calcite surface would dissolve (Fig. 6). This layer was quite resistant to water. The formation of etch pits underneath the layer was observed, indicating that the calcite was dissolving faster than the newly-formed layer on top. Since the calcite could dissolve underneath the layer, it indicates that the layer was not completely covering the surface and that it possibly had some cavities or pores where the water accumulated and dissolved the calcite. After approx. 50 min of etch pit dissolution, the layer detached from the surface indicating that the layer was no longer attached to the underlying dissolving calcite at this point.
3.4. Flow-through experiments and adsorption of Cr(VI)
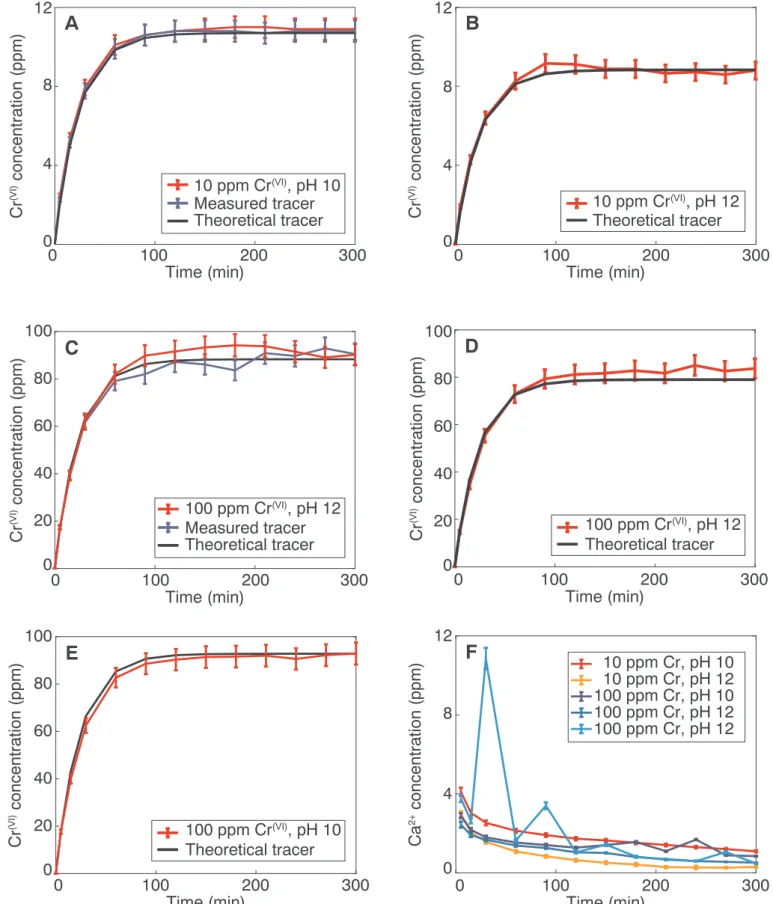
The ICP-AES analyses of the output solutions from the stirred flow-through reactor experiments are givenFig. 7. For all of the experiments, we calculated a theoretical behavior of an inert tracer. The so-called breakthrough curve of such a tracer follows Eq.(2)(Limousin et al., 2007;Hajji et al., 2019), ⎜ = ⎡ ⎣ ⎢ − ⎛ ⎝ − − ⎤ ⎦ ⎥ C t C Q V t t ( ) 0 1 exp ·( ) 0 0 (2) where the concentration C varies between 0 and C0, and t0is the time
when the tracer (Cr(VI)solution) is injected, Q is theflow rate (mL/min) and V0is the internal volume of the reactor.
In addition to the theoretical tracer, we measured the passive tracer concentration in two experiments, one with 10 and 100 ppm Cr(VI), such that we could validate the model of Eq.2.Fig. 7a and c display the data of both a measured tracer and a theoretical tracer and show that there is good agreement between the two tracers, validating the Eq.2 for our experiments.Figs. 7a-e indicate that there is no adsorption of Cr(VI)on the synthetic calcite.Fig. 7f shows how the released Ca2+
concentration changes with time for all the experiments, indicating the amount of calcite dissolved. From these data, the Ca2+concentration was reduced from 3 to 4 ppm in the beginning of the experiment and to 0–1 ppm by the end of the experiments. The ICP-MS results acquired from the dissolution of the calcite product after reaction with chromium
(Table 3) indicate that very small amounts of Cr(VI) (5.5·10−4 to 1.4·10−3mg/m2) were adsorbed onto calcite during the stirred flow-through dissolution experiments. The amount of Cr(V)adsorbed onto
calcite in experiment 3 and 5 varies by a factor of 2, even though the experiments had the same initial conditions (100 ppm Cr(V), pH 12). However, due to experimental problems, a portion of the calcite in the reactor in experiment 3 was trapped in areas without contact to the Cr(VI)-rich solution. The results of experiment 3 are therefore less reli-able than the results of experiment 5.
4. Discussion
4.1. Sequestration of Cr(VI)on calcite
The formation of precipitates during the AFM dissolution experi-ments indicates that a new mineral grew as the calcite surface was dissolving. We interpret this observation as the result of a coupled dissolution-precipitation process. In this mechanism the boundary layer offluid at the calcite surface becomes increasingly saturated with ions as calcite dissolves. This leads to local supersaturation with respect to a new phase followed by precipitation of this phase at the calcite surface. Such a process occurs when dissolution is faster than diffusion of ions away from the reacting surface resulting in a boundary fluid layer whose composition varies greatly from the bulk composition (Putnis, 2009;Putnis and Putnis, 2007;Ruiz-Agudo et al., 2014).
Our EDS maps show that the newly formed precipitates contain Cr (Fig. 3a-c). This is corroborated by Raman spectroscopy data (Fig. 3d andTable 1). Raman bands in the region between 485 and 848 cm−1 are associated to Cr(VI)-O bridging bonds in Cr-oxides (Maslar et al.,
2001) and the symmetrical stretching motion in both chromate solution and minerals (Kiefer and Bernstein, 1972). Similarly, chromate in-corporated into calcite produces multiple bands in the 800–900 cm−1
spectral region (Sánchez-Pastor et al., 2010). However, no additional bands were reported close to 400 and 600 cm−1upon incorporation of chromate into calcite. Although the chromate source, Na2CrO4, has the
characteristic bands for chromate around 800 cm−1 (Carter and Bricker, 1974), the band at 600 cm−1in our Raman spectra does notfit this phase. Crystalline phases described in previous studies (Frost, 2004;Sánchez-Pastor et al., 2010) showed multiple, sharp bands in the chromate region. In contrast, the precipitates found here show a single, broad band in this region indicating that our chromate-rich phase had a low crystallinity and/or very small particle size (Nasdala et al., 1995). For the growth experiments, EDS mapping shows that the layer on top of calcite contains C, Ca and O. Even though we cannot detect any Cr(VI)in the structure with this technique, Cr(VI)clearly had an effect on
the calcite growth in the experiments (Fig. 4). Slowing growth in two
CaCrD10.061
CaCrD10.073
CaCrD10.085
n
i
m
0
5
=
t
0
=
t
t = 25 min
Fig. 6. Testing the solubility of the newly formed material. The images demonstrate minimal changes in surface topography on sample CaCrD10 despite being exposed to repeated injections of deionized water over 50 min.
0
100
200
300
Time (min)
0
4
8
12
Ca
2+concentration (ppm)
F
10 ppm Cr, pH 10
10 ppm Cr, pH 12
100 ppm Cr, pH 10
100 ppm Cr, pH 12
100 ppm Cr, pH 12
0
100
200
300
Time (min)
0
4
8
12
Cr
(VI)concentration (ppm)
Theoretical tracer
10 ppm Cr
(VI), pH 12
B
0
100
200
300
Time (min)
0
20
40
60
80
100
Measured tracer
Theoretical tracer
100 ppm Cr
(VI), pH 12
Cr
(VI)concentration (ppm)
C
0
100
200
300
Time (min)
Cr
(VI)concentration (ppm)
Theoretical tracer
100 ppm Cr
(VI), pH 12
D
0
20
40
60
80
100
0
100
200
300
Time (min)
0
20
40
60
80
100
Cr
(VI)concentration (ppm)
Theoretical tracer
100 ppm Cr
(VI), pH 10
E
0
100
200
300
Time (min)
0
4
8
12
Cr
(VI)concentration (ppm)
10 ppm Cr
(VI), pH 10
Measured tracer
Theoretical tracer
A
Fig. 7. Concentrations of Cr(VI)and Ca2+in thefluids collected at the outlet of the flow-through reactors for injected solutions with A) 10 ppm Cr, pH 10. B) 10 ppm
Cr, pH 12. C) 100 ppm Cr, pH 10. D) 100 ppm Cr, pH 12. E) 100 ppm Cr, pH 12. F) Change in Ca2+concentration with time for all the experiments. The blue curves
show the concentrations of the outlet solution for the reactor that did not contain calcite. The black curve is the theoretical tracer, calculated from Eq.(2). (For interpretation of the references to color in thisfigure legend, the reader is referred to the web version of this article.)
directions on the islands agrees with the results ofTang et al. (2007), who found that most of the CrO42−was incorporated into the– steps on
the (1014) plane of the calcite surface. Our AFM and SEM data indicate that Cr(VI)is incorporated and retards calcite growth along the same
steps. For all the samples that were left for longer times in solution, a layer was formed on the calcite surface. EDS and Raman for the dis-solution experiments and EDS for the grow experiments indicate that it is a chromate-bearing layer, but we are not able to identify the exact phase, possibly because of low crystallinity.
4.2. Passivation and solubility of Cr-layer
For two of the experiments (CaCrD03 and CaCrG09), passivation of the surface was observed. García-Sánchez and Álvarez-Ayuso (2002) studied sorption of Cr(III)on calcite and observed a coating of Cr(III) precipitates which they identified as an chromium oxide hydro-carbonate with the general stoichiometry Cr2O3(H2O)x(CO2)y. They
observed that this precipitation continued until the coating was thick enough to prevent further reaction with the calcite surface, i.e. it pas-sivated the calcite surface. Our data demonstrate that Cr(VI)shows the
same behavior and can quickly form a passivating layer on the surface of the calcite crystals. Exposure of the layer, formed in the calcite growth experiment, to deionized water indicates that the new phase has a low reactivity with respect to Cr(VI)release.
From the stirredflow-through experiments, we did not observe a significant adsorption of Cr(VI), and the ICP-MS analyses of the calcite
powder left in contact with a chromium solution also indicate that little Cr(VI)was incorporated or adsorbed. Several scenarios could explain
these results. As shown inFig. 7f, the amount of released Ca2+is
de-creasing with time in theflow-through experiments. This observation could be due to the fact that the calcite surface became passivated quickly by the presence of a new layer, as observed directly in AFM dissolution experiments. This effect would stop calcite dissolution and prevent the build-up of a newly precipitated layer. As the coupled dissolution-precipitation reaction is dependent on the relative rates of the calcite dissolution and Ca diffusion, another explanation is that the solution reached equilibrium with respect to calcite, which deactivated the chemical feedback that controls the formation of a precipitate. The latter hypothesis is confirmed by thermodynamic calculations using PHREEQC and thefluid composition measured by ICP-AES in the out-lets of theflow-through reactor. The calculations are based on the in-formation from the ICP-AES analyses, where we know that the con-centrations of dissolved Ca2+-ions are ~2 and 4 mg/L (Fig. 7f) in
solutions at pH 10 and 12. These calculations indicate that the outlet fluid composition is close to equilibrium with calcite. This result shows that afluid far-from equilibrium with respect to calcite should be in-jected continuously into the reactor and at a fast enough rate to maintain the dissolution-precipitation process. To obtain similar uptake to that observed byTang et al. (2007), theflow-through experiments would need to be run for longer durations at fasterflow-rates and/or be performed with much higher Cr-concentrations.
4.3. Implications and environmental relevance
Several studies have shown that Cr in groundwater can occur due to natural pollution, such as from alluvial-filled basins (Robertson, 1975), ophiolitic rocks (Fantoni et al., 2002) and ultramafic rock weathering (Moraetis et al., 2012). Interference of background natural pollution levels of Cr transported to other areas (Moraetis et al., 2012) make it difficult to estimate industrial impact (Shtiza et al., 2005) on Cr con-centrations. Nevertheless, it is clear that Cr can be highly mobile in groundwater systems (Moraetis et al., 2012) and those contaminated by wastewaters. Interestingly, there is already evidence of calcite changing the local concentrations of Cr as drill cuttings fromRobertson (1975) revealed that pore water in soils consisting of quartz, montmorillonite and calcite, but no Cr source rock, contained up to 60 ppm Cr. The
amount of Cr(VI)increased with increasing pH in the range found in the soils, pH 7–9, due to oxidation of Cr(III)
(Robertson, 1979). Analyses of the soil material indicated Cr(VI)concentrations between 5 ppm and
120 ppm even though there were no chromate minerals or ions present in the materials. Compared with our experiments within this pH range (7–9), we expect that new Cr-rich minerals could be formed in the presence of calcite, which could explain the presence of Cr(VI)in the soil
material. A similar process is expected to occur in the presence of Cr(III) as demonstrated byGarcía-Sánchez and Álvarez-Ayuso (2002).
Cr-containing minerals such as putnisite, SrCa4Cr83+(CO3)8SO4(OH)16·25H2O, have recently been found
asso-ciated with the weathering of carbonate and ultramafic rocks (Elliott et al., 2014), supporting the critical role of chemical feedbacks between minerals andfluids to predict Cr mobility. We suggest that the presence of calcite can reduce the amounts of mobile Cr in groundwater via adsorption or incorporation into the calcite structure or the formation of a stable phase by a coupled dissolution-precipitation mechanism depending on whether calcite is forming coevally or is already present in the system.
5. Conclusion
Chromium can be found as a contaminant in several natural sys-tems, particularly those associated with ophiolitic and ultramafic rocks (Robertson, 1975;Fantoni et al., 2002;Shtiza et al., 2005;Moraetis et al., 2012). Due to its resistance to corrosion, Cr is widely used in industry, increasing pollution levels in soils and groundwaters in in-dustrial areas (Moraetis et al., 2012). The mobility of Cr in these en-vironments will be controlled by chemical feedbacks between the mi-nerals present and dissolved Cr oxyanions. By using in-situ AFM and flow-through experiments we have determined the interaction between Cr(VI)in solution, chromate precipitation, and growing or dissolving
calcite surfaces. The results of our experiments reveal that Cr(VI)can become trapped as an oxyanion within nanoparticles at calcite surfaces that are formed due to a coupled dissolution-precipitation mechanism. These new precipitates grow into a layer that covers the calcite surface and this layer can passivate the reaction when porosity in the product phase is low enough. The precipitated phase is more stable and more resistant to dissolution than calcite, indicating that only a limited amount of Cr will be released if the system becomes undersaturated with respect to this phase. Calcite growing in the presence of Cr(VI)is
also more resistant to redissolution, indicating stabilization via Cr(VI)
adsorption or incorporation into the calcite crystal structure, as ob-served in previous studies (Hua et al., 2006;Tang et al., 2007). Stirred flow-through experiments did not show significant adsorption of Cr(VI)
onto calcite surfaces during the time-scale of our experiments, but ICP-MS analyses indicated that some Cr(VI) was trapped. Such a small
amount of Cr trapping could be related to the passivation of the calcite surface by nanoparticle precipitates. From the results presented here, the use of calcite (limestone) barriers could be a suitable remediation strategy for the removal or sequestration of toxic Cr from contaminated water if passivation can be avoided, for example if thefluid has a long enough residence time such that species can diffuse through a passi-vating layer.
Supplementary data to this article can be found online athttps:// doi.org/10.1016/j.chemgeo.2020.119770.
Declaration of competing interest
The authors declare that they have no known competingfinancial interests or personal relationships that could have appeared to in flu-ence the work reported in this paper.
Acknowledgment
We thank A. Røyne for fruitful discussions and feedback on the manuscript. V. Rapelius is thanked for helping with ICP-OES analyses at Münster University and Sarah Bureau and Sylvain Campillo for help with ICP-AES and ICP-MS analyses at the University Grenoble Alpes. C.V.P. acknowledges funding through the Marie Curie ITN CO2React. Funding from Labex OSUG@ 2020 (Investissement d'avenir-ANR10-LABX56) and the University of Oslo are also acknowledged.
The data (AFM images and ICP-AES data) is available upon request to the corresponding author.
References
Bartlett, R., James, B., 1979. Behavior of chromium in soils: III. Oxidation. J. Environ. Qual. 8, 31–35.https://doi.org/10.2134/jeq1979.00472425000800010008x. Carter, R.L., Bricker, C.E., 1974. The Raman spectra of crystalline Na2CrO4and
Na2CrO4·4H2O. Spectrochim. Acta Part A Mol. Spectrosc. 30, 1793–1800.https://doi. org/10.1016/0584-8539(74)80130-3.
Cornelis, G., Johnson, C.A., Gerven, T. Van, Vandecasteele, C., 2008. Leaching mechan-isms of oxyanionic metalloid and metal species in alkaline solid wastes: a review. Appl. Geochem.https://doi.org/10.1016/j.apgeochem.2008.02.001.
Deakin, D., West, L.J., Stewart, D.I., Yardley, B.W.D., 2001. Leaching behaviour of a chromium smelter waste heap. Waste Management Series 1 (C), 392–401.https:// doi.org/10.1016/S0713-2743(00)80051-3.
EFSA, 2014. Scientific Opinion on the Risks to Public Health Related to the Presence of Chromium in Food and Drinking Water. Parma, Italy.https://doi.org/10.2903/j.efsa. 2014.3595.
Elliott, P., Giester, G., Rowe, R., Pring, A., 2014. Putnisite, SrCa4Cr83+(CO3)8SO4(OH)16
·25H2O, a new mineral from Western Australia: description and crystal structure.
Mineral. Mag. 78, 131–144.https://doi.org/10.1180/minmag.2014.078.1.10. Fantoni, D., Brozzo, G., Canepa, M., Cipolli, F., Marini, L., Ottonello, G., Vetuschi
Zuccolini, M., 2002. Natural hexavalent chromium in groundwaters interacting with ophiolitic rocks. Environ. Geol. 42, 871–882. https://doi.org/10.1007/s00254-002-0605-0.
Frost, R.L., 2004. Raman microscopy of selected chromate minerals. J. Raman Spectrosc. 35, 153–158.https://doi.org/10.1002/jrs.1121.
García-Sánchez, A., Álvarez-Ayuso, E., 2002. Sorption of Zn, Cd and Cr on calcite. Application to purification of industrial wastewaters. Miner. Eng. 15, 539–547.
https://doi.org/10.1016/S0892-6875(02)00072-9.
Hajji, S., Montes-Hernandez, G., Sarret, G., Tordo, A., Morin, G., Ona-Nguema, G., Bureau, S., Turki, T., Mzoughi, N., 2019. Arsenite and chromate sequestration onto ferrihydrite, siderite and goethite nanostructured minerals: Isotherms from flow-through reactor experiments and XAS measurements. J. Hazard. Mater. 362, 358–367.https://doi.org/10.1016/j.jhazmat.2018.09.031.
Hua, B., Deng, B., Thornton, E.C., Yang, J., Amonette, J.E., 2007. Incorporation of chromate into calcium carbonate structure during coprecipitation. Water Air Soil Pollut. 179, 381–390.https://doi.org/10.1007/s11270-006-9242-7.
Kiefer, W., Bernstein, H.J., 1972. The resonance Raman effect of the permanganate and chromate ions. Mol. Phys. 23, 835–851.
Limousin, G., Gaudet, J.P., Charlet, L., Szenknect, S., Barthès, V., Krimissa, M., 2007. Sorption isotherms: a review on physical bases, modeling and measurement. Appl. Geochem. 22, 249–275.https://doi.org/10.1016/j.apgeochem.2006.09.010. Maslar, J.E., Hurst, W.S., Bowers, W.J., Hendricks, J.H., Aquino, M.I., Levin, I., 2001. In
situ Raman spectroscopic investigation of chromium surfaces under hydrothermal conditions. Appl. Surf. Sci. 180, 102–118.https://doi.org/10.1016/S0169-4332(01) 00338-5.
Montes-Hernandez, G., Renard, F., Geoffroy, N., Charlet, L., Pironon, J., 2007. Calcite precipitation from CO2-H2O-Ca(OH)2slurry under high pressure of CO2. J. Cryst.
Growth 308 (1), 228–236.https://doi.org/10.1016/j.jcrysgro.2007.08.005. Montes-Hernandez, G., Fernández-Martínez, A., Charlet, L., Tisserand, D., Renard, F.,
2008. Textural properties of synthetic nano-calcite produced by hydrothermal car-bonation of calcium hydroxide. J. Cryst. Growth 310 (11), 2946–2953.https://doi. org/10.1016/j.jcrysgro.2008.02.012.
Moraetis, D., Nikolaidis, N.P., Karatzas, G.P., Dokou, Z., Kalogerakis, N., Winkel, L.H.E., Palaiogianni-Bellou, A., 2012. Origin and mobility of hexavalent chromium in North-Eastern Attica, Greece. Appl. Geochem. 27, 1170–1178.https://doi.org/10.1016/j. apgeochem.2012.03.005.
Nasdala, L., Irmer, G., Wolf, D., 1995. The degree of metamictization in zircon: a Raman spectroscopic study. Eur. J. Mineral. Beihefte 7, 471–478.
Parkhurst, D.L., Appelo, C.A.J., 2013. Description of input and examples for PHREEQC version 3—a computer program for speciation, batch-reaction, one-dimensional transport, and inverse geochemical calculations: U.S. Geological Survey Techniques and Methods. In: Geol. Surv. Tech. Methods Book. 6. pp. 497.https://doi.org/10. 1016/0029-6554(94)90020-5.
Putnis, A., 2009. Mineral replacement reactions. Rev. Mineral. Geochemistry 70, 87–124.
https://doi.org/10.2138/rmg.2009.70.3.
Putnis, A., Putnis, C.V., 2007. The mechanism of reequilibration of solids in the presence of afluid phase. J. Solid State Chem. 180, 1783–1786.https://doi.org/10.1016/j. jssc.2007.03.023.
Putnis, C.V., Renard, F., King, H.E., Montes-Hernandez, G., Ruiz-Agudo, E., 2013. Sequestration of selenium on calcite surfaces revealed by nanoscale imaging. Environ. Sci. Technol. 47, 13469–13476.https://doi.org/10.1021/es403637u. Rakhunde, R., Deshpande, L., Juneja, H.D., 2012. Chemical speciation of chromium in
water: a review. Crit. Rev. Environ. Sci. Technol. 42, 776–810.https://doi.org/10. 1080/10643389.2010.534029.
Renard, F., Montes-Hernandez, G., Ruiz-Agudo, E., Putnis, C.V., 2013. Selenium in-corporation into calcite and its effect on crystal growth: an atomic force microscopy study. Chem. Geol. 340, 151–161.https://doi.org/10.1016/j.chemgeo.2012.12.017. Renard, F., Putnis, C.V., Montes-Hernandez, G., Ruiz-Agudo, E., Hovelmann, J., Sarret, G.,
2015. Interactions of arsenic with calcite surfaces revealed by in situ nanoscale imaging. Geochim. Cosmochim. Acta 159, 61–79.https://doi.org/10.1016/j.gca. 2015.03.025.
Renard, F., Putnis, C.V., Montes-Hernandez, G., King, H.E., 2017. Siderite dissolution coupled to iron oxyhydroxide precipitation in the presence of arsenic revealed by nanoscale imaging. Chem. Geol. 449, 123–134.https://doi.org/10.1016/j.chemgeo. 2016.12.001.
Renard, F., Putnis, C.V., Montes-Hernandez, G., King, H.E., Breedveld, G.D., Okkenhaug, G., 2018. Sequestration of antimony on calcite observed by time-resolved nanoscale imaging. Environ. Sci. Technol. 52, 107–113.https://doi.org/10.1021/acs.est. 7b04727.
Renard, F., Røyne, A., Putnis, C.V., 2019. Timescales of interface-coupled dissolution-precipitation reactions on carbonates. Geosci. Front. 10, 17–27.https://doi.org/10. 1016/j.gsf.2018.02.013.
Robertson, F.N., 1975. Hexavalent chromium in the ground water in Paradise Valley, Arizona. Groundwater 13, 516–527.https://doi.org/10.1111/j.1745-6584.1975. tb03621.x.
Ruiz-Agudo, E., Putnis, C.V., 2012. Direct observations of mineralfluid reactions using atomic force microscopy: the specific example of calcite. Mineral. Mag. 76, 227–253.
https://doi.org/10.1180/minmag.2012.076.1.227.
Ruiz-Agudo, E., Kowacz, M., Putnis, C.V., Putnis, A., 2010. The role of background electrolytes on the kinetics and mechanism of calcite dissolution. Geochim. Cosmochim. Acta 74, 1256–1267.https://doi.org/10.1016/j.gca.2009.11.004. Ruiz-agudo, E., Putnis, C.V., Rodriguez-Navarro, C., Putnis, A., 2011. Effect of pH on
calcite growth at constant aCa2+/aCO
32−ratio and supersaturation. Geochim.
Cosmochim. Acta 75, 284–296.https://doi.org/10.1016/j.gca.2010.09.034. Ruiz-Agudo, E., Putnis, C.V., Putnis, A., 2014. Coupled dissolution and precipitation at
mineral-fluid interfaces. Chem. Geol. 383, 132–146.https://doi.org/10.1016/j. chemgeo.2014.06.007.
Sánchez-Pastor, N., Cruz, J.A., Gigler, A.M., Park, S., Jordan, G., Schmahl, W., Fernández-Díaz, L., 2010. Microprobe and Raman Investigation of the Zoning in Synthetic Ca (CO3, CrO4) Crystals. pp. 197–198.
Shtiza, A., Swennen, R., Tashko, A., 2005. Chromium and nickel distribution in soils, active river, overbank sediments and dust around the Burrel chromium smelter (Albania). J. Geochemical Explor. 87, 92–108.https://doi.org/10.1016/j.gexplo. 2005.07.005.
Tang, Y., Elzinga, E.J., Jae Lee, Y., Reeder, R.J., 2007. Coprecipitation of chromate with calcite: batch experiments and X-ray absorption spectroscopy. Geochim. Cosmochim. Acta 71, 1480–1493.https://doi.org/10.1016/j.gca.2006.12.010.
Zhang, M., Reardon, E.J., 2003. Removal of B, Cr, Mo, and Se from wastewater by in-corporation into hydrocalumite and ettringite. Environ. Sci. Technol. 37, 2947–2952.