HAL Id: hal-02608522
https://hal.inrae.fr/hal-02608522
Submitted on 16 May 2020HAL is a multi-disciplinary open access archive for the deposit and dissemination of sci-entific research documents, whether they are pub-lished or not. The documents may come from teaching and research institutions in France or abroad, or from public or private research centers.
L’archive ouverte pluridisciplinaire HAL, est destinée au dépôt et à la diffusion de documents scientifiques de niveau recherche, publiés ou non, émanant des établissements d’enseignement et de recherche français ou étrangers, des laboratoires publics ou privés.
Modelling Suspended Solids Transport in Vertical Flow
Constructed Wetlands
G. Martinez Carvajal, Pascal Molle, N. Forquet, L. Oxarango
To cite this version:
G. Martinez Carvajal, Pascal Molle, N. Forquet, L. Oxarango. Modelling Suspended Solids Transport in Vertical Flow Constructed Wetlands. WETPOL, Aug 2017, Big Sky, United States. pp.2. �hal-02608522�
Modelling Suspended Solids Transport in Vertical Flow
Constructed Wetlands
G.D. Martinez-Carvajal
a,b, Pascal Molle
a, Laurent Oxarango
b, Nicolas Forquet
aa Irstea UR MALY, 5 rue de la Doua 69616, Villeurbanne, BP 32108, FRANCE
([email protected], [email protected], [email protected])
b Univ. Grenoble Alpes, CNRS, IRD, Grenoble INP, IGE, F-38000 Grenoble, France
INTRODUCTION
Vertical Flow Constructed Wetlands (VFCWs) have known an outstanding success with more than 4000 plants constructed in France. The “French type Wetland” specificities are to use gravel as porous media, to be fed with raw domestic wastewater and to implement alternative feeding and resting periods. The fouling caused by raw wastewater feeding increases suspended solids retention and influent residence time and therefore improves treatment performances (Molle, 2014). However, the fouling may cause clogging (Nivala et al., 2012) and some occurrences have already been documented (Forquet, in press).
Consequently, the mechanisms leading to fouling and how it may deviate to clogging must be better understood. By analogy to membrane reactors, we distinguish mating, i.e. suspended solids accumulation at the surface that creates a deposit, and sludging, i.e. suspended solids entrapment within the gravel pores (Judd, 2011).
Existing hydraulic and fouling models describe phenomena at the Darcy scale and depend on many calibration parameters. They show both scientific and practical drawbacks: key phenomena taking place at the microscopic scale are often oversimplified, and several experiments are required for calibration.
Blunt et al (2013) present an innovative approach that we aimed to apply to the study of fouling and clogging. Starting from the pore-scale level, phenomena are observed and modelled using as few parameters as possible. Then, results are transposed to the Darcy scale using an upscaling procedure. Thus, research must start at the pore level that we shall be able to describe properly.
The objectives of this work are to validate a non-destructive method: X-ray tomography, to obtain a 3D description of the filtering media (gravel, air, and deposit), to compare its results with the ‘thin section method technique” developed by Kim and Forquet (Kim, Forquet, 2016), and to compare pore configuration in clean and clogged media. Also the results of this work will be the base for the simulation of solid transport and deposition that will be developed at the pore scale in the next stage of this project.
METHODS
8 samples were collected in 4 VFCW of different ages and presenting or not clogging dysfunctions. The samples consisted of cylinders of 15cm of height and 5cm of diameter and contained the first portion of the uppermost layer of the filtering media.
Water trapped in macro pores was dried out from the sample (45 °C) to enhance the determination of the deposit (mostly made of organic matter) interface within the pores. An experimentation was carried out to choose a drying procedure that affects the less the porous network.
Then, 3D images were obtained using a X-ray micro CT (Computed Tomography) device. The resolution is about 90 µm/voxel. Just after tomography, remaining water was replaced
with an organic solvent, and samples were impregnated with a resin to obtain the images of the pore structure as described in the work of Kim and Forquet (2016).
RESULTS AND DISCUSSION
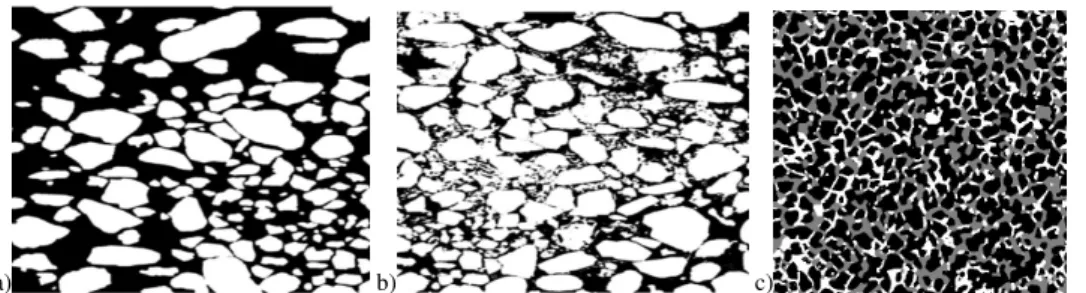
2D images describing the pores and occupation by organic matter within the media obtained by the thin section method are shown in Fig. 1a and Fig. 1b. An example of a 2D slice (4.5 mm x 4.5 mm) extracted from a 3D image obtained by X-ray tomography to analyse a sample of unsaturated sand is shown in Fig. 1c.
a) b) c)
Fig. 1. Binary images of gravel only (a) and gravel and deposit (b). Vertical cross-section of a sample taken from the surface of a VFCW. (Kim and Forquet, 2016). (c) 2D Sample of sand (black), water (white) and air (gray) segmented from a 3D X-ray tomography. 9 µm/voxel (Shiota et al, 2016).
Results from the tomography show a distinction in 3D between four different phases: gravel, deposit, plant roots and air. The porosity of the media, pore size distribution, connectivity and the volume fraction occupied by the deposit and plant biomass are compared for both methods to evaluate the relevance of using non-destructive techniques, and the deviation of results of the “thin layer method” due to sample processing. The validity of isotropy simplifications made in existing hydraulic models is discussed.
CONCLUSION
This study demonstrates the application of X-ray tomography for describing the porous network of partially fouled French VFCW filters.
Possible modifications on the porous network by the use of the “thin section method” are enlightened by comparison with the results of tomography.
REFERENCES
Blunt M.J. et al., (2013) Pore-scale imaging and modelling. Advances in Water Resources 51:197-216
Forquet, N (2017). Problèmes liés au viellissement de la filière filtres plantés de roseaux alimentés en eauusée brute. Rapport ONEMA [in French]
Judd, S. (2011) The MBR Book. Butterworth_Heinemann.
Kim, B. and Forquet, N. (2016) Pore-scale observation of deposit within the gravel matrix of a vertical flow constructed wetland. Environmental Technology 37:3146-3150.
Molle, P. (2014) French vertical flow constructed wetlands: a need of a better understanding of the role of the deposit layer. Water Science & Technology 69(1):106-112.
Shiota, A., Oxarango, L., Chang, L. Delmas, P., Mukunoki, T. (2016) Analysis of unsaturated properties of a sandy soil using X-Ray CT, presented in Journées d'Étude des Milieux
Poreux, Anglet, France.