HAL Id: hal-02904458
https://hal.archives-ouvertes.fr/hal-02904458
Submitted on 22 Jul 2020HAL is a multi-disciplinary open access archive for the deposit and dissemination of sci-entific research documents, whether they are pub-lished or not. The documents may come from teaching and research institutions in France or abroad, or from public or private research centers.
L’archive ouverte pluridisciplinaire HAL, est destinée au dépôt et à la diffusion de documents scientifiques de niveau recherche, publiés ou non, émanant des établissements d’enseignement et de recherche français ou étrangers, des laboratoires publics ou privés.
A unified framework for association and prediction from
vertex-wise grey-matter structure
Baptiste Couvy-duchesne, Lachlan Strike, Futao Zhang, Yan Holtz, Zhili
Zheng, Kathryn Kemper, Loïc Yengo, Olivier Colliot, Margaret Wright,
Naomi Wray, et al.
To cite this version:
Baptiste Couvy-duchesne, Lachlan Strike, Futao Zhang, Yan Holtz, Zhili Zheng, et al.. A unified framework for association and prediction from vertex-wise grey-matter structure. Human Brain Map-ping, Wiley, 2020, �10.1002/hbm.25109�. �hal-02904458�
A unified framework for association and prediction from vertex-wise
1grey-matter structure
2Running title: Association and prediction from grey-matter
3
Baptiste Couvy-Duchesne, PhD1, Lachlan T. Strike, PhD2, Futao Zhang, PhD1, Yan Holtz, 4
MS,1,2, Zhili Zheng, MD1,3, Kathryn E. Kemper, PhD1, Loic Yengo, PhD1, Olivier Colliot4,5,6,7,8, 5
Margaret J. Wright, PhD2,9, Naomi R. Wray, PhD1,2,*, Jian Yang, PhD1,3,*, Peter M. Visscher,
6
PhD1,2,* 7
8
1: Institute for Molecular Bioscience, the University of Queensland, 4072 St Lucia, QLD, 9
Australia 10
2: Queensland Brain Institute, the University of Queensland, 4072 St Lucia, QLD, Australia 11
3: Institute for Advanced Research, Wenzhou Medical University, Wenzhou, Zhejiang 12
325027, China 13
4 : Inria, ARAMIS Project-team, 75013, Paris, France 14
5 : Institut du Cerveau et de la Moelle épinière, 75013, Paris, France 15
6 : Inserm, U1127, 75013, Paris, France 16
7 : CNRS, UMR 7225, 75013, Paris, France 17
8 : Sorbonne Universitee, 75013, Paris, France 18
9: Centre for Advanced Imaging, the University of Queensland, 4072 St Lucia, QLD, Australia 19
*: These authors jointly supervised this work. 20
Correspondence: BCD ([email protected]), JY ([email protected]) or PMV 21
([email protected]). Institute for Molecular Bioscience, 306 Carmody Rd, St Lucia 22
QLD 4072. +61 7 3346 6348. 23
1. Acknowledgements
24
This research was supported by the Australian National Health and Medical Research 25
Council (1078037, 1078901, 1113400, 1161356 and 1107258), the Australian Research 26
Council (FT180100186 and FL180100072), the Sylvia & Charles Viertel Charitable 27
Foundation, as well as the Agence Nationale de la Recherche as part of the "Investissements 28
d'avenir" program, reference 19-P3IA-0001 (PRAIRIE 3IA Institute) and reference ANR-29
10-IAIHU-06 (Agence Nationale de la Recherche-10-IA Institut Hospitalo-Universitaire-6). 30
Informed consent was obtained from all UK Biobank participants. Procedures are 31
controlled by a dedicated Ethics and Guidance Council 32
(http://www.ukbiobank.ac.uk/ethics), with the Ethics and Governance Framework available 33
at http://www.ukbiobank.ac.uk/wp-content/uploads/2011/05/EGF20082.pdf. IRB approval 34
was also obtained from the North West Multi-centre Research Ethics Committee. This 35
research has been conducted using the UK Biobank Resource under Application Number 36
12505. 37
Informed consent was obtained from all HCP participants. HCP Data were provided 38
by the Human Connectome Project, WU-Minn Consortium (Principal Investigators: David 39
Van Essen and Kamil Ugurbil; 1U54MH091657) funded by the 16 NIH Institutes and Centres 40
that support the NIH Blueprint for Neuroscience Research; and by the McDonnell Centre for 41
Systems Neuroscience at Washington University. 42
We used R(R Development Core Team, 2012) (v3.3-3.6) for analyses not performed 43
using OSCA (Zhang et al., 2019) and for plots. We used colour-blind friendly R palettes in the 44
Viridis and scales (H. Wickham, 2015) packages, qqman (Turner, 2014) for QQ-plots, ggplot2
45
(H. Wickham, 2009) and ggsignif (Ahlmann-Eltze, 2017) for circular bar plots, corrplot (Wei 46
& Simko, 2017) for correlation matrix plots, ukbtools (Hanscombe, 2017) to facilitate UKB
phenotype manipulation, bisgstatsr (Privé, Aschard, Ziyatdinov, & Blum, 2018) for Lasso 48
regression, meta for meta-analyses(Balduzzi, Rücker, & Schwarzer, 2019). Other packages 49
used to assist analyses and data handling include Hmisc (Harrell, 2017), rowr (Varrichio, 50
2016), pwr (Champely, 2017), XML (Temple & the CRAN Team, 2017), tidyverse (H.
51
Wickham, 2017), dplyr (Hadley. Wickham & Francois, 2015), readr (H. H. Wickham, J.;
52
Francois, R., 2017), reshape2 (H. Wickham, 2007), RMarkdown (Allaire, 2018), and epuRate
53
(Holtz, 2020).
54
We would like to thank Allan McRae, the Institute of Molecular Bioscience (IMB) and 55
the Research Computing Centre (RCC) IT teams at the University of Queensland for their 56
support with high performance computing, data handling, storage and processing. 57
58
2. Abstract
59
The recent availability of large-scale neuroimaging cohorts facilitates deeper 60
characterisation of the relationship between phenotypic and brain architecture variation in 61
humans. Here, we investigate the association (previously coined morphometricity) of a 62
phenotype with all 652,283 vertex-wise measures of cortical and subcortical morphology in 63
a large data set from the UK Biobank (UKB; N=9,497 for discovery, N=4,323 for replication) 64
and the Human Connectome Project (N=1,110). We used a linear mixed model with the 65
brain measures of individuals fitted as random effects with covariance relationships 66
estimated from the imaging data. We tested 167 behavioural, cognitive, psychiatric or 67
lifestyle phenotypes and found significant morphometricity for 58 phenotypes (spanning 68
substance use, blood assay results, education or income level, diet, depression, and 69
cognition domains), 23 of which replicated in the UKB replication set or the HCP. We then 70
extended the model for a bivariate analysis to estimate grey-matter correlation between 71
phenotypes, which revealed that body size (i.e., height, weight, BMI, waist and hip 72
circumference, body fat percentage) could account for a substantial proportion of the 73
morphometricity (confirmed using a conditional analysis), providing possible insight into 74
previous MRI case-control results for psychiatric disorders where case status is associated 75
with body mass index. Our LMM framework also allowed to predict some of the associated 76
phenotypes from the vertex-wise measures, in two independent samples. Finally, we 77
demonstrated additional new applications of our approach (i) Region Of Interest (ROI) 78
analysis that retain the vertex-wise complexity; (ii) comparison of the information retained 79
by different MRI processings. 80
81
3. Keywords 82
Brain MRI, Morphometricity, mixed models, association, prediction, grey-matter correlation 83
84
4. Introduction
85
The field of MRI studies is at a turning point owing to the recent availability of large data 86
sets to researchers, including the UKB (Miller et al., 2016) and HCP (Van Essen et al., 2013; 87
Van Essen, Ugurbil, et al., 2012) samples. These datasets promote the replication of 88
previous findings, but also the identification of small(er) associations and the expansion of 89
the range of phenotypes available for study (e.g. psychiatric symptoms and lifestyle factors). 90
Furthermore, the boost in statistical power may allow the simultaneous use of all the brain 91
complexity data of current MRI acquisitions rather than relying on data reduction 92
techniques (e.g. the region-of-interest [ROI] approach). In addition, these community 93
samples can complement the typical case-control paradigm by identifying confounders of 94
MRI analyses or by studying related traits (e.g. cognition domains relevant in Alzheimer’s 95
disease). However, “big-data” neuroimaging offers a number of statistical challenges (on top 96
of the obvious computing ones)(Smith & Nichols, 2018): i) the curse of dimensionality (the 97
number of tests may increase faster than the sample size) which requires efficient methods 98
and appropriate control of multiple testing; ii) the possibility that (small) associations result 99
from confounding (via another variable, or acquisition noise); iii) the difficulty to generate 100
prediction from complex datasets. 101
Here, we propose a linear mixed model (LMM), efficiently implemented to tackle several 102
of these big-data neuroimaging challenges. Our approach allows performing association and 103
prediction analyses on tens of thousands of participants with more than 650,000 vertex-104
wise morphological measurements of grey-matter structure per individual. Specifically, we 105
overcame the curse of dimensionality by estimating the total correlation of all cortical and 106
subcortical measurement at vertices with a phenotype of interest (previously coined 107
morphometricity (Sabuncu et al., 2016), here we prefer the more specific brain-108
morphometricity). Using the same framework, we also estimate the total association of a 109
trait with differently processed MRI images as well with subset of the vertex-wise data 110
corresponding to specific brain features, hemispheres or regions of interest (ROIs). We 111
further introduce multi-trait LMMs that can quantify shared morphometricity between 112
traits (grey-matter correlation). Grey-matter correlation can help generate hypotheses 113
about putative confounders (that may be regressed out in a conditional analysis) or about 114
the origin of brain-morphometricity. Finally, we show how the same LMMs can be used to 115
construct grey-matter scores that achieve brain MRI-based prediction in independent 116
samples. As such, our approach unifies association and prediction analyses, in order to 117
unravel the brain-phenome relationships (Rosenberg, Casey, & Holmes, 2018) in big-data 118
neuroimaging. 119
To demonstrate the applicability and usefulness of our methods, we analysed two of the 120
largest MRI datasets available (UKB [split into discovery N=9,888 and replication N=4,561] 121
and HCP [N=1,110]) and considered a wide range of phenotypes spanning demographics, 122
blood cell composition, diet, psychiatric and traumatic history, physical capacities, and 123
substance use. We discuss our results in the context of the recent commentary article of 124
Smith & Nichols (Smith & Nichols, 2018). We have released our image processing and 125
analysis software/scripts as well as all summary statistics to facilitate replication and re-use 126
of the results. 127
128
5. Materials and Methods
129
5.1.UK Biobank (UKB) sample(s)
130
The UKB participants were unselected volunteers from the United Kingdom (Sudlow 131
et al., 2015) living near the imaging centres (Manchester for 96.5% of our sample, Newcastle 132
for the remaining 3.5%). Exclusion criteria included: presence of metal implant, recent 133
surgery and health conditions problematic for MRI imaging (e.g. hearing, breathing 134
problems or extreme claustrophobia) (Miller et al., 2016). MRI acquisition parameters have 135
been reported previously (Miller et al., 2016) and are summarised in Appendix S1. 136
We split the available UKB data into a discovery and replication sample based on 137
their imaging date. The discovery sample consisted of 9,497 adults aged 62.5 on average 138
(SD=7.5, range 44.6–79.6) and comprised 52.4% of female participants (see Appendix S2 for 139
details of processing and QC; Dataset S1 for description of excluded participants). The UKB 140
replication sample (N=4,323) was on average 63.1 years old (SD=7.46, range 46.1-80.3) with 141
52.1% of females (see Dataset S1, Appendix S2). 142
We included 168 variables grouped in several categories: demographics, cognition, 143
physical test, psychiatry, recent feelings, stress and traumas, substance use, miscellaneous, 144
brain measurements, blood assay and diet (see Dataset S2 for details). When longitudinal 145
observations were available for a participant, we used the one collected as part of the 146
imaging assessment or the closest in time to that. 147
148
5.2. UKB image processing 149
We processed the T1w and T2w images using FreeSurfer 6.0 (Fischl, 2012) to extract 150
cortical surface area and thickness, and we used the ENIGMA-shape protocols to measure 151
the structure of 7 subcortical volumes (hippocampus, putamen, amygdala, thalamus, 152
caudate, pallidum and accumbens) (Boris A. Gutman, Madsen, Toga, & Thompson, 2013; B. 153
A. Gutman, Wang, Rajagopalan, Toga, & Thompson, 2012). In FreeSurfer, we processed T1w 154
and T2w together to enhance the tissue segmentation, hence a more precise skull stripping 155
and pial surfaces definition. When the T2w was not acquired or not usable, we processed 156
the T1w image by itself. 157
We retained the full cortical information by using the (“fsaverage”) cortical mesh for 158
cortical thickness and surface area. This corresponded to about ~149,900 cortical vertices 159
for each hemisphere and modality. In addition, we extracted subcortical radial thickness and 160
log Jacobian determinant (surface deformation, somewhat analogous to a relative surface 161
area (Roshchupkin et al., 2016)) for 13,560 vertices across the 7 subcortical volumes (Boris 162
A. Gutman et al., 2013). Overall, the imaging data used in the analyses comprised 652,283 163
vertex measurements per individual: 299,009 for cortical thickness, 299,034 for cortical 164
surface area, 27,120 for subcortical thickness and 27,120 for subcortical curvature. 165
For comparison with ROI based processing, we extracted cortical thickness and 166
surface area of 34 cortical regions (Desikan et al., 2006; Fischl et al., 2004) and volumes of 167
the subcortical structures (ENIGMA processing). To further the comparison of processing 168
options, we extracted cortical measurements from smoothed fsaverage meshes (fwhm 5, 169
10, 15, 20 and 25mm) as well as (unsmoothed) coarser meshes provided by FreeSurfer: 170
fsaverage6 (149,091 vertices across all hemispheres and modalities), fsaverage5 (37,455 171
vertices), fsaverage4 (9,457 vertices) and fsaverage3 (2,414 vertices). 172
173
5.3. Human Connectome Project (HCP) sample
174
HCP participants were recruited from ongoing longitudinal studies of the Missouri 175
Family Study and had to be between 22 and 35 years of age. Inclusion and exclusion criteria 176
have been described previously (Van Essen, Ugurbil, et al., 2012) (see Appendix S1 for the 177
MRI acquisition parameters, Appendix S2 for QC). As per the HCP “1200 Subjects data 178
release” (1st of March 2017), 1,113 participants were scanned on the 3T MRI and underwent 179
extensive behavioural testing. Participants were mostly (54.4%) females and were 28.8 180
years old on average (SD=3.7, range 22–37). The sample comprised 286 monozygotic twins 181
(138 complete pairs) and 169 dizygotic twins (78 complete pairs). In addition, siblings and 182
half siblings of twins were also recruited which resulted in 445 distinct families in the 183
sample. 184
For the HCP sample, we included 161 variables, some of which were also available in 185
the UKB (e.g. demographics, cognition, physical assessment, blood assay or psychiatry). We 186
also included: personality, emotion, mental health assessment (Semi-Structured Assessment 187
for the Genetics of Alcoholism (SSAGA) and Adult Self Report (ASR) (Thomas M Achenbach, 188
2009; T. M. Achenbach, Dumenci, & Rescorla, 2003)), detailed cognition, Pittsburgh sleep 189
index (PSQI) (Buysse, Reynolds, Monk, Berman, & Kupfer, 1989), or results from the urine 190
drug tests (see Dataset S2). 191
192
5.4. Image processing in the HCP 193
The FreeSurfer processing was performed by the HCP team (Glasser et al., 2013; 194
Marcus et al., 2013; Van Essen, Glasser, Dierker, Harwell, & Coalson, 2012) using an optimal 195
combination of automated and manual steps (Appendix S3). We downloaded the 196
segmented images (Marcus et al., 2011) and performed the ENIGMA-shape analysis (Boris 197
A. Gutman et al., 2013; B. A. Gutman et al., 2012) to extract vertex-wise measurements of 198
the subcortical volumes. As with the UKB sample, a total of 652,283 vertex measurements 199
were extracted for each individual. 200
201
5.5. Covariates used 202
Our baseline model included commonly used covariates in MRI analyses: acquisition 203
variables (UKB imaging wave, processing with T1w or with combined T1w+T2w), age, sex, 204
and head size (intra-cranial volume (ICV) as well as left and right total cortical surface area 205
and cortical thickness that correspond to the measurements used here). In a follow-up 206
analysis, we included other covariates such as height, weight and BMI to evaluate their 207
confounding effect on the reported associations. As some of the covariates are correlated 208
we report the adjusted R2 (from linear regression in R3.3.3 (R Development Core Team, 209
2012))calculated by adding progressively the covariates (same order as above). The 210
associations with covariates was highly concordant between the two UKB samples (Figure 211
S1).
212 213
5.6. Linear mixed models for association and prediction
214
We aimed to estimate the proportion of variance of a trait captured by brain 215
features, which Sabuncu et al., called “morphometricity” (Sabuncu et al., 2016). To do so we 216
consider the following linear mixed model (Figure 1) that allows estimating the association 217
between a phenotype and M vertices even when M is greater than the sample size (N): 218
( 1) 219
where is the phenotype considered with N the number of observations, is a matrix
220
of c covariates (as such does not include any vertex variable), c,1 is a vector of fixed effects,
221
is a vector of random effects with and is a vector of error terms with 222
. In this formulation is the identity matrix as we assume the error terms to 223
be independent and identically distributed. is a matrix of variance-covariance between
224
individuals calculated from all vertex measurements, which we will refer to as the brain 225
relatedness matrix (BRM, Figure 1). Off-diagonal elements of the BRM reflect the grey-226
matter similarity between two individuals (see Appendix S4). Finally, and are the 227
variance components for the random effects and . For context, this model is analogous 228
to that used in complex trait genetics to estimate SNP-based heritability, where a Genetic 229
Relatedness Matrix (GRM) replaces the BRM (Yang et al., 2010; Yang, Lee, Goddard, & 230
Visscher, 2011), or that used to estimate the proportion variance in a phenotype captured 231
by all DNA methylation or gene expression measures of the genome (Zhang et al., 2019). 232
The element i,j of the BRM can be calculated as the inner product of brain measurements of 233
individuals i and j: . Here, represents the value of vertex m for
234
individual i centred and standardised over all individuals, represents the value of vertex
235
m for individual j centred and standardised over all individuals, M is the total number of 236
vertices or brain features included. In matrix notation, with being a matrix of
237
the centred and standardised brain observations. We estimated the proportion of the trait 238
variance captured by the grey-matter measurements as: (Figure 1) using the 239
REstricted Maximum Likelihood (REML)(Patterson & Thompson, 1971) implemented in 240
OSCA (OmicS-data-based Complex trait Analysis) (Zhang et al., 2019). We tested whether 241
the morphometricity was different from 0 using a likelihood ratio test (see Appendix S5 for 242
details). 243
We extended the LMM above to jointly estimate the variance accounted for by the 244
different modalities (cortical thickness, cortical area, subcortical thickness, subcortical area). 245
246
with , and all other parameters left unchanged. Each is
247
constructed from the vertex-wise measurements of a single modality, with the
248
corresponding association and
the brain-morphometricity. 249
Next, we sought to estimate the correlation between two traits that is attributable 250
to the same grey-matter variation, which we call grey-matter correlation rGM (Figure 1). This
251
can be achieved by fitting a bivariate LMM, a direct extension of the models presented 252
above (Thompson, 1973). We restricted our bivariate analysis to variables that were 253
significantly associated with grey-matter structure. We derived the residual correlations ( 254
from the phenotypic ( ) and grey-matter correlations estimated by GCTA (Genome-wide 255
Complex Trait Analysis) (Yang et al., 2011) (option not yet included in OSCA). We calculated 256
its SE using the delta method (Appendix S6 and (Bijma & Bastiaansen, 2014; Lee, Yang, 257
Goddard, Visscher, & Wray, 2012; Visscher, 1998)). 258
We detailed power calculations for the LMMs (Appendix S7, (Visscher et al., 2014)), 259
which showed that in the UKB discovery sample we had good power to detect a small 260
morphometricity (R2>2.2%) but only a moderate grey-matter correlation (rGM>0.35).
261
Statistical power was a lot reduced in the HCP due to the smaller sample size. 262
We demonstrated two further utilities of LMMs for neuroimaging data analyses. 263
First, we conducted post-hoc analyses to test the associations with each modality and each 264
cortical (Desikan et al., 2006) or subcortical structure. We used BRMs specific to each region 265
and brain measurement (Figure 1), which bridges the gap between ROI and vertex-wise 266
analyses. Second, we define as “best” processing the MRI cortical processing that maximises 267
the association with a trait of interest, from the minimal number of features (vertices). 268
Thus, we evaluated which of our FreeSurfer processing (fsaverage – no smoothing; 269
fsaverage – smoothing fwhm5, 10, 15, 20, 25; fsaverage6, 5, 4, 3 – no smoothing; ENIGMA 270
ROI processing) maximised the brain-morphometricity for all the UKB traits (See Appendix 271
S2 for details about QC). As the ENIGMA processing only consists of 150 measurements, we
272
used linear models (multiple regression and adjusted R2) to estimate the brain-273
morphomometricity. 274
Finally, we derived brain prediction scores using the Best Linear Unbiased Predictors 275
(BLUP, Figure 1) (Henderson, 1950, 1975; G. K. Robinson, 1991) and evaluated them in the 276
UKB discovery sample using a 10-fold cross-validation design. In addition, we derived BLUP 277
brain prediction scores constructed from the UKB discovery sample, and applied them to 278
the UKB replication and HCP participants to evaluate the “out of sample” predictive 279
performance. BLUP estimates the predicted values of the random effects (b or Zu, see (1) 280
and Figure 1) (Goddard, Wray, Verbyla, & Visscher, 2009; G. K. Robinson, 1991). In short, 281
BLUP scores integrate the correlations between vertices to derive weights that correspond 282
to the joint effects of all the vertices (Figure 1). BLUP have desirable statistical properties: 283
they are unbiased and are best predictors in the sense that they minimise the mean square 284
error in the class of linear unbiased predictors (Henderson, 1975; G. K. Robinson, 1991), 285
leading to more accurate prediction than other linear predictors (M. R. Robinson et al., 286
2017; Vilhjalmsson et al., 2015). 287
5.7. Prediction accuracy of BLUP versus LASSO
289
We compared prediction accuracy achieved by BLUP scores to that of LASSO (least 290
absolute shrinkage and selection operator) (Tibshirani, 1996) for phenotypes with significant 291
brain-morphometricity (baseline covariates). LASSO penalises vertices coefficients of the 292
linear regression, leading to select a subset of vertices (and their weights) that maximise 293
prediction accuracy. We used the LASSO function implemented in the bigstatsr R package 294
(Privé et al., 2018) and estimated the hyper-parameter using cross-model selection and 295
averaging on 5 folds within the UKB discovery sample. For each grey-matter score, we 296
reported the prediction R2 on the UKB replication sample and tested the difference in 297
prediction using a Wilcoxon test on the absolute errors of the BLUP and LASSO predictors. 298
299
5.8. Data and code availability statement
300
Data used in this manuscript are held and distributed by the HCP and UKB teams. We 301
have released the scripts used in image processing and LMM analyses to facilitate 302
replication and dissemination of the results (see URLs). We have also released BLUP weights 303
to allow meta-analyses or application of the grey-matter scores in independent cohorts. 304
305
6. Results
306
6.1.Associations between phenotypes and all grey-matter structure vertices
307
For the phenotypes of interest, we summarised in circular barplots (Figure 2) the 308
proportion of phenotypic variance associated with all 652,283 vertex-wise grey-matter 309
measures (brain-morphometricity, R2) as well as with baseline covariates (see Methods). 310
Figure 2 shows only the results that were significant after Bonferroni correction
311
(pUKB_discovery<2.8e-4 and pHCP<2.9e-4). The full results are available in Dataset S3, S4 (see
312
Figure S2 for positive control associations with global measures of the brain).
Grey-matter structure was strongly associated (R2>0.40) with age, sex, as well as 314
weight, BMI waist and hip circumference but also with maternal smoking around birth 315
(R2=0.39) and number of cigarettes previously smoked (R2=0.27) (Figure 2). We identified 316
many other phenotypes significantly associated with grey-matter structure (Figure 2, 317
Dataset S3) including other measures of build (e.g. height, body fat percentage, basal
318
metabolic rate), substance use (e.g. amount of alcohol drank each day), household income 319
level and education level, strength (e.g. hand grip, acceleration), cognition (e.g. fluid IQ), 320
blood assay (e.g. white blood cell count), diet (cheese intake), but also perhaps more 321
surprisingly with being a twin or overall health rating. We also found associations with 322
clinical phenotypes such as diabetes, depression score and depression symptoms. We 323
replicated 23 of the 58 associations listed above in the UKB replication sample (p<0.05/58; 324
Figure S3, Dataset S4). We did not detect any significant association between grey-matter
325
structure and other psychiatric variables (diagnoses and symptoms), self-reported stresses 326
and traumas, or neuroticism (Dataset S3). The interested readers may also find the 327
morphometricity estimates for the full UKB sample (inverse-variance weighted meta-328
analysis) in Dataset S3. 329
In the UKB (discovery), results and conclusions did not change regardless of fitting a 330
single random effect or several random effects each corresponding to one of the grey-331
matter modalities (Figure S4). In the HCP, we observed 3 extra significant associations 332
between grey-matter structure and cocaine (urine test), self-reported number of times used 333
cocaine or hallucinogens. Similar to the association found with opiate (urine test), these 334
results warrant replication due to the small number of positive participants. Finally, the HCP 335
results did not change when excluding related individuals (Appendix S8). 336
6.2. Adjustment for possible confounders
338
The large associations between grey-matter structure and height, weight, BMI, waist 339
and hip circumference (Figure 2) led us to perform a sensitivity analysis to evaluate their 340
contribution to the brain-morphometricity of the traits studied. We repeated the analysis 341
further controlling for height, weight and BMI, which yielded lower R2 estimates (Figure S5) 342
and fewer significant associations with grey-matter structure. Thus, when correcting for 343
height in the UKB, 4 of the 58 associations with grey-matter structure did not remain 344
significant: household income, monocyte percentage, beef intake, and time spent using 345
computer, Dataset S3). Such finding is consistent with the reported association between 346
body size and income or socio-economic status in the UKB (Tyrrell et al., 2016). When 347
further correcting for weight and BMI another 14 associations did not remain significant 348
including educational attainment, frequency drinking alcohol, most diet items (cereal, dried 349
fruits, poultry, processed meat), time spent driving, red blood cell count, frequency of walks 350
and small exercise. Notably, the brain-morphometricity of the depression score could be 351
completely explained by differences in weight and BMI (R2baseline=0.050, SE=0.018;
352
R2baseline+height=0.048, SE=0.017, R2baseline+height+BMI+weight<0.001, SE=0.007), and none of the
353
associations between grey-matter structure and depression symptoms remained significant 354
conditioning on weight and BMI (Tiredness, Anhedonia, Poor appetite- overeating, 355
R2baseline+height+BMI+weight<0.014). Yet, even after controlling for body size, we still detected a
356
significant morphometricity for cheese intake as well as time watching TV (Dataset S3), 357
suggesting that these behaviours are associated with brain structure irrespective of body 358
size. The morphometricity estimates in the UKB replication sample aligned with those from 359
the discovery sample (cor=0.90), except for age and sex that showed larger associations 360
with grey-matter structure in the replication analysis (Figure S6). In the HCP dataset, after 361
controlling for body size, four of the 27 associations did not remain significant (Dataset S4) 362
though we had limited power to detect associations smaller than R2 of 0.2 in this sample 363
(see Appendix S7). 364
In light of these results, we chose a conservative approach to control for body size 365
variables in the main text, though the analyses using baseline covariates can be found in the 366
supplementary. We acknowledge (see discussion) that this may be overly conservative, by 367
implicitly making strong assumptions about body size acting as a confounding factor. On the 368
other hand, it avoids reporting associations that may be fully or in part caused by 369
differences in body shape. 370
371
6.3. Grey-matter correlations
372
We estimated grey-matter correlation (rGM) between the phenotypes that showed
373
significant brain-morphometricity in the univariate analyses (Figure 2). rGM can be
374
interpreted as the correlation between the grey-matter vertices associations with each trait. 375
We controlled for height, weight and BMI on top of the baseline covariates, leaving a 376
conservative set of 35 UKB (18 HCP) phenotypes (Figure 3; Datasets S5 [UKB], S6 [HCP]). In 377
the UKB, we observed significant positive grey-matter correlations between cognition 378
domains, substance use phenotypes or between measures of physical activity (Figure 3). In 379
addition, we found unexpected large grey-matter correlations. For example, cheese intake 380
and forced expiratory volume were both correlated (rGM=1.0, SE=0.11) with fluid
381
intelligence, and waist circumference was correlated with overall health rating and pulse 382
rate (rGM>0.67). Overall, 9 out of the 26 significant correlations replicated in the UKB
383
replication sample (p<0.05/26 i.e. p<1.9e-3, Table S1). In the HCP, we also observed positive 384
grey-matter correlations between cognition domains or between the two tobacco related 385
phenotypes. Though, unlike in the UKB, we found a significant rGM between IQ dimensions
386
and education level (Figure 3, Dataset S6). 387
For completeness, we estimated grey-matter correlations under the baseline model 388
(Figure S7), which reveals many large grey-matter correlations between measures of body 389
size and diet, blood assay, activity levels and depression symptoms and score. These results 390
further highlight that in the phenome, the brain-morphometricity of some traits may be 391
accounted for by the covariation between these phenotypes and body size measurements. 392
In particular, depression score was correlated (rGM=1) with weight, BMI waist or hip
393
circumference, consistent with its brain-morphometricity lowered to 0 when controlling for 394
body size (Figure S7). 395
396
6.4.Associations with grey-matter structure of specific cortical and subcortical regions
397
We investigated the brain-morphometricity of traits by estimating the association 398
with grey-matter structure of specific cortical (Desikan et al., 2006) and subcortical regions, 399
correcting for multiple testing (Bonferroni significance threshold of 0.05/(164*39)=7.2e-6 in 400
the UKB, 1.2e-5 in the HCP). We found many significant ROIs associations with UKB 401
phenotypes, including age, sex, maternal smoking around birth, fluid intelligence, diabetes 402
or substance use (Figure S8 and Dataset S7). In particular, the associations between grey-403
matter structure and body size were pervasive (72/164 significant ROIs associations with 404
height, 109 with waist circumference, 105 with BMI) (Figure S9, Dataset S8), suggesting that 405
when acting as confounders height, weight or BMI could lead to false positives in many 406
brain regions. We replicated 633 out of the 975 significant ROI-trait associations 407
(p<0.05/975, see Dataset S9 for results on UKB replication sample). Most replicated 408
associations were found with age, sex and body size variables, though we also replicated 409
associations between subcortical volumes and hand grip strength or time spent watching TV 410
(Dataset S7-9). Overall, some of the trait-ROIs associations were partially redundant as 411
indicated by a sum of R2 (over ROIs) greater than the morphometricity (see Appendix S9 for 412
detailed results and discussion, Dataset S10 for results in HCP). 413
414
6.5. Better cortical processing
415
We compared the brain-morphometricity estimates obtained by varying the cortical 416
processing options: smoothing of the cortical meshes and applying coarser FreeSurfer 417
meshes. We found that applying smoothing (5-25mm) or reducing the cortical mesh 418
complexity always led to a lower point estimate of brain morphometricity in the UKB 419
discovery (Figure 5) and replication (Figure S10, Datasets S11-12 for full tables) samples. 420
These differences were significant for a handful of variables (incl. age, sex, maternal 421
smoking or body size) using a stringent definition of significance based on overlapping 422
confidence intervals (Table S3). Thus, the fsaverage cortical mesh with no smoothing may 423
be deemed a better processing approach for at least some of the phenotypes considered. 424
Similarly, we found that the vertex-wise approach always yielded greater association R2, 425
thus retained more information than a ROI based dimension reduction (Figure S11). 426
427
6.6.Ten-fold cross-validation in the UKB and prediction into the UKB replication sample
428
For each UKB participant, we calculated (BLUP) grey-matter scores relative to 429
phenotypes showing significant brain-morphometricity. As in sections above, for height, 430
weight and BMI we controlled for baseline covariates and further regressed out body size 431
for all other phenotypes. 432
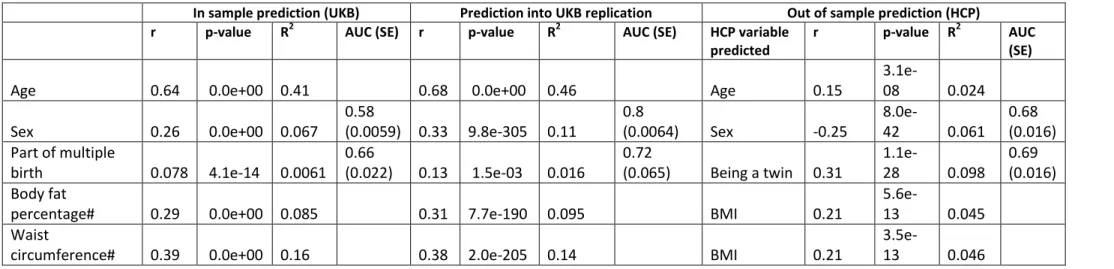
In the 10-fold cross-validation analysis, most grey-matter scores significantly 433
correlated (positively) with their corresponding phenotypes (significance threshold of 434
0.05/39=1.2e-3, Table 1, S3, Figure 4). Albeit significant, prediction accuracy was overall low 435
(typically r<0.10, including r=0.11 for sex, r<0.09 with cognition, r=0.08 for alcohol intake, 436
r=0.06 with smoking status) except for age (r=0.60) and maternal smoking around birth 437
(r=0.26). We found similar prediction results in the UKB replication sample, with 29 438
associations reaching significance at p<1.2e-3 (Table 1, S3). Prediction accuracy into the UKB 439
replication sample was on par for most traits, though slightly greater for age and sex 440
compared to the cross-validation results (Figure 4, Table 1, S3). This is consistent with a 441
larger training sample being used and larger morphomometricity observed in the replication 442
set (Figure S6). 443
When not correcting for body size, 56/58 BLUP scores significantly correlated with 444
the observed values in the 10-fold cross validation and 42 associations replicated using the 445
UKB replication sample (p<0.05/58, See FigureS12 and DatasetS13). Predicted age 446
correlated with chronological age (r=0.72 in the discovery, r=0.70 in the replication), while 447
predicted sex also strongly associated with the observed value (AUC of 0.90 and 0.89). Grey-448
matter scores of body shape (under the baseline covariates) were also significantly 449
correlated with the observed values (r=0.25 for height, r=0.29 for body fat percentage, 450
r=0.39 for weight and hip or waist circumference, r=0.45 for BMI). Finally, grey-matter 451
scores of BMI correlated positively with depression symptom count (r=0.10, p-value<1e-14), 452
as expected from the brain-morphometricity of depression being limited by the covariation 453
with body size. It even outperformed the grey-matter score built from the depression score 454
itself (r=0.05, p-value<1e.5). 455
BLUP achieved similar to superior prediction accuracy (R2) compared to LASSO brain 456
scores across the 58 phenotypes (Figure S13, Dataset S13). BLUP significantly outperformed 457
LASSO (Wilcoxon test on absolute errors, p<0.05/58) in predicting hip circumference, 458
alcohol intake and number of correct symbol matches (cognition). 459
460
6.7.Out of sample prediction – application in the HCP sample
461
Out of sample prediction validates that the morphometric associations are 462
generalizable to independent brain images, beyond population and scanner differences. For 463
traits only available in the UKB (e.g. waist circumference) we used a proxy in the HCP (e.g. 464
BMI). Grey matter scores for age, sex, and being a twin significantly correlated with the 465
observed values (rage=0.15, rsex=0.25, rtwin-status=0.31, Table 1, Table S3 and Figure 4).
Grey-466
matter score for maternal smoking around birth correlated with smoking status (r=0.19). 467
None of the other grey-matter scores significantly correlated with a similar HCP variable. 468
Without correcting for body size, 19 BLUP scores correlated to corresponding 469
variables (Dataset S13, Figure S12). For example, scores for BMI, body fat percentage, hip or 470
waist circumference also correlated positively with BMI (r=0.21, p-value<1.2e-3), while 471
scores for height and weight also correlated with the observed phenotypes (rHeight=0.17,
472
rWeight=0.19). Finally, scores build from diet items or quantifying activity levels significantly
473
predicted BMI in the HCP. 474
475
7. Discussion
476
We have introduced a set of analyses, that rely on linear mixed models (LMMs, Figure 1) to 477
perform association and prediction, while being suited to tackle the challenges of big-data in 478
neuroimaging (Smith & Nichols, 2018). We have demonstrated their applications in two of 479
the largest MRI cohorts available for research (UKB (Miller et al., 2016) and HCP (Van Essen 480
et al., 2013)) using a fine-grained processing of anatomical MRI that consisted in >650,000 481
grey-matter measurements per individual. In LMMs, the overall effect of the high 482
dimensional vertex-wise measures is modelled by a single random effect, with a variance-483
covariance structure calculated from the vertex-wise data: the brain relatedness matrix 484
(BRM, Figure 1). BRM off-diagonal elements represent the relative global similarity between 485
grey-matter structure of two people. The model is equivalent to fitting all vertices as a set of 486
random effects, constraining the association effect sizes to be normally distributed (Figure 487
1), which can be seen as an extension of multiple regression when the number of variables
488
exceeds the number of participants. This framework allows estimating new sample 489
characteristics such as the total association (morphometricity (Sabuncu et al., 2016)) 490
between a phenotype and vertex-wise brain data or grey-matter correlations that quantify 491
how much phenotypes may be similarly associated with grey-matter. In addition, it offers to 492
build performant brain-based predictors that do not require hyper-parameter estimation. 493
Our analyses replicated and extended previous morphometricity reports (Sabuncu et 494
al., 2016) (Figure 2, Dataset S3, S4). We have demonstrated that our methods produce 495
robust, replicable results (Figure S3, S6, S10, Table S1, S3) that were partly transferrable on 496
a completely independent sample (the HCP) despite large differences between the samples 497
(Table S2, Dataset S13). We have shown additional utilities of this LMM framework such as
498
the ROI based association test that retained the vertex-wise complexity of a brain region 499
(Fig S8-S8, Appendix S9, Dataset S7-S10), rather than summarising them by a single average 500
measure, effectively bridging the gap between ROI/atlas based and vertex-wise analyses. 501
Our results aligned with previously published associations with sex (Ritchie et al., 2018), BMI 502
(Cole et al., 2013; Gupta et al., 2015; Kurth et al., 2013; Masouleh et al., 2016; Medic et al., 503
2016; Opel et al., 2017) or substance use (Cardenas, Studholme, Gazdzinski, Durazzo, & 504
Meyerhoff, 2007; Gallinat et al., 2006; Gillespie et al., 2018; Hanlon et al., 2016; Pitel, 505
Segobin, Ritz, Eustache, & Beaunieux, 2015) (see details in Appendix S9). We showed 506
another application of LMMs for big-data neuroimaging: to compare the amount of 507
information retained by different MRI image processing. We found that using the most 508
complex cortical mesh (“fsaverage”) with no smoothing maximised the brain-509
morphometricity across all phenotypes studied, though further statistical testing of the 510
difference is required (Table S3). This suggests there is meaningful information in fine 511
grained grey-matter data that is lost when performing local averages (via smoothing, 512
coarser mesh or average over a ROI). More work is needed to compare our surface-based 513
approach (Fischl, 2012) to volume based processing (Flandin & Friston, 2008), or evaluating 514
the putative added value of including the T2w image (on top of the T1w). To finish on 515
processing, in the UKB we combined vertex-wise data estimated from T1w and T1w+T2w 516
which is meant to improve grey-matter segmentation, though few studies quantified it 517
(Lindroth et al., 2019). Here, we confirmed a difference in cortical thickness between 518
processing groups (Lindroth et al., 2019)(Figure S2), though our data driven QC (Appendix 519
S2) excluded 80% of the 400-odd participants processed using T1w only (flagged as outliers).
520
We corrected for processing type in the analyses and the good replication of the UKB 521
associations (Figure S3, S6, Table S1) in addition to the out of sample prediction (Figure 4) 522
suggest that our results are robust. 523
Beyond the large morphometricity estimates found for age and sex, BMI, weight, 524
waist and hip circumference, and both passive and active smoking (Figure 2, Dataset S3), we 525
found many small(er) associations, with a wide array of phenotypes, including some more 526
unexpected ones (e.g. self-reported diet, being a twin, happiness with one’s health, blood 527
assay results (Figure 2, Dataset S3)). Such findings may echo the concerns raised by Smith 528
and Nichols about the presence of many (small) confounded associations in big-data 529
neuroimaging (Smith & Nichols, 2018). The fact that we replicated the morphometricity in 530
another UKB sample, does not completely rule out a confounding effect, as the same bias 531
(e.g. healthy bias in recruitment (Fry et al., 2017)) may be present. 532
We illustrated this concern using the example of body size (BMI, weight, height), 533
which showed large, replicated morphometricity and was available in both cohorts. We 534
evaluated its contribution to the reported morphometricity by performing conditional 535
analyses and bivariate LMMs. Both approaches yielded the same conclusions: a large 536
fraction of the morphometricity detected was attributable to body size (Figure S7, Dataset 537
S3). However, co-variation does not necessarily imply confounding (which requires
538
establishing direction of effects) but may instead point to intermediate phenotypes or arise 539
from the pervasive pleiotropy across the human phenome (Solovieff, Cotsapas, Lee, Purcell, 540
& Smoller, 2013). In addition, we are dealing with associations, meaning that (except for 541
exposures such as age or sex) the trait-vertex associations responsible for the 542
morphometricity may be a cause and/or a consequence of the phenotypes. For example, 543
there is a known association between BMI and depression, with evidence of pleiotropy, but 544
also of a causal effect of BMI on depression (Wray et al., 2018), though we do not know 545
which of BMI and grey-matter structure cause the other and cannot label body size a 546
confounder. Thus, a conservative interpretation is that morphometricity of the depression 547
score is limited to the shared variation with body size in the UKB (Dataset S3, Figure S7). 548
However, our findings shed a new light on previously published results, as even the largest 549
case-control international initiatives (e.g. ENIGMA-MDD (Schmaal, Hibar, et al., 2016; 550
Schmaal, Veltman, et al., 2016)) may reflect, at least in part, variance shared between 551
depression and BMI (Cole et al., 2013). More work is needed to understand body size 552
contribution to published results linking grey-matter anatomy to psychiatric disorders 553
(MDD, bipolar, schizophrenia and substance use are all associated with BMI (Luppino et al., 554
2010; McElroy & Keck, 2012; Rajan & Menon, 2017; Saarni et al., 2009; Wray et al., 2018)) 555
or sexually dimorphic traits (likely associated with height and weight). In addition, body size 556
may be differently associated with the phenome across countries or age groups, which may 557
limit the replication of findings and predictive abilities of body size dependent scores. 558
Finally, the possible confounding effects of body size are exacerbated in small case-control 559
samples, leading to increased chances of false positive associations (Button et al., 2013; 560
Ioannidis, 2005). Note that body size being associated to many brain regions (Figure S9), its 561
confounding effect could lead to widespread cortical or subcortical false positives. 562
A different example may be that of cheese intake, previously given as an absurd 563
example of putative association likely confounded by socio-economic status (Smith & 564
Nichols, 2018), and for which we found a significant (replicated) morphometricity, even 565
after correcting for body size (Figure 2, Dataset S3). Consistent with the hypothesis of a 566
confounded association, our bivariate analysis identified large rGM (rGM=1) between cheese
567
intake and household income level, or fluid intelligence (Figure S7), though the latter was 568
significant only when controlling for body-size (Figure 3). Thus, grey-matter correlation may 569
allow hypothesis-generation about the origin of the morphometricity signal and could help 570
better identifying putative confounders. If confirmed, such confounded morphometricity 571
would not translate into significant prediction into the general population (where IQ may 572
not be associated with cheese intake) or into another sample/country with different dietary 573
habits. 574
Beyond the confounding/mediating effect between phenotypes one should also be 575
wary of known MRI acquisition artefacts and confounds (Smith & Nichols, 2018). Here, we 576
focused on well-studied MRI modalities (T1w and T2w) which may be among the least 577
sensitive to artefacts, especially that acquisition was performed on a single MRI machine 578
and processed using standard image processing pipelines (Fischl, 2012). However, we 579
detected significant morphometricity for pulse rate, bone mineral density and indirect 580
measures of breathing rate/depth (Smith & Nichols, 2018), even after controlling for body 581
size (Dataset S3). In addition, the large grey-matter correlations between pulse rate and 582
overall health rating, and between forced expiratory volume and fluid intelligence (Figure 583
3), suggest they might indeed act as confounders. More work is needed to extend the list of
584
acquisition confounders studied (e.g. head motion), and more power is needed to detect 585
finer grained rGM with the phenotypes of interest (Appendix S7). Finally, note that rGM would
586
also capture correlated measurement errors between traits (e.g. when 2 traits are 587
associated with head motion). 588
Next, we constructed BLUP scores that estimate the random effects of the LMM and 589
demonstrated their predictive abilities in independent samples (UKB replication and to a 590
lower extend in the HCP, [Figure 4, S12, Table 1, S2, Dataset S11], which differs in term of 591
scanner and sample composition). In addition to its statistical properties (unbiased, best 592
predictor in the class of linear predictors), we demonstrated that BLUP achieved similar (to 593
greater) prediction accuracy compared to LASSO based prediction, while being more 594
computationally efficient than most traditional machine learning approaches as it does not 595
require hyper-parameter estimation. Note that prediction relates naturally to association 596
which is apparent from our model formulation (Figure 1). Thus, the morphometricity value 597
represents the upper asymptote achievable in linear prediction (Figure 4, (Dudbridge, 598
2013)); in addition, grey-matter correlation indicates when transfer learning is possible 599
between the 2 variables. The limited prediction accuracy currently prevents BLUP scores 600
being used in the clinical settings. However, they open the way to new analyses on samples 601
already collected, for which information was not or could not be collected. Further 602
application of our BLUP grey-matter scores include studying correlates of brain age or 603
predicted age difference (difference between predicted and chronological age) (Cole, 2017; 604
Cole et al., 2017; Liem et al., 2017). 605
Despite good statistical power in theory (Appendix S7), the low numbers for some of 606
the binary variables may explain the lack of associations found with psychiatry (e.g. 607
schizophrenia, ADHD), stresses, traumas (Dataset S3), which would have to be confirmed 608
using a larger UKB sample or case-control samples (see results in (Sabuncu et al., 2016)). 609
Similarly, a lot of the trait variance remains unaccounted for by the grey-matter structure 610
variation (Figure 2) which calls to study brain regions not extracted here (e.g. brain stem, 611
cerebellum), other processing options (e.g. volume based processing), or MRI images 612
(diffusion weighted, fMRI) to further characterise the phenotypes. 613
Our approach is suited to studying other MRI contrasts and even multiple MRI 614
modalities at once by fitting several random effect components (Figure S4). In addition, the 615
efficient implementation in the OSCA software (Zhang et al., 2019) means the analyses are 616
scalable to the future full UKB sample of 100,000 participants, which should improve power 617
and BLUP prediction accuracy (Dudbridge, 2013). Beyond the global or regional associations 618
reported here, future analyses should aim at identifying the vertices that contribute to the 619
morphometricity. An existing method is mass-univariate vertex-wise analysis, though this 620
comes as a huge increase of multiple testing burden and may still be underpowered with 621
the current sample sizes (Smith & Nichols, 2018). 622
623
8. URLs
Summary-level data (BLUP weights): https://cnsgenomics.com/content/data and 625
https://cloudstor.aarnet.edu.au/plus/s/T1gyJyQsF6wTMjF; Code used for the analyses and 626
plots is downloadable at https://github.com/baptisteCD/Brain-LMM and viewable at 627
https://baptistecd.github.io/Brain-LMM/index.html ; OSCA: 628
http://cnsgenomics.com/software/osca/ ; ENIGMA processing protocols: 629 http://enigma.ini.usc.edu/protocols/imaging-protocols/ ; 630 631 9. Author contributions 632
PMV, NRW, JY and BCD designed the analyses. FZ and JY developed the OSCA 633
software. YH and BCD created the plots. KK, LY and ZZ assisted BCD with the UKB phenotypic 634
and genetic data, including download, formatting and curation. LS downloaded and 635
processed the HCP MRI images under MJW supervision. BCD downloaded and processed the 636
UKB MRI images. BCD performed the analyses and wrote the manuscript. All the authors 637
reviewed the manuscript. 638
639
10. Competing financial Interests statement
640
The authors declare no conflict of interests. 641
642
References
643
Achenbach, T. M. (2009). Achenbach system of empirically based assessment (ASEBA): 644
Development, findings, theory, and applications: University of Vermont, Research 645
Center of Children, Youth & Families. 646
Achenbach, T. M., Dumenci, L., & Rescorla, L. A. (2003). Ratings of Relations Between DSM-647
IV Diagnostic Categories and Items of the Adult Self-Report (ASR) and Adult Behavior 648
Checklist (ABCL). 649
Ahlmann-Eltze, C. (2017). ggsignif: Significance Bars for 'ggplot2'. Retrieved from 650
https://cran.r-project.org/package=ggsignif
651
Allaire, J. X., Yihui.; McPherson, Jonathan.; Luraschi, Javier.; Ushey, Kevin.; Atkins, Aron.; 652
Wickham, Hadley.; Cheng, Joe.; Chang, Winston. . (2018). rmarkdown: Dynamic 653
Documents for R. Retrieved from https://cran.r-project.org/package=rmarkdown
Balduzzi, S., Rücker, G., & Schwarzer, G. (2019). How to perform a meta-analysis with R: a 655
practical tutorial. Evidence Based Mental Health, 22(4), 153. doi:10.1136/ebmental-656
2019-300117 657
Bijma, P., & Bastiaansen, J. W. (2014). Standard error of the genetic correlation: how much 658
data do we need to estimate a purebred-crossbred genetic correlation? Genetics 659
Selection Evolution, 46(1), 79. doi:10.1186/s12711-014-0079-z
660
Button, K. S., Ioannidis, J. P. A., Mokrysz, C., Nosek, B. A., Flint, J., Robinson, E. S. J., & 661
Munafo, M. R. (2013). Power failure: why small sample size undermines the 662
reliability of neuroscience. Nature Reviews Neuroscience, 14(5), 365-376. 663
doi:10.1038/nrn3475 664
Buysse, D. J., Reynolds, C. F., 3rd, Monk, T. H., Berman, S. R., & Kupfer, D. J. (1989). The 665
Pittsburgh Sleep Quality Index: a new instrument for psychiatric practice and 666
research. Psychiatry Res, 28(2), 193-213. 667
Cardenas, V. A., Studholme, C., Gazdzinski, S., Durazzo, T. C., & Meyerhoff, D. J. (2007). 668
Deformation-based morphometry of brain changes in alcohol dependence and 669
abstinence. Neuroimage, 34(3), 879-887. doi:10.1016/j.neuroimage.2006.10.015 670
Champely, S. (2017). pwr: Basic Functions for Power Analysis. Retrieved from
https://cran.r-671
project.org/package=pwr
672
Cole, J. H. (2017). Neuroimaging-derived brain-age: an ageing biomarker? Aging (Albany 673
NY), 9(8), 1861-1862. doi:10.18632/aging.101286
674
Cole, J. H., Boyle, C. P., Simmons, A., Cohen-Woods, S., Rivera, M., McGuffin, P., . . . Fu, C. H. 675
(2013). Body mass index, but not FTO genotype or major depressive disorder, 676
influences brain structure. Neuroscience, 252, 109-117. 677
doi:10.1016/j.neuroscience.2013.07.015 678
Cole, J. H., Poudel, R. P. K., Tsagkrasoulis, D., Caan, M. W. A., Steves, C., Spector, T. D., & 679
Montana, G. (2017). Predicting brain age with deep learning from raw imaging data 680
results in a reliable and heritable biomarker. Neuroimage, 163, 115-124. 681
doi:10.1016/j.neuroimage.2017.07.059 682
Desikan, R. S., Segonne, F., Fischl, B., Quinn, B. T., Dickerson, B. C., Blacker, D., . . . Killiany, R. 683
J. (2006). An automated labeling system for subdividing the human cerebral cortex 684
on MRI scans into gyral based regions of interest. Neuroimage, 31(3), 968-980. 685
doi:10.1016/j.neuroimage.2006.01.021 686
Dudbridge, F. (2013). Power and predictive accuracy of polygenic risk scores. PLoS Genet, 687
9(3), e1003348. doi:10.1371/journal.pgen.1003348
688
Fischl, B. (2012). FreeSurfer. Neuroimage, 62(2), 774-781. 689
doi:10.1016/j.neuroimage.2012.01.021 690
Fischl, B., van der Kouwe, A., Destrieux, C., Halgren, E., Segonne, F., Salat, D. H., . . . Dale, A. 691
M. (2004). Automatically parcellating the human cerebral cortex. Cerebral Cortex, 692
14(1), 11-22. doi:10.1093/cercor/bhg087
693
Flandin, G., & Friston, K. J. (2008). Statistical parametric mapping (SPM). Scholarpedia, 3(4), 694
6232. 695
Fry, A., Littlejohns, T. J., Sudlow, C., Doherty, N., Adamska, L., Sprosen, T., . . . Allen, N. E. 696
(2017). Comparison of Sociodemographic and Health-Related Characteristics of UK 697
Biobank Participants With Those of the General Population. American Journal of 698
Epidemiology, 186(9), 1026-1034. doi:10.1093/aje/kwx246
699
Gallinat, J., Meisenzahl, E., Jacobsen, L. K., Kalus, P., Bierbrauer, J., Kienast, T., . . . Staedtgen, 700
M. (2006). Smoking and structural brain deficits: a volumetric MR investigation. 701
European Journal of Neuroscience, 24(6), 1744-1750.
doi:10.1111/j.1460-702
9568.2006.05050.x 703
Gillespie, N. A., Neale, M. C., Bates, T. C., Eyler, L. T., Fennema‐Notestine, C., Vassileva, J., . 704
. . Wright, M. J. (2018). Testing associations between cannabis use and subcortical 705
volumes in two large population‐based samples. Addiction, 0(ja). 706
doi:doi:10.1111/add.14252 707
Glasser, M. F., Sotiropoulos, S. N., Wilson, J. A., Coalson, T. S., Fischl, B., Andersson, J. L., . . . 708
Consortium, W. U.-M. H. (2013). The minimal preprocessing pipelines for the Human 709
Connectome Project. Neuroimage, 80, 105-124. 710
doi:10.1016/j.neuroimage.2013.04.127 711
Goddard, M. E., Wray, N. R., Verbyla, K., & Visscher, P. M. (2009). Estimating Effects and 712
Making Predictions from Genome-Wide Marker Data. Statistical Science, 24(4), 517-713
529. doi:10.1214/09-Sts306 714
Gupta, A., Mayer, E. A., Sanmiguel, C. P., Van Horn, J. D., Woodworth, D., Ellingson, B. M., . . 715
. Labus, J. S. (2015). Patterns of brain structural connectivity differentiate normal 716
weight from overweight subjects. Neuroimage-Clinical, 7, 506-517. 717
doi:10.1016/j.nicl.2015.01.005 718
Gutman, B. A., Madsen, S. K., Toga, A. W., & Thompson, P. M. (2013). A Family of Fast 719
Spherical Registration Algorithms for Cortical Shapes. In L. Shen, T. Liu, P.-T. Yap, H. 720
Huang, D. Shen, & C.-F. Westin (Eds.), Multimodal Brain Image Analysis: Third 721
International Workshop, MBIA 2013, Held in Conjunction with MICCAI 2013, Nagoya,
722
Japan, September 22, 2013, Proceedings (pp. 246-257). Cham: Springer International
723
Publishing. 724
Gutman, B. A., Wang, Y. L., Rajagopalan, P., Toga, A. W., & Thompson, P. M. (2012). Shape 725
Matching with Medial Curves and 1-D Group-Wise Registration. 2012 9th Ieee 726
International Symposium on Biomedical Imaging (Isbi), 716-719.
727
Hanlon, C. A., Owens, M. M., Joseph, J. E., Zhu, X., George, M. S., Brady, K. T., & Hartwell, K. 728
J. (2016). Lower subcortical gray matter volume in both younger smokers and 729
established smokers relative to non-smokers. Addiction Biology, 21(1), 185-195. 730
doi:10.1111/adb.12171 731
Hanscombe, K. (2017). ukbtools: Manipulate and Explore UK Biobank Data. Retrieved from 732
kenhanscombe/ukbtools (github) 733
Harrell, F. E. J. (2017). Hmisc: Harrell Miscellaneous. Retrieved from
https://cran.r-734
project.org/package=Hmisc
735
Henderson, C. R. (1950). Estimation of Genetic Parameters. Annals of Mathematical 736
Statistics, 21(2), 309-310.
737
Henderson, C. R. (1975). Best Linear Unbiased Estimation and Prediction under a Selection 738
Model. Biometrics, 31(2), 423-447. doi:Doi 10.2307/2529430 739
Holtz, Y. (2020). epuRate: A clean template for R Markdown documents. Retrieved from 740
https://github.com/holtzy/epuRate
741
Ioannidis, J. P. (2005). Why most published research findings are false. PLoS Med, 2(8), e124. 742
doi:10.1371/journal.pmed.0020124 743
Kurth, F., Levitt, J. G., Phillips, O. R., Luders, E., Woods, R. P., Mazziotta, J. C., . . . Narr, K. L. 744
(2013). Relationships between gray matter, body mass index, and waist 745
circumference in healthy adults. Human Brain Mapping, 34(7), 1737-1746. 746
doi:10.1002/hbm.22021 747
Lee, S. H., Yang, J., Goddard, M. E., Visscher, P. M., & Wray, N. R. (2012). Estimation of 748
pleiotropy between complex diseases using single-nucleotide polymorphism-derived 749
genomic relationships and restricted maximum likelihood. Bioinformatics, 28(19), 750
2540-2542. doi:10.1093/bioinformatics/bts474 751
Liem, F., Varoquaux, G., Kynast, J., Beyer, F., Kharabian Masouleh, S., Huntenburg, J. M., . . . 752
Margulies, D. S. (2017). Predicting brain-age from multimodal imaging data captures 753
cognitive impairment. Neuroimage, 148, 179-188. 754
doi:https://doi.org/10.1016/j.neuroimage.2016.11.005
755
Lindroth, H., Nair, V. A., Stanfield, C., Casey, C., Mohanty, R., Wayer, D., . . . Sanders, R. D. 756
(2019). Examining the identification of age-related atrophy between T1 and T1 + T2-757
FLAIR cortical thickness measurements. Sci Rep, 9(1), 11288. doi:10.1038/s41598-758
019-47294-2 759
Luppino, F. S., de Wit, L. M., Bouvy, P. F., Stijnen, T., Cuijpers, P., Penninx, B. W. J. H., & 760
Zitman, F. G. (2010). Overweight, Obesity, and Depression A Systematic Review and 761
Meta-analysis of Longitudinal Studies. Archives of General Psychiatry, 67(3), 220-229. 762
doi:DOI 10.1001/archgenpsychiatry.2010.2 763
Marcus, D. S., Harms, M. P., Snyder, A. Z., Jenkinson, M., Wilson, J. A., Glasser, M. F., . . . 764
Consortium, W. U.-M. H. (2013). Human Connectome Project informatics: quality 765
control, database services, and data visualization. Neuroimage, 80, 202-219. 766
doi:10.1016/j.neuroimage.2013.05.077 767
Marcus, D. S., Harwell, J., Olsen, T., Hodge, M., Glasser, M. F., Prior, F., . . . Van Essen, D. C. 768
(2011). Informatics and data mining tools and strategies for the human connectome 769
project. Front Neuroinform, 5, 4. doi:10.3389/fninf.2011.00004 770
Masouleh, S. K., Arelin, K., Horstmann, A., Lampe, L., Kipping, J. A., Luck, T., . . . Witte, A. V. 771
(2016). Higher body mass index in older adults is associated with lower gray matter 772
volume: implications for memory performance. Neurobiology of Aging, 40, 1-10. 773
doi:10.1016/j.neurobiolaging.2015.12.020 774
McElroy, S. L., & Keck, P. E. (2012). Obesity in Bipolar Disorder: An Overview. Current 775
Psychiatry Reports, 14(6), 650-658. doi:10.1007/s11920-012-0313-8
776
Medic, N., Ziauddeen, H., Ersche, K. D., Farooqi, I. S., Bullmore, E. T., Nathan, P. J., . . . 777
Fletcher, P. C. (2016). Increased body mass index is associated with specific regional 778
alterations in brain structure. International Journal of Obesity, 40(7), 1177-1182. 779
doi:10.1038/ijo.2016.42 780
Miller, K. L., Alfaro-Almagro, F., Bangerter, N. K., Thomas, D. L., Yacoub, E., Xu, J., . . . Smith, 781
S. M. (2016). Multimodal population brain imaging in the UK Biobank prospective 782
epidemiological study. Nature Neuroscience, 19(11), 1523-1536. 783
doi:10.1038/nn.4393 784
Opel, N., Redlich, R., Kaehler, C., Grotegerd, D., Dohm, K., Heindel, W., . . . Dannlowski, U. 785
(2017). Prefrontal gray matter volume mediates genetic risks for obesity. Molecular 786
Psychiatry, 22(5), 703-710. doi:10.1038/mp.2017.51
787
Patterson, H. D., & Thompson, R. (1971). Recovery of Inter-Block Information when Block 788
Sizes are Unequal. Biometrika, 58(3), 545-554. doi:10.2307/2334389 789
Pitel, A. L., Segobin, S. H., Ritz, L., Eustache, F., & Beaunieux, H. (2015). Thalamic 790
abnormalities are a cardinal feature of alcohol-related brain dysfunction. Neurosci 791
Biobehav Rev, 54, 38-45. doi:10.1016/j.neubiorev.2014.07.023