Publisher’s version / Version de l'éditeur:
Vous avez des questions? Nous pouvons vous aider. Pour communiquer directement avec un auteur, consultez la première page de la revue dans laquelle son article a été publié afin de trouver ses coordonnées. Si vous n’arrivez pas à les repérer, communiquez avec nous à [email protected].
Questions? Contact the NRC Publications Archive team at
[email protected]. If you wish to email the authors directly, please see the first page of the publication for their contact information.
https://publications-cnrc.canada.ca/fra/droits
L’accès à ce site Web et l’utilisation de son contenu sont assujettis aux conditions présentées dans le site
LISEZ CES CONDITIONS ATTENTIVEMENT AVANT D’UTILISER CE SITE WEB.
Paper (National Research Council of Canada. Division of Building Research); no.
DBR-P-1142, 1983-02
READ THESE TERMS AND CONDITIONS CAREFULLY BEFORE USING THIS WEBSITE. https://nrc-publications.canada.ca/eng/copyright
NRC Publications Archive Record / Notice des Archives des publications du CNRC :
https://nrc-publications.canada.ca/eng/view/object/?id=638aba95-e310-423c-8276-54c282d8c8b1 https://publications-cnrc.canada.ca/fra/voir/objet/?id=638aba95-e310-423c-8276-54c282d8c8b1
NRC Publications Archive
Archives des publications du CNRC
This publication could be one of several versions: author’s original, accepted manuscript or the publisher’s version. / La version de cette publication peut être l’une des suivantes : la version prépublication de l’auteur, la version acceptée du manuscrit ou la version de l’éditeur.
For the publisher’s version, please access the DOI link below./ Pour consulter la version de l’éditeur, utilisez le lien DOI ci-dessous.
https://doi.org/10.4224/40001785
Access and use of this website and the material on it are subject to the Terms and Conditions set forth at
Fire cost control in Canada
National Research
Conseil national
job13
IlHl
1
Council Canada
de recherche Canada
FIRE COST CONTROL I N CANADA I by G. Williams-Leir Reprinted from Urban Analysis Vol. 7,1983 p. 169 - 2 1 0 DBR Paper No. 1142
Division of Building Research
Cet expos6 s e v e u t un compl'ment au r a p p o r t i n t i t u l ' e " i t u d e s u r l a pr'evention e t l a l u t t e c o n t r e l ' i n c e n d i e a u Canada" ( S w i t z e r e t B a i r d , 1980). I1 s e propose d ' a n a l y s e r l e s r6ponses a u q u e s t i o n n a i r e d i s t r i b u ' e d a n s l e c a d r e d e c e t t e e t u d e e t aborde l e s p o i n t s s u i v a n t s :
-
c a r a c t ' e r i s t i q u e s q u i d i s t i n g u e n t l e s c o r p s d e s a p e u r e pompiers p r o f e s s i o n n e l s d e s c o r p s d e sapeurs-pompiers b6n6voles ou mixtes.-
comparaisons e n t r e les d6penses d e s s e r v i c e s d ' i n c e n d i e e t d ' a u t r e s p a r a m s t r e s connus.-
nombre d e sapeurs-pompiers q u i peuvent B t r e employ& compte tenu d e s sommes a l l o u 6 e s .-
e s t i m a t i o n du c o a t b r u t d'un i n c e n d i e e n f o n c t i o n d e l a p o p u l a t i o n et du t y p e d e s e r v i c e d ' i n c e n d i e .-
c o m p a r a i s o n s d e c o a t s e n t r e d e s g r o u p e s d e s e r v i c e s d ' i n c e n d i e c l a s s e s s e l o n d i v e r s a t t r i b u t s .On y pr'esente finalemerit unq s + i e d e c o n c l u s i o n s a v e c c e r t a i n e s r d s e r v e s e t un hlstogrammb d e l a r6mun'eration d e s sapeurs-pompiers bdn6voles.
Urban Analysis, 1983, Vol. 7. pp. 169-210 0091-1909/83/07024169$18.50/0
@ 1983 Gordon and Breach, Science Publishers, Inc. Printed in the United States of America
FIRE COST CONTROL IN CANADA
G. WILLIAMS-LEIRResearch Officer, Fim Research Section, Division of Building Reseamh, National Re- search Council of Canada, Ottawa, K 1A OR6 Canada
(Received October 1982)
This account supplements the Report of the Study on Fire Prevention and Control Systems in Canada (Switzer and Baird, 1980), and analyzes the replies to the ques- tionnaire distributed in connection with that Study. It investigates the characteristics that distinguish municipal councils maintaining fulltime fire departments from those that choose volunteer or composite departments. Comparisons are provided between fire department expenditures and other known parameters. The number of firefghters who can be employed for a given expenditure is also noted.
The gross cost of fire is tabulated in relation to population and type of fue depart- ment. A series of cost comparisons is made between groups of fire departments clas- sified by a variety of attributes. A series of tentative inferences is shown, with qualifi- cations. The pay rates of volunteer firefighters are presented as a histogram.
INTRODUCTION
In 1978 a team comprised of R.A.W. Switzer, the recently-retired Dominion Fire Commissioner, and D. M. Baird of the Insurers' Advisory Organization, was appointed by the National Research Council of Canada to conduct a Study on Fire Prevention and Control Systems in Canada. A questionnaire was one of the techniques used to gain information for this Study. It was distributed to fire chiefs in nine provinces and two territories and was re- turned by over 1000 of them. Numerous facts derived from tabulation of the responses are included in the Study report; this by no means exhausts the useful information derivable from them. Much of the analysis calls for interpretation which is, in some cases, speculative and there is some merit
170 G . WILLIAMS-LEIR
in separating such studies from the Report proper. It would be regrettable, however, if the analyses were not made accessible to those to whom they might be of interest, hence this paper.
Some of the subject matter relates to the cost of maintaining a fire department (FD) and to the value of the services it provides. This may perhaps be of use to municipal councils (MC) faced with decisions on whether to change from volunteers to fulltime firefighters. It shows that, in many environments in Canada, one or the other of these two is the only choice.
This study is not intended to be a complete investigation of the subject. It reveals the relation between certain of the responses to the question- naire, and nothing more; in some cases further investigation could be ex- pected to explain these relations. Many of the indications are no more than speculative.
ADEQUACY OF RESPONSES
The bulk of the 1008 responses came from volunteer FDs; 61 were from fulltime FDs and 53 from composite FDs (these terms are defined in the next section). Thirteen thousand, two hundred fulltime and 22,900 volun- teer firefighters serve in these FDs; the jurisdiction of the fulltime FDs has a population of 7.8 million, that of the composites 1.7 million and the vol- unteers 3.6 million, a total of 13.1 million, well over half the country's population.
In general, the respondents appear to have answered the questionnaire carefully and the great majority of the responses appear to be valid. There were, however, some obvious inconsistencies. In the analyses such cases were treated as "no reply" and left out of subsequent analysis, except where the intentions of the respondent seemed to be clear.
For convenience, the following definitions will be adopted:
Expenditure: The total amount of the annual operating and capital expenditure of an FD, plus 10 per cent interest on the value of inventory: i.e., the money deliberately spent for no other purpose than to control fire loss.
FIRE COST CONTROL IN CANADA 171 Losses: The FD's estimates of property loss, lives lost and businesses closed down or relocated as the result of a fire. Information on other cate- gories of loss, e.g., injuries, was not requested in the questionnaire.
Community Loss: To make it possible to present a single figure instead of three as a measure of relative magnitude of loss, $200,000 for each life and $1,000,000 for each business was added to the stated property loss. Because the estimate in the questionnaire of businesses lost is for 1974-78, the responses have been divided by 5 to obtain an annual figure for use in this calculation.
It is unnecessary to justify the precise choice of the sums of money used in this definition as their only purpose is, as stated, to give a measure of relative magnitudes of loss. Other reasonable but quite different figures, if substituted, would be unlikely to alter the principal inferences to be de- rived from comparisons of the totals.
Gross cost of fire: Total of expenditure and community loss.
Volunteer
fire
department: Any department having fewer than 10 full-time staff.
Fulltime fire department: Any department with more than five times as many fulltime staff as volunteers.
Composite fire department: Any department excluded by the two pre- vious definition~.
Effective firefighters, or effective strength: The number of effective firefighters is arbitrarily defined as the number of fulltime staff plus one- fifth of the number of volunteers.
Dense: Refers to volunteer FD's where the population density exceeds 100 per sq. mile.
Sparse: Refers to volunteer FD's where the population density is less than 100 per sq. mile.
OPTIMAL EXPENDITURE ON FIRE PROTECTION
This paper would be of more value if it could address the question of whether the optimal amount is being spent on fire protection. This is not possible, however, because experiment is excluded; so precise definition of
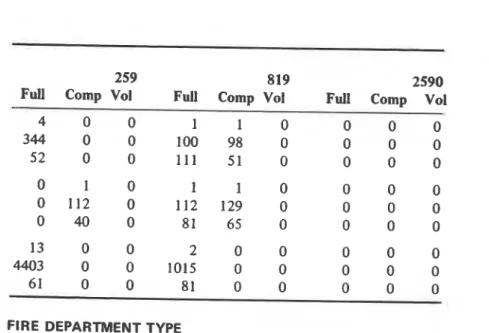
172 G . WILLIAMS-LEIR TABLE 1
Population and Area Both Influence Choice of FD Type (FD'S = Number of FD's; POP = Population, Thousands; GCPH = Gross Cost, $ per Head)
FD Area (Sq
.
km) To:-
26
FD TYPE: Full Comp Vol Full Comp
Population (Thousands) To:-
FD'S 1 0 216 0 1 10.0 POP 1 0 549 0 9 GCPH 82 1 0 81 0 73 FD'S 2 4 9 0 1 13.3 POP 21 46 98 0 13 GCPH 108 120 59 0 61 FD'S 2 4 3 2 3 17.8 POP 31 61 46 30 45 GCPH 46 127 72 79 69 FD'S 3 2 3 0 1 23.7 POP 58 40 60 0 18 GCPH 92 64 40 0 193 FD'S 2 3 0 1 1 31.6 POP 53 75 0 31 27 GCPH 72 94 0 53 13 FD'S 2 1 1 5 0 42.2 POP 74 33 35 184 0 GCPH 63 81 0 76 0 FD'S 0 0 0 4 0 56.2 POP 0 0 0 206 0 GCPH 0 0 . 0 70 0 FD'S 1 0 0 4 0 75.0 POP 7 1 0 0 273 0 GCPH 98 0 0 63- 0 82 Vol
FIRE COST CONTROL IN CANADA
259 819 2590
Full
Comp VolFull
Comp VolFull
Comp Vol3 3 0 1 2 0 0 1 0
208 199 0 68 129 0 0 60 0
101 89 0 48 64 0 0 50 0
G . WILLIAMS-LEIR
TABLE I (continued) I
FD Area (Sq. km) To:-
26 82
FD TYPE: Full Comp Vol Full Comp Vol
FD'S 0 0 0 0 1 I 100 POP 0 0 0 0 76 76 GCPH 0 0 0 0 46 5 FD'S 1 0 0 1 0 0 133
POP
102 0 0 117 0 0 GCPH 40 0 0 96 0 0 FD'S 1 0 0 0 0 0 over POP 141 0 0 0 0 0 GCPH 49 0 0 0 0 0"optimal" is unnecessary. Both losses and deliberate expenditures range widely from one FD to another even when population and area are the same. There is no way of knowing how one depends on the other in a given jurisdiction.
Consequently, this paper is limited to presenting how reported losses
1
and costs vary with the reported characteristics of the FD's territory.The study could have indicated where the total was high relative to the ! average, but cannot infer that such jurisdictions are high-risk ones, be-
cause the estimate of losses is for oniy one year, and in all but the larg- est cities the random variation from year to year would probably be enough to invalidate such inferences.
I
i
In spite of these limitations, the study has yielded information that
will be of interest to any MC reviewing its policy on fire protection.
1
;
This information will, however, have to take the form "Expenditure on
activity A is greaterjless than in the average of comparable areas" rather I than the more useful form "expenditure is greaterlless than optimal."
If one believes that, owing to experience and good judgment in the country as a whole, the over-all expenditure is optimal, and that the hazards of the locality under consideration are near average, then the foregoing statements in quotations may be thought of as equivalent to
one another; but these are hypotheses that the data collected cannot be used to test.
FIRE COST CONTROL IN CANADA
259 819 2590
i
Full Comp Vol Full Comp Vol Full Comp Vol4 0 0 1 1 0 0 0 0
344 0 0 100 98 0 0 0 0
52 0 0 1 1 1 51 0 0 0 0
FIRE DEPARTMENT TYPE
Possibly the first question an
MC
should consider is how much ought to I be spent on fire protection. But before discussing this question the council would have to decide whether a volunteer or fulltime FD was appropriate, or whether theMC
should compromise on a composite department.Table I shows how the three types of FD are distributed in relation t o population and area; gross costs per head are also shown. Pjgure I presents the same information in another way, without costs. As might
I be expected, large areas with small populations are generally served by
volunteer departments, and large populations by fulltime departments. A
more precise statement, ignoring minor irregularities in the table, is: Municipalities smaller than 32 sq miles (8200 hectares) generally have volunteer departments for a population of up to 18,000, fulltirne depart- ments for over 32,000, and composite departments for populations in- between. For municipalities between 32 and 100 sq miles (8200 to
25,900 hectares), the same changeovers occur at populations of 18,000 and 56,000. Over 100 sq miles (25,900 hectares) they occur at 42,000 and 100,000.
G . WILLIAMS-LEIR
LEGEND
O = F u l l t i m e F D ' s A C o m p o s i t e F D ' s + = V o l u n t e e r F D ' s PopulationFIRE COST CONTROL IN CANADA
I
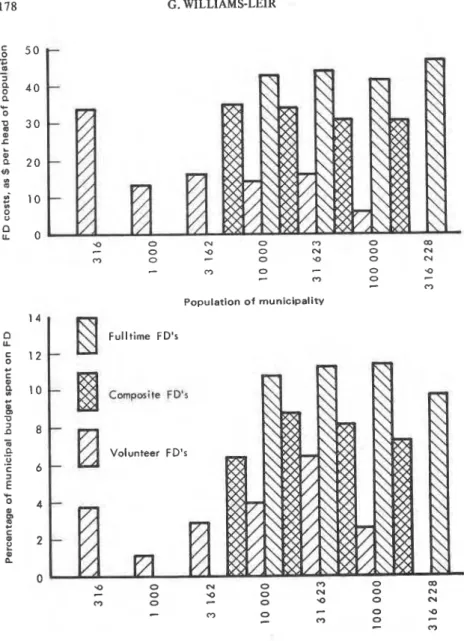
FIRE DEPARTMENT COSTSTo return to the question: How much should be spent overall on fire protection? Or, rather: How much would an "average MC" spend? This is obviously dependent on their total budget. Figure 2 presents the pro- portion of total budget that is spent on fire protection as a function of population, and the sum in dollars per head, again as a function of popu- lation.
The results can be summarized briefly. Fulltime fire departments gen- erally cost between $40 and $50 per head of population per year and between 9 and 12 per cent of the municipal budget. Composite FD's cost between $30 and $35 per head or 6 to 9 per cent. Volunteer FD's cost $5 to $35 per head or 1 to 7 per cent.
Thus the MC can calculate two estimates of FD cost, one from its own budget, the other based on population. In addition, a third (and probably better) estimate can be obtained from one of the following re- gression formulae, if the necessary information is available. (Note: OPCAP
= total of operating
+
capital costs in dollars.)a) For fulltime fire departments: OPCAP = 23.78 X population
+
I 0.014 X municipal budget
+
0.785 X property loss+
390 X firecalls (excluding false alarms and calls for services other than fire- fighting).
I
b) For composite fire departments: OPCAP = 26.94 X population t 534 X fire calls.c) For volunteer fire departments: OPCAP = 2145
+
5.14 X popula- tion+
11937 X life loss+
629 X fire calls.These equations were chosen from among many others as being most in accordance with common sense. A caveat has to be attached to the predictions, however, because of the incompleteness and wide variability
I of the data, especially in the case of volunteer FD's. As all the regres-
sions were weighted by population, they will be most accurate for the largest units. An idea of their reliability may be conveyed as follows. The prediction is within a factor two of the actual costs, i.e., between half and double, for 47 out of 49 fulltime FD's. (Thk remaining two in- clude 1.49 per cent of the population served by these fulltime FD's.) The prediciton is within a factor two for 48 out of 51 composite FD's.
G . WILLIAMS-LEIR I 178 C, 5 0
.-
4--
J 8 40 a-
0 1 30 m s L 0 a 20 te U)t
l o 0 n u. 0-
0 Q 0 N 0 N 0 0-
0 Q 0 N-
0 0-
-
0 '4 0 0-
-
C) Population of municipality Fulltime FD's Volunteer FD's j '4 0 N 0 0 0 OD-
0 '4 0 N 0 N C? 0-
0 '4 0 N 7 C) 0-
-
0 -Q C? 0 7 7 0 Population of municipalityFIGURE 2. Fire department operating and capital cost in relation to population and municipal budget.
FlRE COST CONTROL IN CANADA
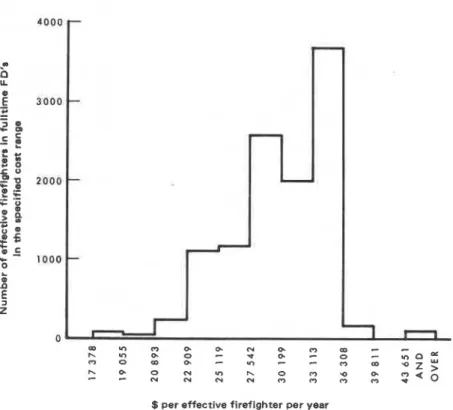
$ per effective firefighter per year
FIGURE 3. Operations and capital cost of a fulltime fire department in 1978. (The remaining three include 6.5 per cent of the population served by these composite FD's.) The prediction is within a factor two for 5 1 out of 8 0 volunteer FD's. (The remaining 29 include 22 per cent of the population served by these volunteer FD's.)
I
FIRE DEPARTMENT PERSONNELI
Given the type of FD and the estimate of funds needed, the "average MC" is now ready to calculate how many firefighters it can afford to hire. The required information is in Figures 3 and 4, which show thei
ratio of operating plus capital costs to the number of effective firefight- ers. The range is much wider for the volunteers.A regression analysis relating operating plus capital costs of FD's to the numbers of each kind of firefighter reveals that the costs may be
G . WILLIAMS-LEIR
$ per effective firefighter per year
FIGURE 4. Operating and capital cost of a volunteer fire department in 1978 unteer. This of course includes equipment, accommodation and other overhead expenses in addition to the firefighters' pay.
This completes the analysis of information on expenditure by MC's for FD's except to add that all figures relate to 1978, and some allow- ance should be made for inflation.
GROSS COST O F FIRE
So far only the deliberate expenditure for combating fire has been dealt with.
FIRE COST CONTROL IN CANADA
I
Population of areaI
FIGURE 5. Gross cost o f fire by population and FD typeTo arrive closer to the gross cost of fire the property loss must be added: an allowance must be made related to the number of lives and businesses lost; and interest on the capital tied up in FD inventory must be added (10 per cent has been taken as a conservative rate).
The results (Figure 5) show that the gross cost of fire in areas served
by small volunteer FD's ranges from over $150 per head of population down to $35 for the largest volunteer FD. The variation for fulltime FD's is in the same direction, but the range is much narrower, from $75 to $60 per head. Composite FD's are associated with gross costs $145 to
I
$50 per head. In areas of comparable population, composite FD's cost about the same as fulltime, and much more than volunteer FD's.
I It should be mentioned that we are dealing with totals and averages
I that conceal a remarkable diversity in costs. There are 41 FD areas with
costs exceeding $300 per head of population; all but 3 were volunteer departments; there are some others costing less than $1 per head. The diversity between different types of FD is best illustrated by Table I1 in which the average values of 18 key parameters are presented.
G . WILLIAMS-LEIR
-
g
$
=
m 0 0 ; p. .- + a u 7 -A 2 h ..5 r c u + w a: k m uP-2
g
E L -
. c 2 $2-
-
il m* =
.-g e E
z b wFIRE COST CONTROL IN CANADA 183 Supposing a hypothetical average MC was looking for advice on how to set up an FD, the information so far supplied would help it to decide what funds to allocate, and how many firefighters to hire. There would then be numerous questions of policy to decide; the questionnaire an- swers cast light on some of these matters, though clear leads are uncom- mon. Some thought should, however, be given to the purpose of the exercise before pursuing this subject.
I
OBJECTIVES OF FIRE PROTECTION
Those controlling expenditure should be governed by two considera- tions. Firstly, the purpose of expenditures on fire protection is to reduce loss of life, prevent injuries and dislocations of businesses, and limit property damage. The second consideration is to do all this at the least possible expense.
If both losses and costs reduce, this is clearly success. If losses reduce but costs d o not change, this is still considered success because it is bet- ter to spend money on staff and facilities for fire protection than on compensating the victims of fire. If losses remain steady while costs rise, this constitutes failure. The question "at what point does success turn into failure" is subjective; it will be discussed further, with an example, later.
i
COST COMPARISONS: METHOD AND QUALIFICATIONSWhat follows is a hypothetical example to illustrate an important point. Suppose that in certain areas fire hydrants are painted red and in others yellow. It would be possible to add up the gross cost of fire in all the red and yellow areas separately, and to do the same for the popula- tion, divide cost by population, and report that for one color the cost rate was x dollars per head, and for the other y. It is unlikely that x and y would be exactly equal. The point of this example is that it would not be correct to infer that the difference in cost was a direct conse- quence of the different color, and that when repainting became neces- sary all hydrants should be repainted in the apparently more successful color. However, it would be correct to infer, if the difference was signi- ficant and other influences were random, that some characteristic of the
184 G . WILLIAMS-LEIR
areas of those FD's that chose one color over the other was correlated with more efficient performance or less severe hazards. For this example, a question was deliberately chosen that was not asked in the question- naire, but the same line of reasoning applies to many questions that were asked.
COST COMPARISONS A
Table 111 presents the responses to 29 questions that called for a choice between two or more alternative answers. The correlated population, loss and cost are given.
It should be noted that, where the population related to a given re- sponse is small, random effects can produce loss and cost rates that are much higher or lower than the average; in such cases the apparent impli- cation is often unreliable. For example, on Item 9 , Question 66, re- sponses 1 and 4 related to about 2 per cent, a small fraction of the total population, so that only responses 2 and 3 need be taken seriously. Be- tween these the difference in cost is not significant, so the inference is that a 42-hour working week is associated with slightly lower losses than a 40-hour week. and with little difference in cost.
Some Special Points
Evidently all fulltime firefighters in the fulltime departments that re- sponded are members of a trade union, (Item 6).
It may be that the areas that do more frequent inspections do so be- cause the local hazards or loss records are perceived as higher than aver- age. These results may be compared with Figure 6 in Section B, which relates loss rates to inspections per head of population, and with Figure
16, which deals with training of inspectors, (Items 24, 25).
COST COMPARISONS
B
The purpose of this section is to examine the correlation between each of 14 different attributes of an FD or of the jurisdiction supporting it, and the losses from fire within the jurisdiction and the costs of the FD.
I:IRI COST CONTROL IN CANADA
TABLE
I11Costs Related to Responses to 29 Questions
Include this Community Loss Gross Cost FD's Giving Population: Per Head Per llcad this rcsponsc: (Millions) ($ Yearly) (S Yearly)
- -
-
..-
--
,-I. Question No.: 1 Province
1 B.C. 1.865 36.36 76.99 2 ALTA 1.588 34.86 82.52 3 SASK 0.590 35.74 72.47 4 MAN 0.977 32.57 62.32 5 ONT 6.159 27.20 63.34 7 N.B. 0.263 54.24 100.05 8 N.S. 0.591 28.65 58.23 9 PI1 0.045 42.59 53.45 10 NFLD 0.149 50.50 72.04 11 YUKON 0.019 1 12.56 152.89 12 NWT 0.023 83.55 115.14
2. Question No.: 2 Municipality Class
1 City 8.708 23.14 67.37 2 Rural M. 1.169 44.66 66.38 3 Town 1.797 52.34 72.58 4 L.I.D. 0.111 67.04 94.7 5 5 Village 0.319 87.21 105.00 6 County 0.174 3 1.29 53.69
3. Question No.: 5 Are There Hydrants?
1 Yes 11.817 30.83 69.01
2 No 0.417 53.41 72.23
4. Question No.: 28 Is the FD the Plimary Occupation of the Chief!
1 Yes 10.432 27.02 68.10
2 No 1.833 57.98 74.77
5. Question No.: 37 Volunteer FD's only: The Chief is appointed by:
I M. Council 3.525 4 7.90 72.56
2 Volunteers 0.748 53.42 71.57
3 Otherwise 0.227 47.57 70.91
6. through 10. Apply only to Full-Time FD's.
6. Question No.: 61 Are Firefighters Unionized?
1 Yes 9.317 24.45 68.14
7. Question No.: 64 What part does the Chief take in Union negotiations?
1 Active 1.324 32.87 77.28
2 Advisory 7.680 21.40 65.31
3 Not involved 0.418 50.09 86.05
186 G. WILLIAMS-LEIR
TABLE 111 (continued)
Include this Community Loss Gmss Cost
F.D's Giving Population: Per Head Per Head
this response: (Millions) ($ Yearly (9 Yearly)
8. Question No.: 65 Is There a Union Management Committee?
1 Yes 6.799 22.12 68.37
2 No 2.06 1 34.94 72.87
9. Question No.: 66 Shift Firefighter's Average Work Week
1 Less than 40 H 0.033 44.99 81.37
2 4 0 H 0.655 29.5 2 70.56
3 4 2 H 8.5 20 24.21 68.21
5 4 8 H 0.214 8.01 45.74
10. Question No.: 67 Normal Shift Length
1 8 H 0.103 39.10 69.70
2 10 & 14 H 8.865 24.5 1 68.40
3 2 4 H 0.437 16.83 58.55
4 Other 0.016 4.47 40.07
11. Question No.: 68 Composite FD's only: Do Full-Timers work days, Volunteer's nights?
1 Yes 0.040 35.33 81.18
2 No 1.586 34.95 69.65
12. through 15. Apply only t o Volunteer FD's
12. Question No.: 85 Payment Mode
1 Hourly 2.4 25 47.24 7 1.90 2 Per Call 0.292 55.21 77.18 3 Annual 0.538 40 .OO 61.89 4 By Points 0.431 69.30 100.08 5 Other 0.206 40.44 63.03 6 None 0.326 48.56 65.95
13. Question No.: 87 Call-Out Mode
1 Pagers 2.717 41.08 65.49
2 Phones 0.932 68.79 91.54
3 Siren 0.535 59.55 78.21
4 Tap Bell 0.012 22.52 45.95
5 Other 0.260 33.14 6 1.39
14. Question No.: 89 Availability of Recruits
1 Excellent 0.340 44.59 67.84
2 Good 1.921 45.74 71.08
3 Fair 1.669 50.97 73.31
4 Poor 0.429 54.98 74.49
15. Question No.: 90 Attendance at Fires and Training
1 Excellent 0.794 54.71 75.84
2 Good 2.751 44.91 69.01
3 Fair 0.793 58.36 82.29
FIRE COST CONTROL IN CANADA 187
TABLE 111 (continued)
Include this Community Loss Gross Cost
FD's Giving Population Per Head Per Head
this response: (Millions) ($ Yearly) ($ y e d ~ )
15. Question No.: 1 Excellent 2 Good 3 Fair I 4 Poor 16. Question No.: 1 IFSTA 2 Provincial 3 Own 4 Another FD's 5 None 6 Other 17. Question No.: 1 F u l l - T i e
!
2 Part-Time Chief 3 Other Officer 4 Shift Officer 5 Volunteer officer 6 None 18. Question No.:1 Own drill tower
I 2 Another FD's 3 Fire Station 4 None 19. Question No.: 1 Less than 2 2 2 3 3 4 4-5 5 More than 5 I 1 20. Question No.: 1 Yes 2 No 21. Question No.: 1 FD 2 FM-FC 3 Shared 4 Not Regular 5 Other 6 None
90 Attendance at Fires and Training
0.794 54.71 75.84
2.75 1 44.91 69.01
0.793 58.36 82.29
0.033 31.76 35.42
91 Training Manual Used
4.870 34.22 68.85 0.755 68.83 98.90 5.923 21.85 64.29 0.105 88.27 108.60 0.289 66.86 80.29 0.295 32.33 66.53 92 Type of Instructor 8.098 23.30 67.52 0.826 54.18 75.44 0.926 48.64 73.54 0.888 3:.61 68.60 1.161 54.61 72.13 0.359 49.64 70.4 1 93 Training Facilitie; 7.297 22.29 67.48 0.178 25.37 44.4 1 4.651 45.69 72.22 0.132 6 1.34 82.30
104 Number of Weeks of Training
1.112 58.11 82.24
0.743 36.60 78.34
0.561 50.92 89.02
2.513 20.94 60.84
5.327 21.71 67.16
105 Composite FD's only: Are Recruits always previous Volunteers?
0.509 49.87 84.07
1.136 30.47 65.58
106 Fire Prevention Program is run by:
9.907 27.62 68.16 0.426 75.61 88.14 0.996 38.75 67.92 0.511 53.20 72.67 0.077 20.26 33.68 0.142 55.15 70.7 1 continued
188 C. WILLIAMS-LEIR
TABLE I11 (continued)
Include this Community Loss Gross Cost FD's Giving Population Per Head Per Head this response: (Millions) ($Yearly) ($ Yearly)
22. Question No.: 124 Written Orders on Violations?
1 Yes 10.909 29.26 68.53
2 No 0.501 62.56 81.16
23. Question No.: 125 Automatic Follow-up?
1 Yes 11.002 29.5 3 68.52
2 No 0.438 65.37 85.01
24. Question No.: 126 Dwellings Inspected per Year
1 up to 25% 7.6 80 32.92 70.18
2 26-50% 1.584 18.45 61.14
3 51-75% 0.685 23.26 66.81
4 over 75% 0.138 43.53 78.19
5 None 1.334 41.22 77.24
25. Question No.: 127 Non-Residential Inspections
1 Selective 2.117 36.80 72.76 2 Not Regular 1.560 54.61 87.41 3 6-Monthly 1.374 29.28 68.65 4 Annually 3.826 30.19 7 1.26 5 2-Yearly 1.749 18.15 58.90 6 Longer intervals 0.938 1 1.97 45.92
26. Question No.: 224 Volunteer FD's: Location of Alarm Receipt
1 Own Station 2.247 42.10 72.47 2 Another FD 0.293 42.18 64.59 3 MuniC.C. 0.158 4 2.04 65.51 4 24-Hr Ind-lnst 0.299 60.18 75.16 5 Police Station 0.299 38.22 48.71 6 Answering service 0.210 47.95 62.47 7 FF's Homes 0.860 68.44 85 .O 1 8 Other 0.127 52.39 70.39
27. Question No.: 226 Automatic Alann Service
1 Yes 10.024 28.14 68.67
2 No 1.719 57.60 77.44
28. Question No.: 245 Chiefs Assessment of FP Program
1 Very Good 3.634 24.71 70.44
2 Good 4.955 30.00 65.38
3 Fair 3.208 39.15 72.17
4 Poor 0.433 49.58 73.24
29. Fire Department Type (Questions 23 and 24)
1 Unspecified 0.038 99.31 113.13
2 Full-Time 7.777 21.71 67.19
3 Composite 1.645 36.47 7 1.30
FIRE COST CONTROL IN CANADA 189 graphs (see Figures 7 to 24) have been plotted for each of four types of FD: full time, composite, volunteer FD's Serving populations exceeding 100 per square mile ("dense VFD's"), and the remaining volunteer FD's ("sparse VFD's"). The octagonal symbol used to represent each FD on the graphs is drawn proportional in area to the population served.
To avoid unduly small scales and consequent congestion of the graphs, the scales have been so chosen that extreme values can be shown only at the limits of the scales. This effect will be noticed in, for example, Fig- ure 9.
With 14 attributes and four FD types, there are potentially 56 plots to present. In actual fact it is necessary to present only one-third of these, as will be explained.
"REDEPLOY?"
! A minority of the 56 graphs (see Figures 6 to 23) convey a message that will be categorized as "Redeploy?." These will be discussed first, and then the majority, categorized as "Status Quo."
In these figures the broken curve represents the apparent trend of losses, while the solid curve relates to costs. The ktter is calculated from the points shown.
When both lines trend downward, they identify a parameter that could, at least in principle, be altered with advantage, especially if the trend can be clearly seen in the distribution of the points. (Upward, not downward, applies in the case of the parameter "mean age of apparatus.") To repeat the caveat above, all that can be firmly stated is that, on the average, some characteristic of the administrations that devote more re- sources to a particular service is associated with more efficient perform- ance or less severe hazards. For instance, the curves suggest that losses and costs can be reduced by:
a) increasing fire prevention inspections in fulltime FD's (Figure 6), b) increasing municpal building inspection budgets, where there are
composite FD's (Figure 7),
c) increasing the ratio of budget to number of apparatus in both full- time and sparse volunteer FD's (Figures 8 and 9),
d) reducing the mean age of apparatus in composite and volunteer FD's (both dense and sparse) (Figures 10, 1 1 and 12),
I
Gross cost. $ per head Per Year
I
0
.
rn
Gross cost, $ per head Per year
0 20 40 60 M 100 120 140 1W 200 0, 0 0 4 a 0 0
P
0 0 0 0 0 0i,
0
0
09 u 0 = ? ?-
0 'dI3T-SWVITTIM '3FIRE COST CONTROL IN CANADA 191 3
0
0
00
0-8
0.s
C 0*
80 0 O . 0 0 I 3 s I f 0s. cm 0 0 oa 09 09 0, 02 D.~Ow
=
G . WILLIAMS-LEIR
FlRE COST CONTROL IN CANADA 193
Mean age of apparatus, yean
FIGURE 12. Costs in relation to age o f apparatus used by sparse volunteer FDs.
e) increasing the ratio of inventory to number of apparatus in full- time, composite and sparse volunteer FD's (Figures 13, 14 and
1%
f) giving fire prevention inspectors more training in composite FD's
Figure 16),
g) giving officers more administrative training in composite and volunteer FD's (Figures 17, 18 and 19), and
h) paying a higher rate in sparse volunteer
FD's
(Figure 20).When studying the graph of FD budget per apparatus in fulltime FD's (Figure 8), note that for all the FD's serving larger populations, the budget exceeds $400,000 per apparatus, while most of those serving smaller populations spend less. This invites the speculation that it is not
Gross cost, $ per head Per year
=
r
w
Gross cost, $ per head per year
0 j
FIRE COST CONTROL IN CANADA 195
0
4 0.-
0 0;
C C >O O
'C 0 'C 0 -Q ca .- 0 0 0 0.-
C I 0 to ~ m w w o a o m m w m m oreaA l a d peal( l a d $ 'isoa SSOJE)
0 1
w z ~ m z m o m m o ~ K k ~ w ~ ~ o
G . WILLIAMS-LEIR L e
a
::
2 P 0 0 ,' 0 0 0 0 0 43,' 0 E 1 yoz
m r o n m o a m m m w ~ oFIRE COST CONTROL IN CANADA
0
I
O ) E a Z D ( a r n
198 G. WILLIAMS-LEIR
heavy expenditure, but rather urbanization, that is connected with the better results.
Superficially, (c), (d) and (e) suggest that a FD's performance would be improved by scrapping obsolete equipment. More precisely, the inference is that relatively high losses and elderly equipment in reserve tend to be found in the same FDs.
Where the broken line trends down as the solid line goes up, as in Figure 21, the inference is that a judgment has to be made. This will be illustrated for the case of FD expenditure in sparsely populated volun- teer FD areas:
Increasing expenditure from say zero to $25 per head of population per year appears to be associated with a reduction of losses from around $75 to $60. The judgment required is whether the community wishes to spend $25 in order to save $15. The argument for the negative reply is obviously that this course results in a net extra cost of $10. It might, however, be reasonably argued for the positive reply that we would rather spend $25 on hiring firefighters, who might otherwise be unem- ployed and dependent on the community, than spend $15 on replacing losses and compensating the victims of fire.
Similar but weaker indications apply in two cases: a) FD expenditure in composite FD's (Figure 22).
b) Municipal building inspection budget in fulltime FD's (Figure 23).
"STATUS Q U O
As remarked earlier, many of the graphs do not fall in the "Redeploy?" category. Either the curves are too level to support any inference, or they have an upward trend, for example Figure 24.
The inference that can be drawn in this case and in similar ones is that, apparently, the FD's and those who regulate them have, on the average, distributed their resources, not necessarily in the best way possible, but at least so that, wherever the needs are greater, the re- sources applied are also greater. If changes need to be made this analysis fails to reveal them. The evidence thus justifies the "Status Quo."
This being the case, there is little need to present the upward-trending graphs in this report, and thus encourage complacency. All 14 analyses have, however, been carried out for each of the four categories of FD,
FIRE COST CONTROL IN CANADA 199
1
~ ~ ~ W m o a w w m ~ o
JaeA l e d pearl l a d $ '%SO3 SO19
0
0
G. WILLIAMS-LEIR -8 0,
s
0 0 t :: 9) -8y
.$ a x .2 0-s
5
-
-
% .--
8
E .5 0 "I 0 -&5
-
f
2
I D 3 m A W om m rn m PZ 0JeeA Jad peey l e d $ 'is03 s o ~ g
0
0"
E Ci .q 0 r 8 Q 0, .53
-* G g S 0 3 e -+ .q 0 0 -n .C- "I U '2 0 0 e I OPL m oa om OP W c+ OL JeeA l e d peey l e d $ '1003 S S O l gI
FIRE COST CONTROL IN CANADA
and if the result is not presented among the "Redeploy?" figures, it may be taken that the message is "Status Quo." As mentioned, Figure 24 provides an example of the latter category.
The following parameters were found to lie in the "Status Quo" cate- gory for all four types of FD, and consequently are not represented among the graphs chosen for publication:
Fire dept. strength per head of population, Number of stations per head of population, Number of apparatus per head of population, Fire prevention budget per head of population, and Volunteer training, hours per month.
RELIABILITY OF FIGURES 6-25
Some comnient is needed on the reliability of the curves presented, which represent weighted polynomial regressions. The author has decided not to present statistical statements on this subject, on the grounds that for most readers of this report there is another approach that will be more convincing. Each reader should examine the plots, and assess for himself to what extent the solid curves are supported by the points, bearing in mind that the size of the symbol centered on each point is proportional to the population served by each FD, and that the points to which the dashed curve relates are not shown.
It will be seen that:
a) where there is a clear trend in the center of each graph, the solid line follows it.
b) on the extreme left and right of each graph, there are often only a few small points, and these may cause the line to wander. For this reason, the line is not continued to the edge of the graph.
A small proportion of the information received must be assumed t o be in error and it is sometimes hard to distinguish these cases from random variations. Consequently it would be unwise to place reliance on trends that are strongly influenced by a small number of points, e.g., in
202 G. WILLIAMS-LEIR
Figure 17, where a single composite department that gives its officers 50 days' administrative training per year was unlucky and reported high losses. The upward tendency at the right hand end of the curve in Figure 17 should, therefore, be disregarded.
SEPARATING THE EFFECTS
In the five preceding sections, the effect of a number of variables on
I
losses and costs is studied individually, without regard for the effect onother variables. It is possible that where an apparent effect is observed, it is actually due to another variable that is correlated with the first. It would be desirable t o separate the effects and distinguish which variables are the best predictors, but to d o so demands more sophisticated statisti- cal methods, which inevitably are more sensitive to accuracy of the data. Multiple regression analysis depends on the correct choice of models, which it may or may not be possible to validate. The model that has been tried was:
where y is the logarithm of gross cost per head, and x l through Xi6 are the logarithms of each of the first sixteen parameters listed in Table 11.
This model has had limited success. There are indications that, col- lectively, volunteer FDs need extra firefighters more than they need extra apparatus; but in general the results of this approach have done little more than support the judgment of the councils and fire chiefs who have determined policy; they tend to justify the status quo, in the sense in which this phrase has been used in previous sections. It appears that differences in the allocation of resources to fire protection are the result rather than the cause of variations in the loss rate.
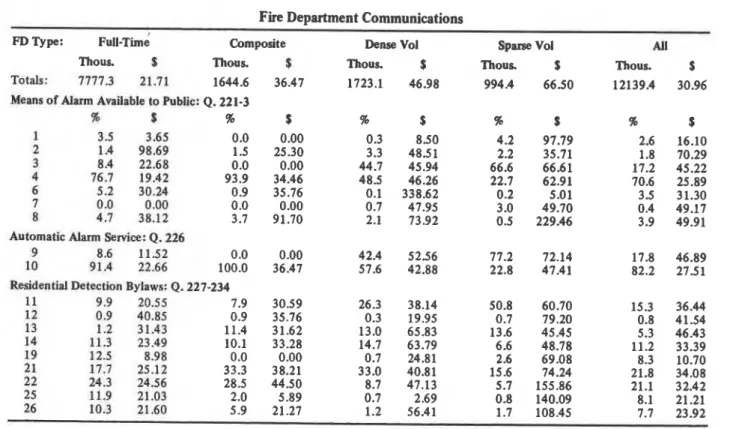
FIRE DEPARTMENT COMMUNICATIONS
On pages 18 and 19 of the questionnaire (see Appendix A) there is a series of questions dealing with how FD's are called to a fire. The an- swers to questions 221 t o 223, 226 and 227 to 234 are analyzed in Table IV, which should be studied in conjunction with the following explanations.
FIRE COST CONTROL IN CANADA 203
The first line of numbers, "TOTALS," includes the populations and losses per head for each of four classes of FD and for all together. The top right corner, for instance, tells us that the 12 million people covered by the table had an over-all loss per head of $31 for the year. In each line after the first, the pairs of numbers comprise a percentage of the population, as stated at the head of the column, and a loss per head for the category, which may be compared with the figure at the top. Where the number in the tenth column would be less than 0.3 per cent, the entire line is omitted.
The principal message of the first 8 numbered lines, representing ques- tions 221 to 223, is that 71 per cent of the population are linked to their FD's by telephone and by alarm systems in buildings but not by street boxes, and that this sector has a loss rate of $26, i.e., $5 below the over-all average. The pattern is not very different for the four groups of FD's; but for sparse volunteer FD's, 67 per cent of 994,000 people served are linked only by telephone and their losses are very slightly greater than those of the rest of the group.
Passing to lines 9 and 10 of the table (question 226), we find that 8 2 per cent in all groups live in areas where sprinkler alarms, etc., are trans- mitted direct to the FD's; their losses are $4 below the over-all average. Again it is only the sparse volunteer areas that depart radically from this pattern; 77 per cent are not so protected and their losses are $72, com- pared with $47 for those that are.
The analysis of questions 227 to 234, on legal requirements for resi- dential detection, in lines 11 to 26 of Table I V is similar.
Line 21 of the table shows that of 12 million, 22 per cent are required to have automatic detection if they live in new buildings, whether large or small, and their loss rate is $34, slightly over the general average. A further 21 per cent are so required if they live in new 1 or 2 family dwellings or any larger building ($32). In line 11, 15 per cent are exempt from such requirements, and their losses are $36. In sparse volunteer fire departments, the exempt proportion rises t o 51 per cent and the losses to $61, but otherwise the findings are not very different for the various types of FD.
Table V, whose format is similar to that of Table IV, shows that fire calls are received predominantly at a fire station and that, where this is so, the losses are $5 less than generally. An exception is in volunteer FD's, especially sparsely populated ones, where, for 47 per cent of the population, calls are received at firefighters' homes. Where this is so
TABLE
IV
N 0Fire
Department CommunicationsFT) Type: ~ull-~im= Composite Dense Vol Sparse Vol All
Thous. S Thous. S Thous. $ Thous. S Thous. S
Totals: 7777.3 21.71 1644.6 36.47 1723.1 46.98 994.4 66.50 12139.4 30.96
M w u of Alum Anilabla to Public: Q. 221-3
% S %
s
%s
% S % S 1 3.5 3.65 0.0 0.00 0.3 8.50 4.2 97.79 2.6 16.10 2 1.4 98.69 1.5 25.30 3.3 48.51 2.2 35.71 1.8 70.29 3 8.4 22.68 0.0 0.00 44.7 45.94 66.6 66.61 17.2 45.22*
4 76.7 19.42 93.9 34.46 48.5 46.26 22.7 62.91 70.6 25.893
6 5.2 30.24 0.9 35.76 0.1 338.62 0.2 5.01 3.5 31.30 7 0.0 0.00 0.0 0.00 0.7 47.95 3.0 49.70 0.4 49.17 8 4.7 38.12 3.7 91.70 2.1 73.92 0.5 229.46 3.9 49.91Auiomntic Alann Serrice: Q. 226
E
v
9 8.6 11.52 0.0 0.00 42.4 5 2 5 6 77.2 72.14 17.8 46.89 10 91.4 22.66 100.0 36.47 57.6 42.88 22.8 47.41 82.2 27.51
Residential Detection Bylaws: Q. 227-234
11 9.9 20.55 7.9 30.59 26.3 38.14 50.8 60.70 15.3 36.44 12 0.9 40.85 0.9 35.76 0.3 19.95 0.7 79.20 0.8 41.54 13 1.2 31.43 11.4 31.62 13.0 65.83 13.6 45.45 5.3 46.43 I4 11.3 23.49 10.1 33.28 14.7 63.79 6.6 48.78 11.2 33.39 19 12.5 8.98 0.0 0.00 0.7 24.81 2.6 69.08 8.3 10.70 2 1 17.7 25.12 33.3 38.21 33.0 40.81 15.6 74.24 21.8 34.08 22 24.3 2 4 5 6 28.5 44.50 8.7 47.13 5.7 155.86 21.1 32.42 25 11.9 21.03 2.0 5.89 0.7 2.69 0.8 140.09 8.1 21.21 26 10.3 21.60 5.9 21.27 1.2 56.41 1.7 108.45 7.7 23.92
KEY
Q. 221-3. Whar means are itveilable to the public for calling
the FYre Department?
1. None
2. Alarm systems In buildings connected to Fire Depart- ment.
3. Public telephone 4. 2 + 3
5. Street Alarm box system 6. S + 2
Q. 226. Are sprinkler alarms, etc., automaticdly m p
mitted to the Fire Department?
9 . No
10. Yes
Q. 227-234. In which buildings Ls jlw detection mandatory under local bylaws?
11. None
12. I n existing larger buildinp
13. I n new l a r ~ e r buildings
14. I n all larger buildings
I S . In existing 1-2 family dwellinp
16. 1 5 + 12 17. 1 5 4 13 15 + 14
In new 1-2 family dwellings
1 9 + 12 1 9 + 13 1 9 4 14
In all 1-2 family dwellings 2 3 + 12
2 3 + 1 3
2 3 + 14
A missing f i y means "less than 0.3 per cent o f total
TABLE
VFire Department Communications
--
FD Ty-pe: Full-Time Composite Dense Vol Sparse Vol All
Thous. $ Thous. $ Thous. $ Thous. $ Thous. $
Totals: 7503.7 22.36 1644.6 36.47 1721.8 47.00 987.4 65.90 118575 31.52
Q. 224: Where are Fire Alarms Received?
96 $ 96 $ % S % $ 96 $ 1 84.1 22.09 97.3 37.16 27.7 47.91 15.1 49.12 72.0 26.83 2 0.0 0.00 1.6 11.48 11.0 33.41 5.5 50.09 2.3 34.67 3 15.1 23.06 1.1 10.72 7.0 53.37 1.6 45.84 10.9 26.01 4 0.0 0.00 0.0 0.00 7.5 63.37 15.6 5450 2.4 58.54 5 0.7 39.02 0.0 0.00 14.5 37.29 4.6 45.95 3.0 38.69 6 0.0 0.00 0.0 0.00 9.0 44.08 4.9 64.99 1.7 49.09 7 0.0 0.00 0.0 0.00 19.2 52.32 47.3 80.68 6.7 68.94 8 0.0 0.00 0.0 0.00 4.1 52.51 5.3 56.01 1.0 54.01 KEY
1 . .At own fire- station 5 . At a police station
2 . At another Fire Department 6. Through a telephone answering service 3. At a municipal communications center 7. At homes o f firefighters
FIRE COST CONTROL IN CANADA 207
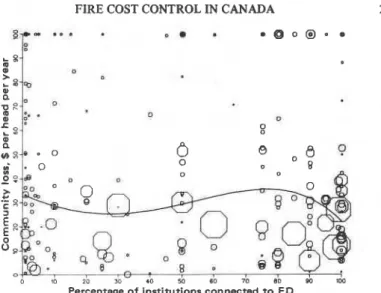
Percentage of institutions connected to FD
FIGURE 25. Losses in all classes of FD in relation to proportion o f institutional buildings with alarm systems connected direct to FDs
losses rise to $81 compared with $66 generally, and $49 where they are received at the station.
The responses to question 225 are presented in Figure 25. This shows the propostion of institutions whose fire alarm systems are directly con- nected to the FD, and the related losses. The area of the symbol is, again, proportional to the population served by each FD. The larger populations have from 25 to 100 per cent connected, and the smaller populations are well represented at both ends of the scale 1 t o 100 per cent. The associated losses where the proportion is low are a little less than those where it is high.
PAY RATES OF VOLUNTEER FIREFIGHTERS (VFF's) a) Method o f Payment By the hour Per call Annually On points In other ways Unpaid Total Number o f VFF's 9,039 1,709 1,757 1,860 763 4,153 19,281
208 G. WILLIAMS-LEIR
t
f 600 O'
400;:
, s 200
!:
28'
8 o UNDER 60 10.0 140 $ per 180 0year 220 zbo 300 340 0 ~ti 4000
-
*
3
9 - H o w t l y 1111. b 0 3000 ---P.r cm41 mu* s 8 C-
g
2000 w 3-
$ "- 0 1000-
5
5
-
z 0 UNDER 3 5 7 9 I 1 I3 15 17 19 21 6 OVER$ per hour OR per cell
FKWRE 26. Pay rates of volunteer firefmters
CONCLUSION
Only a part of the Questionnaire has been analyzed here for information; there is undoubtedly much more to be found. Readers with an interest in special aspects not covered here are invited to send their questions to the author at the address given on the Title page.
ACKNOWLEDGMENT
This paper is a contribution from the Division of Building Research, Na- tional Research Council of Canada and is published with the approval of the Director of the Division.
FIRE COST CONTROL IN CANADA 209
REFERENCE
Switzer, R. A. W. and D. M. Baud. Report of study on fire prevention and control systems in Canada. Ottawa. National Research Council, 1980 (NRCC 18586).
210 G. WILLIAMSLEIR
APPENDIX A
I
D. COMMUNICATIONS
1. Means Available for Transmission of Alarms to Fire Department by the public (check any applicable)
221 Street Alarm Box System ( ) 222 Public Telephone System ( )
223 Alarm Systems in Buildings Directconnected to Fire De- partment or Security Central Station Service ( )
2. Main Location of Receipt of Alarms of Fire (check one) I 224 Own Fire Station or Center ( )
Another Fire Department ( )
1
Municipal Communications Cener ( ) 24-hr. Industry or Institution ( ) Police Station ( )
Telephone Answering Service ( )
Homes of Firefighters ( ) Other (specify)
3. Institution Alarms (if "none" enter "0")
225 Percentage of Institutional Buildings in Your Community that have an Alarm System Directconnected to the Fire Department or A Security Central Station ( %)
4. Automatic Alarm Service
226 Is There a Service Available for Automatic Transmission of Alarms from Sprinkler and other Automatic Systems Direct to the Fire Department or a Security Central
Station Yes ( ) No ( )
5. Residential Detection
For which of the following types of Residential Buildings is there a Legal Requirement that they be Protected by Auto- matic Detection or Extinguishing Devices (check any applicable)
New Existing
Buildings Buildings
No Requirement 227 ( ) 228 ( )
All
Residential Occupancies 229 ( ) 230 ( )One-and Two-Family Dwellings Only 231 ( ) 232 ( )
This publication is being distributed by the Division of Building R e s e a r c h of the National R e s e a r c h Council of Canada. I t should not b e reproduced i n whole o r i n p a r t without p e r m i e s i o n of the original publisher. The Di- vision would b e glad to b e of a s s i s t a n c e i n obtaining such p e r m i s s i o n .
Publications of the Division m a y b e obtained by m a i l - ing the a p p r o p r i a t e r e m i t t a n c e (a Bank, E x p r e s s , o r P o s t Office Money O r d e r , o r a cheque, m a d e payable to the R e c e i v e r G e n e r a l of Canada, c r e d i t NRC) t o the National R e s e a r c h Council of Canada. Ottawa. K1A OR6. S t a m p s a r e not acceptable.
A l i s t of a l l publications of the Division i s available and m a y b e obtained f r o m the Publications Section. Division of Building R e s e a r c h , National R e s e a r c h Council of Canada, Ottawa. KIA OR6.