Publisher’s version / Version de l'éditeur:
Vous avez des questions? Nous pouvons vous aider. Pour communiquer directement avec un auteur, consultez la
première page de la revue dans laquelle son article a été publié afin de trouver ses coordonnées. Si vous n’arrivez pas à les repérer, communiquez avec nous à [email protected].
Questions? Contact the NRC Publications Archive team at
[email protected]. If you wish to email the authors directly, please see the first page of the publication for their contact information.
https://publications-cnrc.canada.ca/fra/droits
L’accès à ce site Web et l’utilisation de son contenu sont assujettis aux conditions présentées dans le site LISEZ CES CONDITIONS ATTENTIVEMENT AVANT D’UTILISER CE SITE WEB.
Astronomical Data Analysis Software & Systems XIVADASS XIV, Conference
Proceedings, 2004
READ THESE TERMS AND CONDITIONS CAREFULLY BEFORE USING THIS WEBSITE. https://nrc-publications.canada.ca/eng/copyright
NRC Publications Archive Record / Notice des Archives des publications du CNRC :
https://nrc-publications.canada.ca/eng/view/object/?id=1684a87c-537a-424c-9097-7d00c1b4b262 https://publications-cnrc.canada.ca/fra/voir/objet/?id=1684a87c-537a-424c-9097-7d00c1b4b262
NRC Publications Archive
Archives des publications du CNRC
This publication could be one of several versions: author’s original, accepted manuscript or the publisher’s version. / La version de cette publication peut être l’une des suivantes : la version prépublication de l’auteur, la version acceptée du manuscrit ou la version de l’éditeur.
Access and use of this website and the material on it are subject to the Terms and Conditions set forth at
Visual Data Mining of Astronomic Data with Virtual Reality Spaces:
Understanding the Underlying Structure of Large Data Sets
Institute for
Information Technology
Institut de technologie de l'information
Visual Data Mining of Astronomic Data with Virtual
Reality Spaces: Understanding the Underlying
Structure of Large Data Sets *
Valdés, J.
October 2004
* published at the Astronomical Data Analysis Software & Systems XIVADASS XIV, Conference Proceedings. October 24 - 27, 2004. Pasadena, California, USA. NRC 47391.
Copyright 2004 by
National Research Council of Canada
Permission is granted to quote short excerpts and to reproduce figures and tables from this report, provided that the source of such material is fully acknowledged.
Astronomical Data Analysis Software and Systems XIV O1-2
ASP Conference Series, Vol. XXX, 2005
P. L. Shopbell, M. C. Britton, and R. Ebert, eds.
Visual Data Mining of Astronomic Data with Virtual Reality Spaces: Understanding the Underlying Structure of Large Data Sets
Julio J. Vald´es
National Research Council Canada Institute for Information Technology 1200 Montreal Rd.
Ottawa, ON K1A 0R6 [email protected]
Abstract. The information explosion in astronomy requires the devel-opment of data mining procedures that speed up the process of scientific discovery, and the in-depth understanding of the internal structure of the data. This is crucial for the identification of valid, novel, potentially use-ful, and understandable patterns (regularities, oddities, etc).
A Virtual Reality (VR) approach for large heterogeneous, incomplete and imprecise information is introduced for the problem of visualizing and analyzing astronomic data. The method is based on mappings be-tween one heterogeneous space representing the data, and a homogeneous virtual reality space. This VR-based visual data mining technique allows the incorporation of the unmatched geometric capabilities of the human brain into the knowledge discovery process, and helps in understanding data structure and patterns. This approach has been applied successfully to a wide variety of real-world domains, and it has a large potential in astronomy. Examples are presented from the domain of galaxy research.
1. Introduction
The science of astronomy has experienced unprecedented progress in the last years. In particular, the advances in computer, communication, and observa-tion technologies have increased in many orders of magnitude the quantity and quality of astronomic data. This information explosion requires the development of data mining procedures that speed up the process of scientific discovery, and the in-depth understanding of the internal structure of the data. This is crucial for the non-trivial process of identifying valid, novel, potentially useful, and ulti-mately understandable patterns in data; that is, for knowledge discovery (Fayyad et.al 1996).
The information explosion requires analytic and interpretation procedures which enable users to understand their data rapidly and with greater ease. Fur-ther, the increasing complexity of the data analysis procedures makes it more difficult for the user to extract useful information out of the results given by the various techniques applied. Visual techniques are, therefore, very appealing.
In general, objects under study are described in terms of collections of
hetero-geneous properties. For example, an astronomic source can be characterized
by a set of properties represented by nominal, ordinal or real-valued variables (scalar), as well as by other of a more complex nature like images (in the visible wavelength region, infrared, and others), time-series (e.g. spectra), etc. In addi-tion, the information comes with different degrees of precision, uncertainty and completion (missing data is quite common). Classical data mining and analy-sis methods are sometimes difficult to use, the output of many procedures may be large and time consuming to analyze, and often their interpretation requires special expertise. Moreover, some methods are based on assumptions about the data which limit their application, specially for the purpose of exploration, comparison, hypothesis formation, etc, typical of the first stages of scientific investigation.
This makes graphical representation directly appealing. Humans perceive most of the information through vision, in large quantities and at very high input rates. The human brain is extremely well qualified for the fast understanding of complex visual patterns, and still outperforms the computer. Several reasons make Virtual Reality (VR) a suitable paradigm: Virtual Reality is flexible, as it allows the choice of different representation models to better suit different human perception preferences. It allows the construction of different virtual worlds representing the same underlying information, but with different look and feel. Thus, the user can choose the most appealing representation. VR allows immersion. The user can navigate inside the data, and interact with the objects in the world. VR creates a living experience. The user is not merely a passive observer or an outsider, but an actor in the world, in fact, part of the information itself. VR is broad and deep. The user may see the VR world as a whole, and/or concentrate the focus of attention on specific details or portions of the world. Of no less importance is the fact that in order to interact with a Virtual World only minimal skills are required.
In this paper a Virtual Reality approach for understanding large heteroge-neous, incomplete and imprecise data (Vald´es 2002, 2002b, Vald´es & Bonham-Carter 2003, Vald´es 2003, Vald´es 2004), is introduced in the domain of astron-omy. In this approach, the notion of data is not restricted to databases, but also includes logical relations and other forms of structured knowledge.
2. The Heterogeneous Space
Consider an information system S =< U, A > where U and A are non-empty finite sets, called the universe and the set of attributes respectively, such that each a ∈ A has a domain Va and an evaluation function fa assigns to each u ∈ U
an element fa(u) ∈ Va (i.e. fa(u) : U → Va) (here the Va are not required to
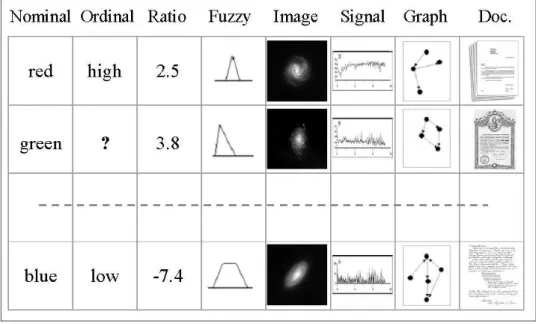
be finite). An example is shown in Fig 1. There are attributes with domains of different kinds (nominal, ordinal, ratio, fuzzy, images, time-series and graphs), and also containing missing values (represented as ?).
Heterogeneous and incomplete information systems will be considered as
follows. Let ? be a special symbol having two basic properties: i) if ? ∈ Ω (Ω being an arbitrary set) and f is any unary function defined on Ω, then f (?) = ?, and ii) ? is an incomparable element w.r.t any ordering relation defined on Ω. A
Visual Data Mining of Astronomic Data with Virtual Reality Spaces 3
Figure 1. An example of a heterogeneous database.
heterogeneous domain is defined as a Cartesian product of a collection of source
sets (Ψi): ˆHn= Ψ1×. . .×Ψn, where n > 0 is the number of information sources
to consider.
As an example, consider the case of a heterogeneous domain where objects are characterized by attributes given by continuous crisp quantities, discrete features, fuzzy features, graphs and digital images. Let R be the reals with the usual ordering, and R ⊆ R. Now define ˆR = R ∪ {?} to be a source set
and extend the ordering relation to a partial order accordingly ( ˆR may model
scalar measurements, with missing values). Now let N be the set of natural numbers and consider a family of nr sets (nr ∈ N+ = N − {0}) given by
ˆ
Rnr = ˆR
1 × . . . × ˆRnr (nr times) where each ˆRj (0 ≤ j ≤ nr ) is constructed as ˆR, and define ˆR0 = φ (the empty set). Now let O
j, 1 ≤ j ≤ no ∈ N+ be
a family of finite sets with cardinalities kjo respectively, composed by arbitrary elements, such that each set has a fully ordering relation ≤Oj. Construct the sets ˆOj = Oj∪ {?}, and for each of them define a partial ordering ˆ≤Oj by extending ≤Oj according to the definition of ?. Analogously construct the set
ˆ
Ono = ˆO
1× . . . × ˆOno (no times and ˆO0 = φ). For the special case of nominal variables, let Nj, 1 ≤ j ≤ nm (nm ∈ N+) be a family of finite sets with
cardinalities km
j ∈ N+composed by arbitrary elements but such that no ordering
relation is defined on any of the Nj sets. Now construct the sets ˆNj = Nj∪ {?},
and define ˆNnm = ˆN
1× . . . × ˆNnm, (nmtimes and ˆN0 = φ). Sets ˆOno, ˆNnm may represent the case of no ordinal variables and nm nominal variables respectively.
Similarly, a collection of nf extended fuzzy sets ˆFj (1 ≤ j ≤ nf) , ng extended
graphs ˆGj (1 ≤ j ≤ ng) and ni extended digital images ˆIj (1 ≤ j ≤ ni), can be
and ˆIni.
The heterogeneous domain is given by ˆHn= ˆRnr× ˆOno× ˆNnm× ˆFnf× ˆGng× ˆIni. Elements of this domain will be objects o ∈ ˆHn given by tuples of length n =
nr+ no+ nm+ nf + ng + ni, with n > 0 (the empty set is excluded). Other kinds of heterogeneous domains can be constructed in a similar manner, using the appropriate source sets. More general information systems are those in which the universe is endowed with a set of relations of different arities. Let
t =< t1, . . . , tp > be a sequence of p natural integers, called type, and Y =<
Y, γ1, . . . , γp > a relational structure as defined in (Hajek & Havranek 1978),
where Y is a non-empty domain of objects and the Γ = {γi} (i = 1, . . . , p) are
different relations of various arities defined on Y (according to t). The extended information system will be ˆS =< U, A, Γ >, endowed with the relational system U =< U, Γ >.
3. The Virtual Reality Space
A virtual reality space is a structure composed of different sets and functions defined as Υ =< O, G, B, <m, g
o, l, gr, b, r >. O is a relational structure defined
as above (O =< O, Γv > , Γv =< γv
1, . . . , γvq >, q ∈ N+ and the o ∈ O are
objects), G is a non-empty set of geometries representing the different objects and relations (the empty or invisible geometry is a possible one). B is a non-empty set of behaviors (i.e. ways in which the objects from the virtual world will express themselves: movement, response to stimulus, etc. ). <m ⊂ Rm
is a metric space of dimension m (euclidean or not) which will be the actual virtual reality geometric space. The other elements are mappings: go : O → G,
l : O → <m, g
r: Γv → G, b : O → B, r is a collection of characteristic functions
for Γv, (r1, . . . , rq) s.t. ri : γivti → {0, 1}, according to the type t associated with
Γv.
The representation of an extended information system ˆS in a virtual world
implies the construction of another ˆSv =< O, Av, Γv >, O in Υ, which requires
the specification of several sets and a collection of extra mappings (w.r.t. those required for Υ). A desideratum for ˆSv is to keep as many properties from ˆS
as possible. Thus, a natural requirement is that U and O are in one-to-one correspondence (with a mapping ξ : U → O). The structural link is given by a mapping f : ˆHn → <m. If u =< f
a1(u), . . . , fan(u) > and ξ(u) = o, then l(o) = f (ξ(< fa1(u), . . . , fan(u) >)) =< fav
1(o), . . . , favm(o) > (favi are the evaluation functions of Av). This gives semantics to the pair < g
o(o), l(o) > (it
determines important properties like geometry, visibility and location).
It is natural to require that Γv ⊆ Γ (possibly empty), thus having a virtual world
portraying selected relations from the information system, represented according to the choices made for G and gr.
4. The Problem of Large Datasets
Regardless of the criteria followed when computing a virtual reality space, com-plex optimization procedures are applied involving the estimation of the image of the data objects. The objective function surface becomes more complex and
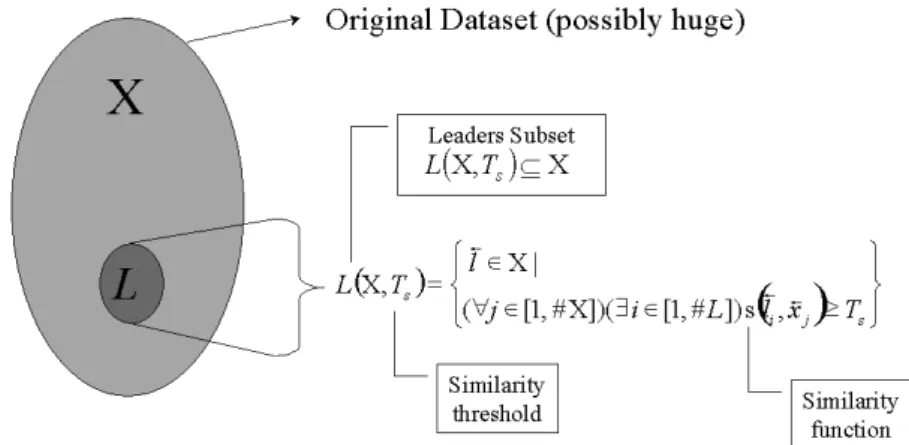
Visual Data Mining of Astronomic Data with Virtual Reality Spaces 5 convoluted with the increase of the dimensionality of the parameter space, and local extrema entrapment is typical. Even if all of the difficulties related with the amount of memory and the numeric computation involved are put aside (note that a dissimilarity matrix grows quadratically with the number of objects), the graphical representation of millions or possibly billions of objects in a screen with the current computer technologies, is neither feasible, nor practical. On the other hand, assuming that it would be possible, the amount of information presented to the user will be overwhelming, and will obscure, rather than clar-ify, the presence of meaningful or interesting patterns. The approach followed here is to study the properties of the dataset (X), possibly huge, in order to extract a subset of a sufficiently smaller cardinality which will either retain as much structural information as possible, or guarantee its preservation up to a predefined threshold. In this approach only the non-redundant objects up to a predefined degree are preserved, thus producing a kernel or core representation of the original dataset. If a similarity measure S is chosen as a redundancy criterium, and a similarity threshold Ts is set forth as a parameter, it is
possi-ble to construct a set L ⊆ X, such that ∀x ∈ X, ∃ l ∈ L, S(x, l) ≥ Ts (Fig-2).
There are efficient algorithms which can generate L-sets at different Ts-levels,
and this parameter will determine both the cardinality of the resulting L-set, as well as its semantics. According to this approach, a VR representation of a large or huge dataset is obtained by first extracting a L-set according to a suitable similarity threshold, and then computing its VR space. Since each of the data objects is represented by a sufficiently similar l-object (lower bounded by Ts),
the VR space is compliant with the similarity structure of the whole dataset X at that level.
Figure 2. Relation between a dataset X and its corresponding L-subset at the Ts-similarity level (# denotes set cardinality).
4.1. The Direct and Inverse Transforms
As mentioned, f plays an important role in giving semantics to the virtual world, and there are many ways in which such a mapping can be defined. In a great extent it depends on which features from the original data need to be highlighted. In particular, adjacency relationships between the objects O in Υ
should give an indication about the similarity relationships (Chandon, Pinson 1981) between the objects in the original heterogeneous space ˆHn(Vald´es 2002b). Other interpretations about internal structure are related with the linear/non-linear separability of class membership relations defined on the data (Jianchang & Jain 1995). In this sense, f can be constructed according to several criteria: i) to maximize some metric/non-metric structure preservation criteria as has been done for decades in multidimensional scaling (Kruskal 1964), (Borg & Lingoes 1987), ii) minimize some error measure of information loss, iii) maximize some measure of class separability (in a supervised case), or iv) satisfy several criteria simultaneously. For example, in the case of i), if δij is a dissimilarity measure
between any two i, j ∈ U (i, j ∈ [1, N ], where n is the number of objects), and ζivjv is another dissimilarity measure defined on objects iv, jv ∈ O from Υ (iv = ξ(i), jv = ξ(j), they are in one-to-one correspondence), two examples of
error measures frequently used are:
S stress = v u u t P i<j(δij2 − ζij2)2 P i<jδ4ij (1) Sammon error = P 1 i<jδij P i<j(δij − ζij)2 δij (2)
The f mappings obtained using approaches of this kind are only implicit, as no functional representations are found, and its usefulness depends the final errors obtained in the optimization process. Explicit mappings can be obtained from these solutions using neural network, genetic programming, and other tech-niques. An explicit f is useful for both practical and theoretical reasons. On one hand, in dynamic data sets (e.g. systems being monitored or databases formed incrementally from continuous processes) an explicit direct transform f will speed up the incremental update of the VR information system Sv. On the
other hand, it can give semantics to its attributes, thus acting as a dimensionality reducer or as a generator of new attributes.
The possibilities derived from this approach are practically unlimited, since the number of different similarity, dissimilarity and distance functions defin-able is immense. Moreover, similarities and distances can be transformed into dissimilarities according to a wide variety of schemes. This provides a rich frame-work where one can find appropriate measures better suited to both the internal structure of the data, and external criteria.
The existence of an inverse transformation f−1 from Υ back to ˆHn is, in
many cases, worth considering. If a sense is made of patterns of objects in Υ in terms of abstract concepts, and new conjectured objects or relations are conceived, it is natural to ask what kind of previously unseen or undiscovered objects or relations they would correspond to in ˆHn. Several approaches for
finding the inverse transformation can be followed, and neural networks are among the obvious choices (Vald´es 2002b).
Visual Data Mining of Astronomic Data with Virtual Reality Spaces 7
5. An Astronomic Example
In order to illustrate the possibilities of the proposed approach, a dataset con-taining information about 33055 galaxies was used. This information is part of the Canada-France-Hawaii Legacy Survey (the CFH telescope), and the observa-tional conditions, and preprocessing related with the dataset were the following:
• I-band (red filter) exposure time is 46740 seconds
• Total 5-band exposure time is 77180 seconds (u,g,r,i,z filters were applied,
and the i-Band was used to get the morphologies)
• Image reduction, with photometry, and photometric redshifts (courtesy of
Stephen Gwyn from the University of Victoria)
• The seeing was 0.9 arcseconds to 1.1 arcseconds (moderate).
• Morphologic analysis by David Schade (Herzberg Institute for Astrophysics,
National Research Council Canada)
Each galaxy was characterized by a collection of 11 attributes: 1) The I-band (red) magnitude, 2-6) five variables describing the color of the gallaxy (derived from the values obtained by the u,g,r,i,z filters, 7) the half-light radius of the galaxy image, 8) the half-light radius, as a measure of the size of the galaxy, 9) the exponential index of the slope of the light profile, 10) the axial ratio (longer half-axis/smaller half-axis of an ellipse), and 11) the Photometric redshift.
When presenting the VR spaces corresponding to the experiments, it must be taken into account that it is impossible to illustrate appropriately the look, feel and immersion of a virtual reality, color, 3D environment within the limits imposed by printed paper. Thus, grey level screen snapshots from the examples are presented only to give a rough idea. The design of the virtual reality spaces was kept simple in terms of the geometries used, (in particular, behaviors were excluded). The snapshots were simplified w.r.t the information included in the corresponding Υs to avoid information overload. The criterium for computing the VR space was to preserve the similarity structure, and the direct trans-form between the original space and Υ was found by minimizing Sammon error, with ζij given by the euclidean distance in Υ and δij = (1 − ˆsij)/ˆsij, where ˆ
sij is Gower’s similarity (Gower 1973). In all cases, the computed VR space
corresponds to L-sets extracted from the database containing all of the galaxies. 5.1. Experiment 1: All Galaxies
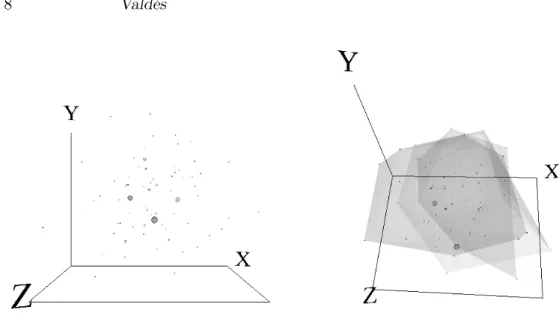
For this first experiment, all of the variables were used as descriptor attributes, and the L-sets were computed at a similarity threshold of 0.85. In addition, the values of the Photometric redshift were used as a classification criterium, and the galaxies were divided into three classes: < 0.5, in the [0.5, 1) interval, and ≥ 1. Accordingly, additional objects were included in the space, namely, transparent membranes wrapping the classes induced by the previously defined partition. The resulting space is shown in Fig. 3. In the left hand side, each element of the L-set is represented as a sphere with a radius proportional to the number of objects of the original database represented by the corresponding L-object, thus giving an idea of the relative distribution of the elements of the whole database in the VR space. In the right hand side, the elements of the same space are wrapped with semitransparent surfaces corresponding to the classes induced by
Figure 3. Virtual Reality Space corresponding to the 33055 galaxies database. Left: L-set computed with a similarity threshold of 0.85. Right: the same set but with transparent membranes wrapping subsets having specific ranges of the Photometric redshift attribute (see text). the partition derived from the Photometric redshift. This variable is related with the distance to a given galaxy, and the differential concentration of the galaxies within each class. The clear distinction of the wrapping surfaces, indicates that their intrinsic properties have a dependency w.r.t. their Photometric redshift. 5.2. Experiment 2: Three Groups of Galaxies According to the
Pho-tometric Redshift
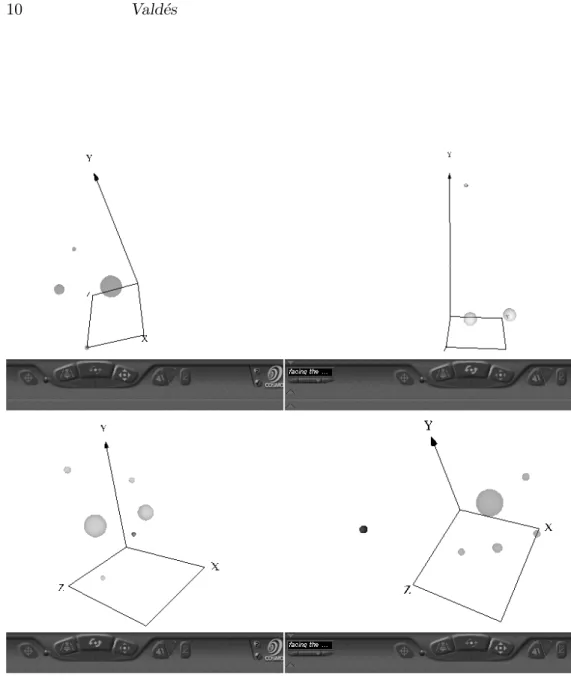
In this case, the dataset was partitioned into three separate subsets according to the value of the Photometric redshift as described in the previous experiment. Then, a four-fold set of VR-spaces was computed (for the whole dataset, and for the three subsets). In all cases the Photometric redshift was excluded as a descriptor attribute in order not to bias the computation of the L-sets and their corresponding VR-spaces, hence, each galaxy was described by a set of 10 attributes. The similarity threshold used for computing the L-sets in all cases was 0.75, and the results are shown in Fig. 4.
The shapes and structure of the VR-spaces corresponding to the galaxy subgroups in comparison with the whole are different. This provides an indi-cation of the influence of distance to the galaxy (expressed by the Photometric redshift), on its nature and properties.
6. Acknowledgents
The author would like to thank David Schade from the Herzberg Institute of Astrophysics (for providing the data, and for his suggestions when constructing the VR-spaces), as well as to Alan Barton from the Institute for Information Technology. Both institutes belong to the National Research Council Canada.
Visual Data Mining of Astronomic Data with Virtual Reality Spaces 9 7. Conclusion
The construction of virtual reality spaces for astronomic databases allows the visualization and the understanding of the underlying structure of datasets, pos-sibly large. As illustrated by examples from the domain of galaxy research, this tool is potentially useful in knowledge discovery and data mining in astronomy. References
Borg, I., Lingoes, J. 1987, Multidimensional Similarity Structure Analysis. Springer-Verlag.
Chandon, J.L., Pinson, S. 1981, Analyse Typologique. Thorie et Applications. Masson, Paris.
Fayyad, U., Piatesky-Shapiro, G., Smyth, P. 1996, From Data Mining to Knowl-edge Discovery. In U.M. Fayyad et al. (eds.) Advances in KnowlKnowl-edge
Discovery and Data Mining. AAAI Press, pp. 1-34.
Gower, J.C. 1973, A General Coefficient of Similarity and Some of its Properties.
Biometrics Vol.1 No. 27, pp. 857-871.
Hajek, P., Havranek, T. 1978, Mechanizing Hypothesis Formation. Springer Verlag.
Jianchang, M., Jain, A. 1995, Artificial Neural Networks for Feature Extraction and Multivariate Data Projection. IEEE Trans. On Neural Networks. Vol. 6, No. 2, pp. 296-317.
Kruskal, J. 1964, Multidimensional Scaling by Optimizing Goodness of Fit to a Nonmetric Hypothesis. Psichometrika Vol 29, pp. 1-27.
Vald´es, J.J. 2002, Virtual Reality Representation of Relational Systems and Decision Rules: An exploratory Tool for understanding Data Structure. In Theory and Application of Relational Structures as Knowledge In-struments. Meeting of the COST Action 274 (P. Hajek. Ed). Prague, November 14-16.
Vald´es, J.J. 2002b, Similarity-based Heterogeneous Neurons in the Context of General Observational Models. Neural Network World. Vol 12., No. 5, pp. 499-508.
Vald´es, J.J.,Bonham-Carter G.F. 2003, Virtual Reality Representation of Geo-science Databases and Decision Making Knowledge. Proc. of the 2003 Anual Conference of the Int. Assoc. for Mathematical Geology, Portsmouth, UK, September 7-12.
Vald´es, J.J. 2003, Virtual Reality Representation of Information Systems and Decision Rules: An Exploratory Tool for Understanding Data and Knowl-edge. Lecture Notes in Artificial Intelligence LNAI 2639, pp. 615-618. Springer-Verlag.
Vald´es, J.J. 2004, Interpreting fuzzy clustering results with virtual reality-based visual data mining: application to microarray gene expression data. Proc. NAFIPS04 Int. Conf. of the North American Fuzzy Information Process-ing Society, pp 302-307.
Figure 4. Virtual Reality Space corresponding to the 33055 galaxies database according to the values of the Photometric redshift. The L-sets were computed with a similarity threshold of 0.75. Upper left: All of the galaxies. Upper right: Galaxies with Photometric redshift < 0.5. Lower left: Galaxies with Photometric redshift in the [0.5, 1) interval. Lower right: Galaxies with Photometric redshift ≥ 1. The toolbar at the bottom of each representation corresponds to the navigation controls of the virtual reality browser.