APIX: Analysis From Pixellated Inputs in
Early Design Using a Pen-Based Interface
The MIT Faculty has made this article openly available.
Please share
how this access benefits you. Your story matters.
Citation
Murugappan, Sundar, Vinayak, Karthik Ramani, and Maria C.
Yang. “APIX: Analysis From Pixellated Inputs in Early Design
Using a Pen-Based Interface.” ASME 2011 International Design
Engineering Technical Conferences and Computers and Information
in Engineering Conference, 28-31 August, 2011, Washington, DC,
USA, ASME, 2011. © 2011 by ASME
As Published
http://dx.doi.org/10.1115/DETC2011-48680
Publisher
ASME International
Version
Final published version
Citable link
http://hdl.handle.net/1721.1/120363
Terms of Use
Article is made available in accordance with the publisher's
policy and may be subject to US copyright law. Please refer to the
publisher's site for terms of use.
Proceedings of the ASME 2011 International Design Engineering Technical Conferences & Computers and Information in Engineering Conference IDETC/CIE 2011 August 29 - 31, 2011, Washington, DC, USA
DETC2011 - 48680
APIX: ANALYSIS FROM PIXELLATED INPUTS IN EARLY DESIGN USING A
PEN-BASED INTERFACE
Sundar Murugappan∗ Vinayak
Karthik Ramani
School of Mechanical Engineering Purdue University
West Lafayette, Indiana 47907, USA
Maria C. Yang
Dept.of Mechanical Engineering and the Engineering Systems Division Massachusetts Institute of Technology
Cambridge, MA 02139, USA
ABSTRACT
Product development is seeing a paradigm shift in the form of a simulation-driven approach. Recently, companies and de-signers have started to realize that simulation has the biggest impact when used as a concept verification tool in early stages of design. Early stage simulation tools like ANSYSTMDesign Space
and SIMULIATMDesignSight Structure help to overcome the
limitations in traditional product development processes where analyses are carried out by a separate group and not the signers. Most of these commercial tools still require well de-fined solid models as input and do not support freehand sketches, an integral part of the early design stage of product develop-ment. To this extent, we present APIX (acronym for Analysis from Pixellated Inputs), a tool for quick analysis of two dimen-sional mechanical sketches and parts from their static images us-ing a pen-based interface. The input to the system can be offline (paper) sketches and diagrams, which include scanned legacy drawings and freehand sketches. In addition, images of two-dimensional projections of three two-dimensional mechanical parts can also be input. We have developed an approach to extract a set of boundary contours to represent a pixellated image us-ing known image processus-ing algorithms. The idea is to convert the input images to online sketches and use existing stroke-based recognition techniques for further processing. The converted sketch can now be edited, segmented, recognized, merged, solved
∗Address all correspondence to this author.
for geometric constraints, beautified and used as input for finite element analysis. Finally, we demonstrate the effectiveness of our approach in the early design process with examples.
1 INTRODUCTION
In today’s highly competitive manufacturing markets, con-ventional methods aimed solely at product cost, quality, or time-to-market are no longer sufficient to gain market advantage. Fur-thermore, they are inefficient for manufacturers to compete in today’s turbulent economy. The focus today is on innovation: products that clearly differentiate themselves from others while also being affordable, reliable, and fast to market [1, 2]. Prod-uct development is seeing a paradigm shift in the form of a simulation-driven approach. A wide range of simulation tools are now available to deploy throughout the product development process. These include multi-physics simulations, electromag-netics, fluid dynamics, structural finite element analyses, fatigue and failure analyses, acoustic predictions and design optimiza-tion [3]. Moreover, simulaoptimiza-tion tools can be used most effectively to facilitate design innovation if they are blended seamlessly within the product development cycle rather than used alongside the process. Now, companies and designers have started to real-ize that simulation has the biggest impact when used as a concept verification tool in the early stages of design. By using simula-tion as part of the design process in the early stages of product
1 Copyright c⃝ 2011 by ASME
Proceedings of the ASME 2011 International Design Engineering Technical Conferences & Computers and Information in Engineering Conference IDETC/CIE 2011 August 28-31, 2011, Washington, DC, USA
(a) (b) (c) (d) (e) (f) (g)
FIGURE 1. Mechanical Spanner - From Image to Analysis
development when concepts are just starting to take shape, engi-neers are able to explore various product configurations, evaluate different part geometries and materials, and examine all the many tradeoffs inherent to product development [2].
The commercial simulation tools vary in how powerful they are and in their user-interfaces depending on who their tar-get customers are and in what stage of design they are typi-cally going to be used. For example, ANSYSTMDesign Space [4] is more suited for designers to use in concept stage of design and ANSYSTMWorkbench for analysts in later stages. Early stage simulation tools like ANSYSTMDesign Space and SIMULIATMDesignSight Structure [5] facilitate product innova-tion by enabling designers with a limited understanding of anal-ysis technology to perform rough simulation early in the devel-opment cycle to evaluate concepts, explore ‘what-if’ scenarios, and compare alternative ideas. These tools help to overcome the limitations in traditional product development processes where analyses are carried out by a separate group and not by the de-signers.
Most of these commercial tools still require well defined solid models as input and do not support freehand sketches, an integral part of early design stage of product development. Free-hand sketches are a natural, efficient and convenient way to vi-sually represent and communicate ideas [6]. The interfaces to these simulation tools are traditional WIMP (windows, icons, menus and pointers) style GUIs. Though functional and pow-erful, they are not more accessible and natural as pen-based in-terfaces. Tools developed for processing online sketches using such pen-based interfaces have become advanced and efficient. However, they still do not capture the naturalness, intuitiveness and flexibility offered by the traditional pen-and-paper sketching. Early design ideation often requires intensive visual explo-ration, assessment and iteration through which the product form
eventually evolves [1]. Tools with ‘search’ capabilities have be-come more common in early stages of design [7]. In addition to text input, the queries can now include three-dimensional mod-els, two-dimensional diagrams, and images allowing for sophis-ticated retrieval of matching objects. An engineer who intends to design a mechanical gear, can now approximately sketch a gear, search and browse through relevant results, and reuse an existing image or a sketch for further design. Also, legacy engineering drawings are still available in paper format which can be effec-tively re-used in design by scanning them as images and indexing them in search databases.
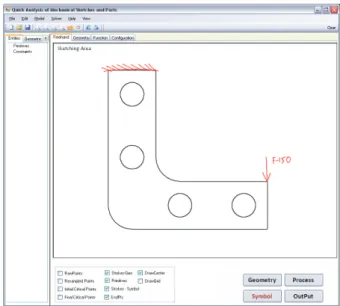
To this extent, we present, APIX (acronym for Analysis from Pixellated Inputs), a tool for quick analysis of two dimen-sional mechanical sketches and parts from their static images using a pen-based interface (Fig. 3). The input to the system can be any offline (paper) sketches and diagrams, which include scanned legacy drawings and freehand sketches. In addition, two-dimensional projected images of three dimensional mechan-ical parts can also be input. Using known image processing algo-rithms, the input images are first cleaned and processed to extract the contours representing the boundaries of the objects in the im-age. The idea is to convert the input images to online sketches and use existing stroke-based recognition techniques like beauti-fication for further processing. An online sketch is a collection of strokes, where a stroke is a set of temporally ordered sampling points captured in a single sequence of pen-down, pen-move and pen-up events. The converted sketch can now be edited, seg-mented, recognized, merged, solved for geometric constraints, beautified and used as input for the next stage, i.e. static struc-tural and thermal finite element analysis (FEA). Geometry cre-ation and specifying loading/boundary conditions are the most tedious part in setting up a FEA problem. This pen-based tool would allow the users to edit and modify the geometry by
di-rectly interacting with them just as they would do on paper. Also, we posit that, it is more intuitive to specify loading and boundary conditions through gestures and symbols than through traditional menu-based input. Figure 1 shows an example of static analysis of a spanner from a photograph.
APIX allows analyses to be conducted earlier in the de-sign process by reducing the conventional dependence on prepar-ing formal computer models beforehand. Full-fledged geometric models typically require a clear understanding of the design de-tails. Freehand sketches, on the other hand, are less technically detailed since their purpose is to facilitate the exploration of a wide variety of potential ideas. This tool is envisaged to enrich and strengthen the idea exploration phase by connecting it with the analysis tools which were typically used for fully detailed models.
2 RELATED WORK
The emergence of pen-input devices like Tablet PCs, large electronic Whiteboards and PDAs have led to demand for sketch based interfaces in diverse applications [8]. Dickinson et al [9] explore the possibility of using pen-tablet as a CAD interface al-ternative through survey findings. A comprehensive overview of sketch-based interfaces focused on 3D modeling applications is provided in [10] and for design in general in [11]. We discuss some tools here. DENIM [12] is a sketching tool for web site design which includes logical structure and links. SILK [13] is a sketching tool for WIMP-based user interface design. SKETCH [14] is an environment for rapidly conceptualizing and editing approximate 3D scenes using simple non-photorealistic render-ing and a purely gestural interface based on simplified line draw-ings of primitives. QuickSketch [15] is a pen-orientated, 2D-based 3D modeling tool which relies on on sweeps, lofts and revolutions. In both these systems, the user has to draw objects in pieces, reducing the sense of natural sketching. nuSketch [16] is a multi-modal, pen-based gestures and voice commanded tool for map diagram drawing. CALI [17] is an online recognition library of simple gestures to create and edit 2D shapes for dia-grams. ParSketch [18] is a sketch-based interface for editing 2D parametric geometry. Kara et al [19] developed a sketch-based system for vibratory mechanical systems. Tian et al [20] intro-duced a pen-based system that reconstructs 3D spatial geometry from a single 2D online freehand sketch. The system allows the reconstructed objects to be subjected to a finite-element-based static analysis. The object can quickly be modified in place us-ing the pen-based interface accordus-ing to the results of the anal-ysis to allow for iterative design work. Our tool is similar in conception and allows two dimensional analysis of sketches and trusses from images. STRAT [21] is a pen-based tool for stu-dents to learn standard truss analysis. MathPad [22] is a tool for solving mathematics problems. Krichoff’s pen [23] is a pen-based tutoring system that teaches students to apply Kirchhoff’s
voltage law and current law. Newton’s Pen [24], a statics tu-toring system that runs directly on the FLY pentop. Hutchinson et al. [25] developed a unified framework for structural analy-sis. They used an existing freehand sketch recognition interface which is not robust in handling freehand strokes that represent multiple primitives combined together. In addition, open circu-lar arcs or curves are not handled, constraining both the variety of input that can be specified and the designer’s drawing freedom. Scan and SolveTMsystem developed by Freytag et al [26] is a first commercial implementation of the mesh free method for solving boundary value problems with distance fields. They provide a so-lution for linear 3D stress problems where the input is the native acquire data of physical artifacts (like sculptures and mechanical parts) through sampling. The tool, APIX, presented in this paper is an extension of FEAsy developed by Murugappan et al [27], a sketch-based interface for static structural analysis of online sketches. APIX supports input from a variety of offline sketches and images allowing for easy modification and re-use of existing geometries for quick structural and thermal analysis. To the best of our knowledge, the pen-based tool presented in the paper, is the first tool to allow finite element analysis of sketches and parts from images. Our contribution in this paper is the holistic envi-ronment which glues stroke-based recognition techniques, geom-etry constraint solving, contour extraction from images, symbol recognition and combined interpretation of geometry, text and symbols in a finite element context.
3 SYSTEM OVERVIEW
Figure 2 shows the system pipeline through which the in-put images and the online strokes are processed. There are two modes in the system to acquire input namely the ‘geometry’ mode and ‘symbol’ mode. The inputs are colored either in black or red respectively. As the names suggest, the problem geometry to be analyzed, is input in the ‘geometry’ mode. The first step in obtaining the geometry is to automatically extract the boundary/ contour information from the input image (Fig. 4a) and con-vert the extracted contours to online strokes (Fig. 4b). Here, we assume that the input image is comprised of only geometry ele-ments (no symbols or text). We refer to the collection of online strokes that now represent the geometry as a ‘sketch’. Now the input strokes can be edited and modified in the geometry mode using the digital pen(Fig. 4c). The user can also add new strokes to the already existing input. Our pen-based interface allows the user to draw in a natural way just as they would do on paper. The user can draw freely and there is no restriction on how a partic-ular shape or symbol is drawn and text is written. Each stroke (both extracted and newly added) in the sketch is beautified, and as a result, the whole sketch is transformed to a more formalized and structured representation (Fig. 4d). Various stages of the beautification algorithm are explained in section 3.2.
Classifying the input strokes as geometry, text or symbol
(a) scanned sketch (b) extracted contours (c) edited sketch (d) beautified geometry
(e) input symbols
F=150
(f) final sketch: geometry +
loads + boundary (g) Displacement Vector Sum Plot
FIGURE 4. An example Strokes Sketch Interpretation Final Sketch Geometry Classification & Recognition Symbol Mode Strokes Beautification Beautified Geometry Geometry Mode Images Component-wise Boundary Extraction Text Symbol
FIGURE 2. The system pipeline
is one of the important challenges in a pen-based interface. To distinguish between text and geometry, Zeleznik et al [28] used the criteria that the size of text must be small and (or) the gap between continuous strokes is less than a certain threshold. We use similar heuristics to distinguish between handwritten text and geometry elements. However, both the FEA problem’s geome-try and symbols are composed of low-level primitives like lines and arcs. To maintain the naturalness of the interface, the sym-bols or geometry can be specified in a single stroke or multiple strokes and there should be no requirements that the parts of sym-bol/geometry be drawn in the same order. Hence to accommo-date these requirements and simplify recognition, we ask the user
FIGURE 3. The Interface
to switch pen colors (i.e. switch modes) while specifying geom-etry or symbols. Text can be input only in the symbol mode. In addition to reducing ambiguity, multi-color provides visual clar-ity to the sketch. The strokes input in symbol mode are not pro-cessed like in geometry mode (Fig. 4e). When the user presses the ‘process’ button, the red colored strokes are first clustered into stroke-groups and classified as either text or symbol. Then, each stroke-group is recognized. Finally, the symbols, text and geometry are interpreted together for understanding the various
(a)
(c)
(d) (b)
FIGURE 5. Image and its corresponding boundary, (a) image with multiple segments and hole (b) boundary consisting of oriented con-tours. Edge rectification, (c) graph of a double edge, (d) removal of double edges
contexts to yield the final sketch. For example, in Fig. 10(b)(d), the ‘load’ arrow, ‘P=100’ and line L6, combine together to imply the meaning that a pressure load of 100 units is applied on the line in negative y-direction. The details of the various steps are out-lined in section 3.3. Once the sketch is complete and processed, the user selects the ‘OUTPUT’ button, which starts the ‘FE inte-gration’ causing a dialog to pop-up, where the user specifies the material properties, element description and meshing parameters (if any). When the dialog is closed successfully, all the informa-tion is exported as a unified file suitable for import in ANSYS.
The system is implemented in Visual C# using Windows forms and Visual Studio 2008. To acquire the pen-input, we have used a Wacom Cintiq 21UX digitizer with stylus, tablet-PCs and a traditional mouse. Both Wacom and tablet PCs are particularly suited to natural interaction, enabling the user to sketch directly on a computer display. The system uses Microsoft Tablet PC SDK to capture the user input strokes and for handwriting recog-nition. The users can view their sketch either as raw pen strokes and (or) as primitives in geometry mode and as raw pen strokes or their interpretations in symbol mode. Common interpretation errors can be easily corrected in our system. When a symbol or text is recognized incorrectly, the user can explicitly mark it by holding down a button on the stylus and circling it. A pop-up menu will open, where the user can choose from a list of possi-ble classifications. As the FEA domain is small, the number of misclassifications will be a minimum if not zero.
3.1 Component-wise Boundary Extraction
The interface presented in this paper considers a variety of objects for quick analysis in the early design phase. The objects under consideration are images of a variety of mechanical parts in form of scanned design sketches, snapshots of CAD models and photographs of existing mechanical parts. Further, the ob-jects may have holes (a nut) and multiple components by de-sign. Thus, given an image of an object, the aim is to generate a component-wise boundary of the object as an input for further analysis (see Fig. 5). The component-wise boundary consists of oriented contours bounding the image.
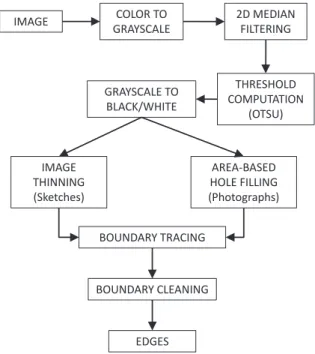
IMAGE COLOR TO GRAYSCALE THRESHOLD COMPUTATION (OTSU) GRAYSCALE TO BLACK/WHITE IMAGE THINNING (Sketches) AREA-BASED HOLE FILLING (Photographs) BOUNDARY TRACING BOUNDARY CLEANING EDGES 2D MEDIAN FILTERING
FIGURE 6. Approach for converting an image to a set of component-wise boundary edges
A general approach for processing the images and their sub-sequent conversion to these contours is shown in figure 6. A given color image is first converted to a gray-scale image using the hue and saturation elimination on the image. This is followed by noise removal using the 2D median filtering technique [29]. The gray-scale image is then converted to a binary image using a global threshold computed using Otsu’s method [30].
The objects in the images that are considered for quick anal-ysis can be broadly classified into sketches/line-diagrams and photographs. In other words, the images either represent outlines or silhouettes. The outlines (which are nothing but the pixellated boundaries) are morphologically thinned using the algorithm de-scribed in [31] and [32]. In the case of silhouettes, the holes oc-curring due to the noise are distinguished from the holes defining the object using a prescribed threshold (5% of the object area). The holes due to noise are then filled. Typically for a singly connected region without intended holes, the area-threshold may not be required as all holes would be occurring due to the noise. Keeping on view, the focus on the interface, the variety of image data in terms of the noise is restricted in this paper.
The component-wise boundaries of the cleaned binary im-ages are then extracted using Moore’s neighbor contour tracing algorithm. The image thinning and hole-filling operations may give rise to double edges after the contour tracing. These edges are removed by deleting the appropriate points from the contour (Fig. 5). Figures 7, 1(a - d) and 8 show the application of the present approach on a variety of images, namely CAD-image
(a) (b) (c)
FIGURE 7. From CAD-image to boundary (multiple components), (a) original Image, (b) binary Image after global thresh holding and me-dian filtering, (c) component-wise boundary traced for the image
(a) (b)
(c) (d)
FIGURE 8. From scanned sketches to boundary (truss), (a) original Image, (b) binary Image after global thresh holding and median filtering, (c) binary image after pixel-thinning, (d) boundary traced for the image
with multiple components, photograph and scanned sketches to extract their contours, respectively.
Since the present paper focuses on the interface for quick analysis, the types of image preprocessing techniques for noise removal and morphological thinning have been restricted to show how the interface would typically work in an automated setting.
3.2 Beautification
Beautification aims at simplifying the input where the var-ious points of the strokes are interpreted and represented in a more meaningful manner. Each stroke (both extracted and newly added) in the sketch is decomposed into low-level geometric primitives with minimal error. Our approach to transforming the input to formalized representations (i.e. beautification) is based on the architecture in [27]. There are five steps in the pipeline namely - resampling, segmentation, recognition, merg-ing and geometry constraint solvmerg-ing. An example of a freehand stroke is shown in Fig. 9(a). Figure 9(b) shows the uniformly spaced points after resampling (green circles). The segmenta-tion step identifies the critical points (red circles) shown in Fig. 9(c). Then, the segments between the adjacent critical points are recognized and fit with primitives (Fig. 9(d)). The low-level primitives recognized in the current implementation of our sys-tem include lines, circles, and circular arcs. The status of the
Geometric Constraint Solving Stroke resampling merging segmentation Resampled Points
Critical Points (red)
Primitives Primitives Beautified Sketch recognition (a) (b) (c) (d) (e) (f) FIGURE 9. Beuatification
freehand sketch after merging is shown in Fig. 9(e). The spatial relationships between the primitives are then identified. These relationships are represented as geometric constraints which are then solved by a geometry constraint solver. For this purpose, we have integrated LGS2D [33] in our system. The output from the solver is the beautified version of the input which is updated on the screen. (Fig. 9(f)).
Our system provides the interface to edit and manipulate ex-isting geometry through simple pen-based interactions. Errors in segmentation include missed and unnecessary critical points. In our system, when the user taps on or near a critical point with the stylus (or left click using a mouse), the system first removes that critical point and the corresponding two primitives that share this point. This results in an unrecognized segment which is then classified and refit. The user can also add a segmentation point in a similar manner. The nearest point on the stroke to the clicked location is used as the input point where the existing primitive is broken into two primitives. Clicking on one of the end points of an arc converts it to a circle. An input stroke drawn by holding down a button on the stylus (or both left and right mouse button together) is recognized as a pulling gesture. The primitive that is closest to the starting point of this gesture is the one to be pulled and accordingly its classification is altered i.e. if the primitive was a line, it is refit as a circular arc and vice versa. Addition-ally, the user can erase a primitive, a stroke or a part of stroke using the eraser end of the stylus, just as using a pencil eraser.
Fully Constrained
Roller
Moment
Dimension (Length or Diameter) Load (force / pressure)
Dimension (Radius) Description Symbols / Text F, P, T Force, Pressure, Temperature = Equal to 0, 1, 2, 3….9 Numbers (temperature load, dimensions) (a) L1 L2 L3 L4 L5 L6 L7 A1 A2 C1 P = 100 (a) (b) (c) (d) (e) (b)
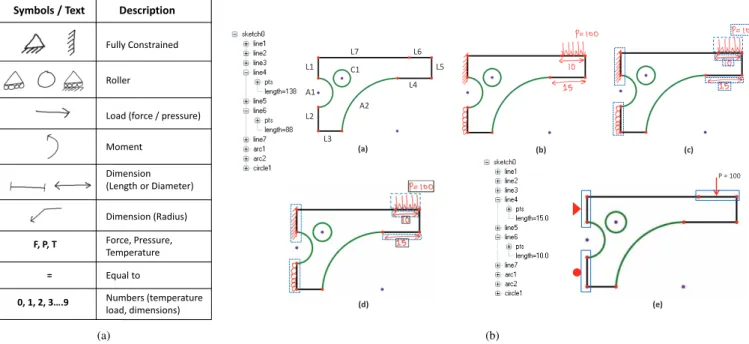
FIGURE 10. (a) The list of symbols recognized in our system and (b) Symbol Recognition and Sketch Interpretation
3.3 Symbol Recognition and Sketch Interpretation
The red colored strokes collectively represent both text and the symbols. The symbols drawn in finite element domain are as per standardized forms that are well defined both in academia and research. The list of symbols commonly used in finite element domain (i.e. for loading and boundary conditions) is shown along with other symbols recognized in our system in Fig 10(a). Fig. 10(b)(a) shows a beautified sketch of a 2D bracket created in ‘ge-ometry’ mode. Fig. 10(b)(b) shows the red-colored strokes rep-resent the dimensions, loading and boundary conditions drawn in ‘symbol’ mode. The first step in processing this collection of strokes (which is activated by pressing the ‘Process’ button) is to cluster them into smaller groups. We use both a temporal and a spatial proximity strategy to group strokes. The criteria, we used for clustering requires the strokes to be within a spatial threshold distance of 100 HIMETRIC units and (or) the time gap between continuous strokes is less than 500 milliseconds. Fig. 9 (a) shows a beautified sketch at the end of the ‘geometry’ mode. Fig. 10(b)(c) shows the results of the clustering, where a dashed bounding box is drawn around each group.
The next step is the recognition of each stroke-group, where each stroke- group comprises of either text or symbols. We use the height (<1.2centimeter) and width of bounding box (<2.2centimeter) as the criteria to distinguish between text and symbols. The stroke-groups that are classified as text are next recognized using the in-built handwriting recognizer (Microsoft Tablet PC SDK). Fig. 10(b)(d) shows the results of classifica-tion of stroke-groups into text (black) and symbols (blue). For symbol recognition, we use similar heuristic based rules as [27]
to recognize different symbols. The reason behind using such an approach is that the number of symbols in this set is finite and each symbol has some distinct properties that can be used to differentiate from the other symbols in spite of the possible vari-ations. Also, there is no training required. For the recognition of various symbols, we have built custom recognizers by extend-ing SIGER (Simple gesture recognition library) [34] usextend-ing vector strings and regular expressions.
The sketch needs to be interpreted after beautification and symbol recognition. Generally, users draw related objects in such a way that they are closer to each other. We use this observa-tion to associate and group objects to provide context. The vari-ous contexts observed in finite element analysis can be classified into three categories, namely loading conditions, boundary con-ditions and dimensions. Accordingly, the various symbols (Fig. 10(a)) fall into these categories. We use this classification infor-mation and spatial proximity reasoning of the bounding boxes to understand the different contexts in the sketch. The interpreted dimensional constraints are then satisfied by the geometric con-straint solver. Fig. 10(b)(e) shows the final sketch after sketch-interpretation. The text, geometry and symbols in a sketch have an inherent structure and they all combine only in some specific ways to provide context. For example, a dimensional value can never be associated with a straight single headed arrow; a load-ing condition can never be associated with a ‘fully constrained’ symbol; any arrow cannot exist on its own without an associ-ated text group. This kind of reasoning helps in correcting errors automatically, enabling robust sketch interpretation.
3.4 Finite Element Integration
When the user presses the ‘Output’ button, the system shows a dialog box, where the user enters the material information, el-ement type and description, and mesh size (if necessary) for fi-nite element analysis. Fifi-nite element solvers like ANSYS do not require any units, but assume that the input is consistent. Our system also behaves along similar lines. Hence, it is on the part of the user to make sure that the input units are consistent. Our current implementation of the system supports three types of ele-ments which are commonly used in structural, thermal and static finite element analysis. They are 1) Two dimensional- spar ele-ment, used for modeling trusses. The equivalent element in AN-SYS is LINK1; 2) Two dimensional structural solid element, for modeling solid structures. The equivalent element in ANSYS is PLANE42 and 3) A plane element with 2D thermal conduc-tion capabilities. - PLANE55 in ANSYS. The current version of the prototype allows only for one area to be meshed which is determined by subtracting the area inside inner contours from the outside contour. Similarly, the users can also specify what results they wish to view after the analysis, for example, like the displacement sum of nodal solution. On closing this dialog successfully, the system exports the input i.e., model geometry, boundary conditions, loads, material, element and meshing in-formation to a unified file specific for ANSYS (as a set of APDL commands). This file can then be then run in ANSYS to yield the desired results. Fig. 4(g) shows the plotted results in ANSYS of the bracket in Fig. 4(f). In this case, it the displacement vectors sum.
4 RESULTS AND DISCUSSION
In this section, we present some examples performed using our system. First we show an example of analyzing a mechanical part (spanner) from a photograph (Fig. 1). Figure 1(a) shows a photograph of a spanner, in this case a 2D projection. On loading the photograph, the system first extracts the boundaries using the boundary extraction algorithm, explained in section 3.1. Figure 1(d) shows the results of the extracted boundary contour. The extracted contour is now input as a stroke to the beautification algorithm and the result is shown in Fig. 1(e). The beautification algorithm parameterizes the extracted contour. When the user is satisfied with the geometry, they can switch to the ‘symbol’ mode to specify the boundary conditions, loads and dimensions. Fig-ure 1(f) shows the corresponding pen markings (red color) made by the user in ‘symbol’ mode. On pressing the process button, the system classifies the pen markings as symbol and text, rec-ognizes them and interprets the different contexts. The user can repeat this process to make changes to both the geometry and symbol, or can proceed further. When the user presses the ’out-put’ button, the system opens the finite element integration dia-log. The user can choose from a library of materials or modify existing material or specify new properties. For this problem, the
user chose steel withε= 30e6 andν= 0.3. Similarly, the element type (PLANE 42) and other parameters are input. On closing the dialog, the system exports the model as a set of APDL com-mands specific to ANSYS, which on execution shows the Von-Mises stress plot for the spanner as shown in Fig. 1(g). These results can now be potentially utilized in a variety of scenarios such as, to verify the design for failure, to perform sensitivity analysis using the parameterization results, and to identify po-tential regions where material can be removed.
Figure 11 shows an example of analyzing a three dimen-sional L-shaped bracket (Fig. 11a) as a two dimendimen-sional plane-stress problem. Figure 7 shows the process of extracting the boundary from a projected image of the bracket. The extracted contours are shown in Fig. 11(b). Figure 11(c) shows the input symbols on the beautified geometry. In this case, the geometry has not been modified. Figure 11(d) shows the displacement vec-tor sum plot in ANSYS. The user can now easily modify the ge-ometry by deleting existing primitives and (or) adding new prim-itives, using the pen as input. Figure 11(e) shows the modified geometry with the symbols where the two holes are removed us-ing an erasus-ing gesture in the geometry mode. The correspondus-ing displacement results are shown in Fig. 11(f). This example il-lustrates the ease with which geometry can be changed allowing exploration of a number of concepts early in the design stage. This case-study is an ideal example that can potentially impact the state of current students-teacher interaction in the undergrad-uate mechanical engineering classroom. It can foster a more dy-namic environment, in which questions like ‘what happens to the stresses if the holes are removed?’, ‘what is the maximum load the bracket can withstand?’ and ‘how can the amount of material be reduced?’, can be more effectively answered through on-the-fly simulation and visualization. It allows better understanding of practical situations through solving problems, where conven-tional equations do not apply, and also those that are not listed in textbooks.
5 CONCLUSION
Product development is seeing a paradigm shift in the form of a simulation-driven approach. It is proven that simulation tools are of best use when integrated within the design pro-cess rather than used alongside the product development cycle. Most early design stage commercial simulation tools still re-quire well defined solid models as input and do not support free-hand sketches. In this paper, we presented an approach to an-alyze and reuse mechanical parts and sketches from their im-ages using a pen-based interface. The input to the system can be any offiine (paper) sketches and diagrams, which include scanned legacy drawings and freehand sketches and images of two-dimensional projections of three dimensional mechanical parts. We described a holistic environment which glued stroke-based recognition techniques, geometry constraint solving,
con-Delete two holes
Displacement Vector Sum
(a)
(b) (c)
(d)
(e) (f)
FIGURE 11. Analysis of a L-bracket from projected image
tour extraction from images, symbol recognition and combined interpretation of geometry, text and symbols in a finite element context. We showed the capabilities of the system and also how this system can be used to evaluate ideas especially in early de-sign and also as a potential learning tool for students as well as the instructors. Most notably, the examples demonstrated the ease with which geometry can be imported and edited, the ef-fectiveness of the proposed approach in addition to how quick analysis can be performed from images. Anyone familiar with the finite element analysis domain can learn the system quickly with very little training. The current implementation of the sys-tem, exports the model geometry, loading and boundary condi-tions into a unified file that can be run in ANSYS to visualize results. Our ultimate goal is to create a unified framework from input to visualization of results. Hence, our immediate future work is to integrate a finite element solver and provide visualiza-tion capabilities in the system.
ACKNOWLEDGMENT
This material is based upon work supported by the National Science Foundation Division of Information and Intelligent Sys-tems (NSF IIS) under Grant No. 0535156. This work was done in collaboration with PARC (formerly Xerox PARC). Any opin-ions, findings, and conclusions or recommendations expressed in this material are those of the author(s) and do not necessarily refiect the views of the National Science Foundation.
REFERENCES
[1] Ulrich, K. T., and Eppinger, S. D., 2007. Product Design and Development, 4th ed ed. McGraw-Hill/Irwin.
[2] ANSYS, 2011. “The competitive edge: Design innova-tion with simulainnova-tion driven product development (white pa-per)”. www.ansys.com, as accessed on Feb 22nd 2011.
[3] Lemon, J., 2011. “Why simulation should
drive product development?”.
http://www.iti-global.com/education/articles/SimLedDev.htm, as
ac-cessed on Feb 22nd 2011.
[4] ANSYS. www.ansys.com, accessed on feb 22nd 2011. [5] SIMULIA. http://www.simulia.com, accessed on feb 22nd
2011.
[6] Yang, M., 2009. “Observations on concept generation and sketching in engineering design”. Research in Engineering Design, 20, pp. 1–11.
[7] Iyer, N., Jayanti, S., Lou, K., Kalyanaraman, Y., and Ra-mani, K., 2005. “Three-dimensional shape searching: state-of-the-art review and future trends”. Computer-Aided De-sign, 37(5), pp. 509 – 530.
[8] Plimmer, B., and Grundy, J., 2005. “Beautifying sketching-based design tool content: issues and experiences”. In AUIC ’05: Proceedings of the Sixth Australasian confer-ence on User interface, Australian Computer Society, Inc., pp. 31–38.
[9] John K. Dickinson, Zhisong Yu, Y. Z. H. A., 2005. “Pen-tablet as a cad interface alternative”. Robotics and
Computer-Integrated Manufacturing, 21(4-5),
August-October, pp. 465–474.
[10] Luke Olsen, Faramarz F. Samavati, M. C. S. J. A. J., 2008. “Sketch-based modeling: A survey”. Computers &
ics, In Press, Accepted Manuscript.
[11] Johnson, G., Gross, M. D., Hong, J., and Yi-Luen Do, E., 2009. “Computational Support for Sketching in Design: A Review”. Foundations and Trends in Human-Computer Interaction, 2(1), pp. 1–93.
[12] Lin, J., Newman, M. W., Hong, J. I., and Landay, J. A., 2001. “Denim: an informal tool for early stage web site design”. In CHI ’01: CHI ’01 extended abstracts on Human factors in computing systems, ACM, pp. 205–206.
[13] Landay, J. A., and Myers, B. A., 2001. “Sketching inter-faces: Toward more human interface design”. Computer, 34(3), pp. 56–64.
[14] Zeleznik, R. C., Herndon, K. P., and Hughes, J. F., 1996. “Sketch: an interface for sketching 3d scenes”. In SIG-GRAPH ’96: Proceedings of the 23rd annual conference on Computer graphics and interactive techniques, ACM, pp. 163–170.
[15] L.Eggli, H.ChingYao, B.Bruderlin, and Elber, G., Febru-ary 1997. “Inferring 3d models from freehand sketches and constraints”. Computer-Aided Design, 29, pp. 101– 112(12).
[16] Forbus, K. D., Lockwood, K., Klenk, M., Tomai, E., and Usher, J., 2004. “Open-domain sketch understanding: The nusketch approach”. In AAAI Fall Symposium on Mak-ing Pen-based Interaction Intelligent and Natural, October, AAAI Press, pp. 58–63.
[17] Fonseca, M. J., and Jorge, J. A., 2001. “Experimental eval-uation of an on-line scribble recognizer”. Pattern Recogn. Lett., 22(12), pp. 1311–1319.
[18] Naya, F., Contero, M., Aleixos, N., and Company, P., 2007. “Parsketch: A sketch-based interface for a 2d parametric geometry editor.”. In HCI (2), J. A. Jacko, ed., Vol. 4551 of Lecture Notes in Computer Science, Springer, pp. 115–124. [19] Kara, L. B., Gennari, L., and Stahovich, T. F., 2008. “A sketch-based tool for analyzing vibratory mechanical sys-tems”. Journal of Mechanical Design, 130(10), p. 101101.
[20] Tian, C., Masry, M., and Lipson, H., 2009.
“Physi-cal sketching: Reconstruction and analysis of 3D objects from freehand sketches”. Computer-Aided Design, 41(3), pp. 147–158.
[21] Peschel, J., and Hammond, T., 2008. “Strat: A sketched-truss recognition and analysis tool”. In Proceedings of the Fourteenth International Conference on Distributed Multi-media Systems.
[22] Laviola, J. J., and Zeleznik, R. C., 2006. “Mathpad2: a system for the creation and exploration of mathematical sketches”. In SIGGRAPH ’06: ACM SIGGRAPH 2006 Courses, ACM.
[23] de Silva, R., Bischel, D. T., Lee, W., Peterson, E. J., Calfee, R. C., and Stahovich, T. F., 2007. “Kirchhoff’s pen: a pen-based circuit analysis tutor”. In SBIM ’07: Proceedings of the 4th Eurographics workshop on Sketch-based interfaces
and modeling, ACM, pp. 75–82.
[24] Lee, W., de Silva, R., Peterson, E. J., Calfee, R. C., and Stahovich, T. F., 2008. “Newton’s Pen: A pen-based tu-toring system for statics”. Computers & Graphics, 32(5), pp. 511–524.
[25] Hutchinson, T. C., Kuester, F., and Phair, M. E., 2007. “Sketching finite-element models within a unified two-dimensional framework”. Journal of Computing in Civil Engineering, 21(3), pp. 175–186.
[26] Freytag, M. K., Shapiro, V., and Tsukanov, I., 2007. “Scan and Solve: Acquiring the Physics of Artifacts”. Volume 2: 27th Computers and Information in Engineering Confer-ence, Parts A and B, pp. 345–356.
[27] Murugappan, S., and Ramani, K., 2009. “Feasy: A sketch-based interface integrating structural analysis in early
de-sign”. ASME Conference Proceedings, 2009(48999),
pp. 743–752.
[28] Zeleznik, R. C., Bragdon, A., Liu, C.-C., and Forsberg, A., 2008. “Lineogrammer: creating diagrams by drawing”. In UIST ’08: Proceedings of the 21st annual ACM symposium on User interface software and technology, ACM, pp. 161– 170.
[29] Huang, T., Yang, G., and Tang, G., 1979. “A fast two-dimensional median filtering algorithm”. Acoustics, Speech and Signal Processing, IEEE Transactions on, 27(1), Feb., pp. 13 – 18.
[30] Otsu, N., 1979. “A threshold selection method from gray-level histograms”. IEEE Transactions on Systems, Man and Cybernetics, 9(1), Jan., pp. 62–66.
[31] Haralick, R. M., and Shapiro, L. G., 1992. Computer and Robot Vision, 1st ed. Addison-Wesley Longman Publishing Co., Inc., Boston, MA, USA.
[32] Lam, L., Lee, S.-W., and Suen, C., 1992. “Thinning
methodologies-a comprehensive survey”. Pattern Analysis and Machine Intelligence, IEEE Transactions on, 14(9), Sept., pp. 869 –885.
[33] LEDAS. http://www.ledas.com/products/lgs2d/, accessed on feb 22nd 2011.
[34] Swigart, S., 2005. “Easily write custom gesture recogniz-ers for your tablet pc applications”. Tablet PC Technical Articles.