EUROPEAN ORGANISATION FOR NUCLEAR RESEARCH (CERN)
New J. Phys. 18 (2016) 093016 DOI:10.1088/1367-2630/18/9/093016
CERN-EP-2016-074 21st September 2016
Search for scalar leptoquarks in pp collisions at
√
s
= 13 TeV with the ATLAS experiment
The ATLAS Collaboration
Abstract
An inclusive search for a new-physics signature of lepton-jet resonances has been per-formed by the ATLAS experiment. Scalar leptoquarks, pair-produced in pp collisions at √s= 13 TeV at the Large Hadron Collider, have been considered. An integrated luminosity of 3.2 fb−1, corresponding to the full 2015 dataset was used. First (second) generation leptoquarks were sought in events with two electrons (muons) and two or more jets. The observed event yield in each channel is consistent with Standard Model background expectations. The observed (expected) lower limits on the leptoquark mass at 95% confidence level are 1100 GeV and 1050 GeV (1160 GeV and 1040 GeV) for first and second generation leptoquarks, respectively, assuming a branching ratio into a charged lepton and a quark of 100%. Upper limits on the aforementioned branching ratio are also given as a function of leptoquark mass. Compared with the results of earlier ATLAS searches, the sensitivity is increased for leptoquark masses above 860 GeV, and the observed exclusion limits confirm and extend the published results.
c
2016 CERN for the benefit of the ATLAS Collaboration.
Reproduction of this article or parts of it is allowed as specified in the CC-BY-4.0 license.
Contents
1 Introduction 3
2 The ATLAS detector 5
3 Signal and background simulations 5
4 Physics object definition 7
5 Dataset and event selection 8
6 Analysis strategy: signal, control and validation regions 9
7 Background estimation 11
8 Sources of systematic uncertainties 12
9 Results 15
1 Introduction
The Large Hadron Collider (LHC) Run 2 has provided the possibility to study pp collisions at 13 TeV centre-of-mass energy for the first time, and has thus opened a new discovery window for physics beyond the Standard Model (SM). The presented analysis is an inclusive search for new physics phenomena resulting in final state signatures of lepton-jet resonances in the first 3.2 fb−1of 13 TeV data collected by the ATLAS detector. Such phenomena may not have been kinematically accessible at the lower Run 1 centre-of-mass energy of 8 TeV. As a benchmark signal model, scalar leptoquarks decaying to jets and leptons were used.
Leptoquarks (LQ) feature in a number of theories [1–7] which extend the SM, such as grand unified theories and models with quark and lepton substructure. LQs possess non-zero baryon and lepton numbers and their existence would provide a connection between quarks and leptons. This could help explain the observed similarity of the quark and lepton sectors in the SM. LQs carry a colour-triplet charge and a fractional electric charge [8]. They can be scalar or vector bosons and they decay directly to lepton–quark pairs. The analysis presented in this paper focuses on the pair production of scalar leptoquarks.
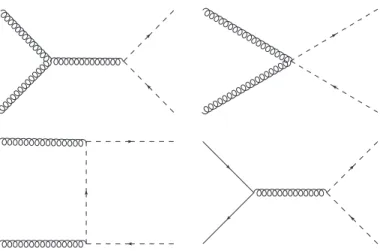
√ βλ LQ
l
q
Figure 1: Feynman diagram showing the Yukawa coupling λ`=
√
βλ between a leptoquark, a lepton (`) and a quark (q).
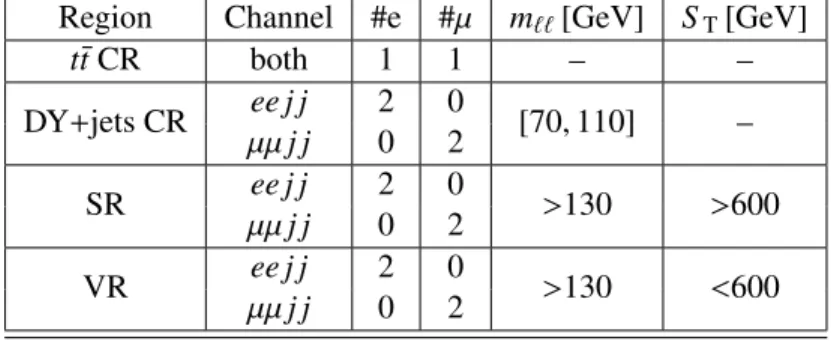
A single Yukawa coupling (λ`) governs the interaction strength between a scalar LQ and a given quark (q) and lepton (`) pair. A Feynman diagram showing a LQ decay is shown in Figure1. The couplings are determined by two free parameters of the model: the branching ratio into charged leptons, β, and the coupling parameter, λ. The coupling to a charged lepton and a quark is given by λ` = √βλ, the coupling to a neutrino and a quark by λν = p1 − βλ. The pair-production cross section of leptoquarks in pp collisions is largely insensitive to the coupling values, since the basic processes of LQ pair-production are gluon fusion and quark–antiquark annihilation. Example leading-order diagrams are shown in Figure2. At a centre-of-mass energy of √s= 13 TeV, gluon fusion is the dominant process. For LQ masses (mLQ) up to a few hundred GeV, it contributes up to 95% of the total cross section. Above mLQ= 1.5 TeV, the contribution from quark–antiquark annihilation amounts to about 30% [9]. Therefore, the parameter of interest – apart from the LQ mass – is the branching ratio β.
Figure 2: Dominant leading-order Feynman diagrams for the pair production of scalar leptoquarks from gluon fusion and quark–antiquark annihilation.
The signal benchmark model for LQ production used in this analysis is the minimal Buchmüller– Rückl–Wyler model (mBRW) [10]. In this approach a number of constraints are imposed on the LQ properties. Lepton number and baryon number are separately conserved to prevent fast proton decay. The LQ couplings are also considered to be purely chiral. Furthermore, it is assumed that LQs belong to three generations (first, second and third) which interact only with lepton–quark pairs within the same generation. With this assumption, lepton-flavour violation is suppressed. However, in a more generic picture of leptoquarks, a LQ may couple to a quark and a lepton belonging to different generations [11]. Although the results of this search were not explicitly interpreted in this type of model, the event selections used were designed to retain sensitivity to leptoquark models in which decays into first or second generation leptons and bottom-quarks (b) are possible.
Previous searches for pair-produced LQs have been performed by the ATLAS and CMS collabor-ations [12–24] at √s = 7 and 8 TeV. The existence of scalar LQs with masses up to 1050 GeV and 1000 GeV (for β= 1) for first- and second-generation scalar LQs, respectively, is excluded at 95% confidence level (CL) by ATLAS [20] in a study performed at √s=8 TeV using 20 fb−1 of integrated luminosity. The CMS experiment similarly excluded first- and second-generation scalar leptoquarks up to masses of 1010 GeV and 1080 GeV (for β= 1), respectively [21].
In this paper, searches for the pair-production of leptoquarks of the first (LQ1) and second (LQ2) generations, based on events containing exactly two electrons or muons and at least two jets (de-noted by eejj and µµjj, respectively), are reported. In order to keep the search as inclusive as possible, it was not required that the charges of the two leptons in an event must be opposite. Sim-ilarly, no selections on the jet flavour were introduced so as not to exclude possible LQ → eb and LQ → µb decays.
2 The ATLAS detector
The ATLAS experiment [25] is a multi-purpose detector with a forward-backward symmetric cyl-indrical geometry and nearly 4π coverage in solid angle1. The three major sub-components of ATLAS are the tracking detector, the calorimeter and the muon spectrometer. Charged-particle tracks and vertices are reconstructed by the inner detector (ID) tracking system, comprising silicon pixel (including the newly installed innermost pixel layer), and microstrip detectors covering the pseudorapidity range |η| < 2.5, and a straw tube tracker that covers |η| < 2.0. The ID is immersed in a homogeneous 2 T magnetic field provided by a solenoid. Electron, photon, jet and τ lepton energies are measured with sampling calorimeters. The ATLAS calorimeter system covers a pseu-dorapidity range of |η| < 4.9. Within the region |η| < 3.2, electromagnetic calorimetry is provided by barrel and endcap high-granularity lead/liquid argon (LAr) calorimeters, with an additional thin LAr presampler covering |η| < 1.8, to correct for energy loss in material upstream of the calor-imeters. Hadronic calorimetry is provided by a steel/scintillator-tile calorimeter, segmented into three barrel structures within |η| < 1.7, and two copper/LAr hadronic endcap calorimeters. The forward region (3.1 < |η| < 4.9) is instrumented by a LAr calorimeter with copper (electromag-netic) and tungsten (hadronic) absorbers. Surrounding the calorimeters is a muon spectrometer (MS) with superconducting air-core toroids, providing bending powers of 3 Tm in the barrel and 6 Tm in the endcaps. The MS includes a system of precision tracking chambers providing coverage over |η| < 2.7. Three stations of precision tracking chambers are used to measure the curvature of tracks. The MS also contains detectors with triggering capabilities over |η| < 2.4 to provide fast muon identification and momentum measurements.
The ATLAS two-level trigger system is used to select events considered in this paper. The first-level trigger is hardware-based while the second, high-first-level trigger is implemented in software and employs algorithms similar to those used offline in the full event reconstruction.
3 Signal and background simulations
The Pythia 8.160 [26] Monte Carlo (MC) model, based on leading-order (LO) matrix-element calculations supplemented with parton showers, was used with the ATLASA14 [27] set of tuned parameters (tune) for the underlying event, together with the NNPDF23LO [28] parton distribu-tion funcdistribu-tions (PDFs), to produce simulated samples of pair-produced first- and second-generadistribu-tion scalar LQs. Leptoquarks of the first (second) generation decay to e+e−u¯u (µ+µ−c¯c) final states. Samples were produced for LQ masses in the range of 500–1500 GeV. As was also done in the
1ATLAS uses a right-handed coordinate system with its origin at the nominal interaction point (IP) in the centre of the
detector and the z-axis along the beam pipe. The x-axis points from the IP to the centre of the LHC ring, and the y-axis points upward. Cylindrical coordinates (r, φ) are used in the transverse plane, φ being the azimuthal angle around the
previous ATLAS publication [20], the value of the coupling parameter λ was set to √0.01 × 4πα, where α is the fine-structure constant. This value of λ determines the leptoquark natural width, which is less than 100 MeV and is smaller than the detector resolution for the reconstruction of leptoquark mass. It also leads to a LQ lifetime sufficiently small such that LQs in the mass range considered in this work would decay promptly. Next-to-leading-order (NLO) calculations [9] of the cross sections for scalar leptoquark pair-production were used to normalise the signal samples. The dominant SM backgrounds arise from processes which can produce a final state containing two reconstructed high transverse momentum (pT) leptons (electrons or muons) and jets. Simulated samples were made of Drell–Yan production (q ¯q → Z/γ∗ → `+`−) and the production of t¯t, diboson (WW, WZ, and ZZ) and single top-quarks in association with a W boson.
Drell–Yan events with associated jets were simulated using the Sherpa 2.1.1 [29] generator. Matrix elements were calculated for up to two partons at NLO and four partons at LO using the Comix [30] and OpenLoops [31] matrix-element generators and merged with the Sherpa parton shower [32] using the ME+PS@NLO prescription [33]. The CT10 PDF set [34] was used in conjunction with dedicated parton-shower tuning developed by the authors of Sherpa [32].
For the generation of t¯t and single top quarks in the Wt channel, the Powheg-Box v2 generator [35–
38] with the CT10 PDF set in the matrix-element calculations was used. For both processes the parton shower, fragmentation, and the underlying event were simulated using Pythia 6.428 [39] with the Perugia 2012 tune [40] and using the Cteq6L1 PDF set [41]. The top-quark mass was set to 172.5 GeV. The EvtGen v1.2.0 program [42] was used to simulate the bottom and charm hadron decays.
Diboson processes with four charged leptons, three charged leptons+ one neutrino or two charged leptons and two neutrinos were simulated using the Sherpa 2.1.1 generator. Matrix elements con-tain all diagrams with four electroweak vertices. They were calculated for up to one (4`, 2`+2ν) or zero partons (3`+1ν) at NLO and up to three partons at LO using the Comix and OpenLoops matrix element generators and merged with the Sherpa parton shower using the ME+PS@NLO prescrip-tion. Diboson processes with one of the bosons decaying hadronically and the other leptonically were simulated using the same Sherpa version.
All samples of simulated events include the effect of multiple proton–proton interactions in the same or neighbouring bunch crossings (pile-up) which were modelled by overlaying simulated minimum-bias events on each generated signal and background event. These multiple interactions were simulated with the soft QCD processes of Pythia 8.186 [26] using tune A2 [43] and the MSTW2008LO PDF set [44]. The number of overlaid events was chosen to match the average number of interactions per pp bunch crossing observed in the data as it evolved throughout the data-taking period (giving an average of 14 interactions per crossing for the whole data-data-taking period). The SM background samples were processed through the GEANT4-based detector simulation [45,
46], while a fast simulation using a parameterisation of the performance of the calorimeters [47] and GEANT4 for the other parts of the detector was used for the signal samples and some samples
used for studies of systematic uncertainties. The standard ATLAS reconstruction software was used for both simulated and collision data.
Estimates of the cross sections of background processes were taken from the following theoret-ical predictions. Single-top production was calculated at NLO+next-to-next-to-leading-logarithm (NNLL) accuracy [48]. Estimates of Drell–Yan and t¯t production cross sections at NLO [29] and NLO+NNLO [49] accuracy, respectively, were used.
4 Physics object definition
The electron energy was measured using its associated cluster of electromagnetic-calorimeter cells with significant energy deposits, whereas the direction was determined by the track associated with this cluster. To identify and select electrons, requirements were placed on the shape of the cluster, on the quality of the associated track, and on the degree of matching between the track and cluster. Electron candidates must have transverse energy ET > 30 GeV and |η| < 2.47. Electron candid-ates associated with clusters in the transition region between the barrel and endcap calorimeters (1.37< |η| < 1.52) were not considered. All electrons must be reconstructed with a cluster-based or a combined cluster- and track-based algorithm [50]. Furthermore, the impact parameters of the electron track relative to the beam line were required to satisfy |d0/σd0|< 5 and |z0sin θ| < 0.5 mm,
where d0, σd0 and z0are the transverse impact parameter, its uncertainty, and the longitudinal
im-pact parameter, respectively. In addition, electron isolation requirements were imposed on the summed transverse momentum of tracks (transverse energy of clusters) in a cone around the elec-tron track (cluster barycentre). The radius of the cone around the track is∆R = 10 GeV/pT for pT > 50 GeV and 0.2 otherwise.2 For the cluster isolation, a fixed cone radius size of 0.2 is used. The efficiency of these isolation criteria is higher than 99%. The reconstruction efficiency is higher than 98% in most regions of transverse momentum and pseudorapidity. The identification effi-ciency varies between 75% and 92%, rising as a function of ET[51]. All of these efficiencies refer to the efficiency for a single electron, independent of the specific event topology.
Muon tracks were reconstructed independently in the ID and the MS. These muon tracks were required to have a minimum number of associated hits in each system and to satisfy geometrical and momentum matching criteria. The two tracks were then used as input to a combined fit which takes into account the energy loss in the calorimeter and multiple-scattering effects [52]. To improve momentum resolution and ensure a reliable measurement at very high momenta, muon tracks were required to have at least three hits in each of the three precision chambers in the MS. Tracks which traverse precision chambers with poor alignment were rejected. Finally, measurements of charge over momentum, performed independently in the ID and MS, were required to agree within seven standard deviations of the sum in quadrature of the uncertainties in the corresponding ID and MS
2 Here,∆R = p(∆η)2+ (∆φ)2is a cone defined by differences in pseudorapidity and azimuthal angle. p
Tis given in
measurements. Muon candidates were required to have pT> 40 GeV and |η| < 2.5. Those falling in the overlap region of the MS barrel and endcap (1.01 < |η| < 1.10) were rejected due to the potential pT mismeasurement resulting from relative barrel–endcap misalignment. Muon candidates were required to fulfil |d0/σd0|< 3 and |z0sin θ|< 0.5 mm. In order to reduce the background from
light-and heavy-hadron decays within jets, muons were required to fulfil isolation requirements. The track-based isolation variable used is the sum of the transverse momenta of the tracks in a cone around the muon of size ∆R = 10 GeV/pµT, excluding the muon itself and with pµT in GeV. The isolation efficiency is greater than 99%. The efficiency for reconstructing and identifying muons using the criteria described above is typically greater than 80% for the transverse momentum and pseudorapidity selections used in this work [53]. As for electrons, these efficiencies refer to single
objects.
The anti-ktalgorithm [54] with a radius parameter R= 0.4 was used to reconstruct jets from energy clusters in the calorimeter [55]. Jet calibration is performed using energy- and η-dependent correc-tion factors derived from simulacorrec-tions together with further correccorrec-tions from in situ measurements. The jets used in this work must satisfy pT> 50 GeV and |η| < 2.8. Further selections were applied to ensure that all jets considered are well measured [56]. A description of the jet energy scale meas-urement and its associated systematic uncertainties can be found in Ref. [57]. Jet-flavour tagging techniques were not used in this paper and, as a consequence, good sensitivity was maintained for LQ decays into a lepton plus any quark flavour barring the top quark.
Ambiguities in the object identification during reconstruction, i.e. when a reconstructed object matched multiple object identification hypotheses (electron, muon, jet), were resolved in the fol-lowing way. First, electrons were removed if they shared their track with a muon. In a second step, ambiguities between electrons and jets were removed; if the two objects had∆R < 0.2 the jet was rejected; if 0.2 <∆R < 0.4 the electron was rejected. Finally, muon–jet ambiguities were resolved as follows: if the muon and jet were closer than∆R = 0.4 the jet was rejected if it has less than three tracks, otherwise the muon was rejected. For the definition of signal and control regions (see Section6) only objects remaining after this procedure were considered.
5 Dataset and event selection
Proton–proton collision data at a centre-of-mass energy of √s= 13 TeV, collected by the ATLAS detector at the LHC during 2015, were used. After applying data quality criteria, the dataset cor-responds to an integrated luminosity of 3.2 fb−1.
Events considered in the search were selected by the ATLAS two-level trigger system [58]. In the eejjchannel, a two-electron trigger was used with an ETthreshold of 17 GeV for each electron. The µµjj search used events selected by either of two single-muon triggers. The first trigger has a muon pT threshold of 26 GeV and additional requirements on its properties. In particular, it requires the muon to be isolated, which leads to a loss in efficiency at high pT. To retain a high trigger efficiency
in the region of high pT, the second trigger, which has a pT threshold of 50 GeV but no additional requirements, was used. The trigger efficiencies for the eejj and µµjj searches exceed 90% for the object kinematics considered in this analysis.
Multiple pp interactions during bunch crossings lead to events containing a number of reconstruc-ted vertices. The primary vertex of the event is defined as that vertex with the largest sum of squared transverse momenta of its associated tracks. Events which contain a primary vertex with at least two associated tracks satisfying pT,track > 0.4 GeV were selected. Furthermore, MC events were given a per-event weight to correct for differences in the distribution of the average number of pp interactions per bunch crossing between data and simulation.
Only events with exactly two charged leptons and at least two jets were considered for this ana-lysis. Scale factors were applied as event weights to correct the MC description of lepton trigger, reconstruction, identification, isolation and impact-parameter cut efficiencies. A description of the derivation of the scale factors, obtained by comparing data and MC predictions in dedicated studies, can be found in Refs. [50,59].
6 Analysis strategy: signal, control and validation regions
The analysis presented here used signal (SR), control (CR) and validation (VR) regions to optimise signal significance and to constrain the normalisation of the main background sources. The latter are Drell–Yan events containing Z/γ∗ → e+e−, µ+µ−+jets processes (hereafter termed DY+jets) and t¯t events in which both top quarks decay leptonically. The signal, control and validation regions were defined using the following discriminating observables:
• The dilepton invariant mass: m``.
• The scalar sum ST of the transverse momentum of the two leptons and of the two leading jets.
• The minimum invariant mass of the two lepton–jet pairs in an event, mminLQ. The lepton–jet pairs were chosen such that the invariant mass difference between them was smallest. The lower mass of the two combinations was chosen as the discriminating variable following dedicated sensitivity studies.
The signal region was defined by requiring m`` > 130 GeV and ST > 600 GeV. The cut on m`` was chosen to reduce the DY+jets background. The cut on ST was optimised by maximising the discovery significance [60] for LQs with masses between 500 GeV and 1500 GeV, i.e. by perform-ing a likelihood fit (described in more detail at the end of this section) usperform-ing the mminLQ distribution defined above for STvalues between 0 and 3 TeV in steps of 100 GeV. This study showed that there is little dependence of the optimised STvalue on the LQ mass when using the shape information of the mass spectrum. It was confirmed that the approach used in previous results, i.e. a cut-and-count
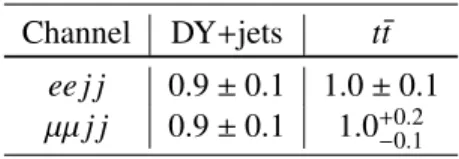
Table 1: Definition of control, signal and validation regions. In all regions, at least two jets were required.
Region Channel #e #µ m``[GeV] ST[GeV]
t¯tCR both 1 1 – – DY+jets CR µµ j jee j j 2 0 [70, 110] – 0 2 SR µµ j jee j j 2 0 >130 >600 0 2 VR µµ j jee j j 2 0 >130 <600 0 2
analysis in several signal regions defined by varying cuts on the three variables mentioned above, does not give better sensitivity.
The signal selection efficiency is defined as the fraction of all simulated signal events, generated across the full phase space, that survive the trigger and the final SR selection. For leptoquarks of the first (second) generation, the overall selection efficiency rises from around 62% to 71% (38% to 43%) as the mass increases from 500 GeV to 1500 GeV. The lower efficiency for second-generation leptoquarks is due to the muon track requirements, which demand hits in three MS stations, and which are needed to give an optimal momentum resolution at high pT for this analysis.
Three non-overlapping control regions with negligible signal contamination were defined. Di ffer-ences in the predicted and observed event yields in these regions were used to evaluate scale factors which were used to normalise the MC predictions for the t¯t and DY+jets backgrounds in the SRs. The two DY+jets CRs – one for the eejj and one for the µµjj channel – were defined by requiring at least two jets and exactly two same-flavour leptons with a dilepton invariant mass restricted to a window around the Z boson mass: 70 < m`` < 110 GeV. The t¯t control region requires at least two jets, exactly one muon and exactly one electron: these events were selected with the same single-muon triggers as described in Section5. This control region is common to both channels. Validation regions were used to verify that data and MC predictions agree in a phase space close to the signal regions, but still with a negligible signal contamination. This was achieved by applying the same selection as for the signal region, but inverting the cut on ST, i.e. allowing only values below 600 GeV.
The requirements for the various regions are collected in Table1.
For the statistical analysis, a profile-likelihood fit of signal plus background templates to the data was performed using the HistFitter package [61]. Systematic uncertainties, which are discussed in Section8, were incorporated into the likelihood as constrained nuisance parameters. The fit was performed in the CRs and the SR simultaneously and was used to extract normalisation factors, i.e. scaling corrections to the event yields predicted by theoretical cross-section calculations, described
in Section 3. In the CRs, only the event yield was used to extract the dominant background (t¯t and DY+jets) normalisation factors. In the SR, both the normalisation and the shape of mminLQ distribution were used in the fit to extract the signal normalisation factor. The templates of the mminLQ shape consisted of ten bins: six bins of 100 GeV width from 0 to 600 GeV and four bins of 200 GeV width that cover the range up to 1.4 TeV. The template for the signal was derived from MC predictions. For the background templates, MC predictions as well as data-driven techniques were used, as detailed in the following section.
7 Background estimation
Normalisation factors for the MC predictions of the two main SM backgrounds (DY+jets and t¯t) were estimated with a fit to the data, as described in Section6. In total, four normalisation factors were calculated: one each for t¯t and DY+jets events in both the electron and muon channels. Smaller background contributions arise from the production of a single top quark in the Wt channel, diboson events and Z → ττ+jets events. These were estimated purely from simulation, i.e. their normalisation was not a free parameter in the combined fit.
Misidentified or non-prompt leptons originating from hadron decays or photon conversions can arise in multi-jet events, single top production in the s- or t-channel, W+jets and t¯t events (with at least one top quark decaying hadronically). This fake-lepton background is negligible in the µµjj channel. In the eejj channel it was evaluated using the same data-driven method as in Ref. [62]. This method was used to evaluate the migration of events among four different data samples: the nominal SR and three analogous samples selected with modified electron selection criteria. The mi-gration between different regions can be described by a matrix, the elements of which are functions of the proportions of true and fake electrons. As a simplification of Ref. [62], the fake and real rates were evaluated as a function of pT only, since they were observed to be independent of η within the required accuracy. They were considered to be the same for all electron candidates in an event. The fake background estimation suffers from low statistical precision. Its statistical uncertainty was treated as one source of the systematic uncertainty in the total background modelling.
Figure3shows the dilepton invariant mass for pairs of electrons (a) and muons (b) in events con-taining exactly two reconstructed same-flavour leptons and at least two reconstructed jets, following the selections given in Section5. This selection stage is also referred to as preselection. The predic-tions of various background sources are compared with the data. The hatched bands show the total systematic uncertainty in the background prediction. Within the uncertainties, agreement between data and simulation is observed. Normalisation factors for the MC predictions for DY+jets and t¯t events are not applied in the plot.
Figure4shows the spectrum of the minimum reconstructed lepton–jet mass in the t¯t control region before the fit. Within uncertainties, the data and MC distributions are consistent.
0 200 400 600 800 1000 Events / 100 GeV 1 − 10 10 3 10 5 10 7 10 ATLAS -1 13 TeV, 3.2 fb eejj, preselection Data DY + jets t t Diboson Fake lepton Single top [GeV] ee m 0 200 400 600 800 1000 Data / MC 0.5 1.0 1.5 (a) 0 200 400 600 800 1000 Events / 100 GeV 1 − 10 10 3 10 5 10 7 10 ATLAS -1 13 TeV, 3.2 fb jj, preselection µ µ Data DY + jets t t Diboson Single top [GeV] µ µ m 0 200 400 600 800 1000 Data / MC 0.5 1.0 1.5 (b)
Figure 3: Dilepton invariant mass for pairs of (a) electrons and (b) muons in events containing exactly two reconstructed same-flavour leptons and at least two reconstructed jets. Data are compared to the background prediction. The DY+jets and t¯t expectations are shown without the normalisation factors from the fit de-scribed in Section6. The hatched bands show the total systematic uncertainty in the background prediction.
8 Sources of systematic uncertainties
The following sources of systematic uncertainty were considered:
• The uncertainty in the integrated luminosity is 5%. It was derived following a methodology similar to that detailed in Ref. [63], from a calibration of the luminosity scale using x–y beam-separation scans performed in August 2015. This uncertainty affects the predicted signal event yield and those background rates for which theoretical estimates are used. • The jet energy scale (JES) uncertainty depends on the pT and η of the jet and on the pile-up
conditions in an event. A further uncertainty in the jet energy resolution (JER) was taken into account. These sources each correspond to uncertainties in the jet energy of up to 3%. The largest resulting uncertainty in the background event yields is about 10% in the control regions. In the signal region, the uncertainty in the event yields amounts to at most 5% for the background and less than 1% for the signal.
• The uncertainty in the lepton trigger efficiency scale factors is around 2% for the kinematic region considered here.
0 200 400 600 800 1000 Events / 100 GeV 1 − 10 1 10 2 10 3 10 4 10 5 10 ATLAS -1 13 TeV, 3.2 fb CR t t Data t t Diboson Single top Fake lepton [GeV] min LQ m 0 200 400 600 800 1000 Data / MC 0.5 1.0 1.5
Figure 4: Minimum reconstructed lepton–jet invariant mass in the t¯t control region. Data are compared to the background prediction. The t¯t prediction is shown without the normalisation factor from the fit described in Section6. The hatched bands show the total systematic uncertainty in the background prediction.
• Differences between the MC and data in the efficiency of the isolation requirement on the selected muons correspond to uncertainties of 1–5% on the scale factor to correct the MC prediction. Other muon-related uncertainties arise from the momentum scale, resolution, and quality criteria and typically affect the muon event yields by around 1% in all regions for both signal and background.
• Uncertainties in the electron energy scale, identification and isolation affect the electron event yields by up to 2% in all regions for both signal and background.
• Uncertainties due to choices that have to be made in the event generation which affect final-state observables were estimated for the two major background sources: t¯t and DY+jets. These modelling uncertainties refer to e.g. possible differences in the generation of the hard scattering, scale dependencies, the parton shower and hadronisation and fragmentation models. Differences in the background modelling can change the event yields (total normal-isation) in the CRs. Moreover, there is an uncertainty in the shape of the mminLQ distribution in the signal region due to background modelling effects. This was estimated as one uncertainty per mminLQ-bin in the signal region and propagated to the normalisation factor by the fit. The uncertainties were treated as uncorrelated between different bins.
The impact of modelling uncertainties in final-state predictions for t¯t processes was quanti-fied by comparing various simulated samples: differences due to the parton shower as well as the hadronisation and fragmentation model were estimated by comparing the nominal sample to one that uses Herwig++ [64], effects of additional or reduced radiation were
es-timated by varying the parton-shower and scale parameters within Pythia, and an alternative generator (aMC@NLO [65] with Herwig++) was used to estimate differences in the hard scatter generation. The total uncertainty in the predicted t¯t event yield varies between 14% (in the t¯t CR) to about 30% (in the signal regions).
Modelling uncertainties for the DY+jets background were assessed with different approaches, simulation-based, as well as data-driven in different regions of phase space. The baseline es-timate used events from the DY+jets control region with ST higher than 600 GeV. In this region, the shapes of both the mminLQ and STdistributions are very similar to those in the signal region, which differs only by the cut on the dilepton invariant mass. This cut was found to not affect the shapes of the other discriminating variables. The difference between the data and the background prediction in this region was used as an estimate of the modelling uncer-tainty.
The result was cross-checked using simulated samples in which the renormalisation, factor-isation and resummation scales, as well as the scale for matrix element and parton shower matching, were independently varied up and down by a factor of two. Within the statistical uncertainties resulting from the limited number of events in these samples, the estimate from the data-driven approach was confirmed. The result is a 10% uncertainty in the DY+jets event yield in the control regions and 20% in each mminLQ bin in the signal region.
• PDF uncertainties on the t¯t and DY+jets normalisation as well as the mminLQ shape amount to less than 4% and do not affect the final result given the large modelling uncertainties described above.
• The effects of higher-order contributions on the signal cross section were estimated by vary-ing the QCD renormalisation and factorisation scales, set to a common value, up and down by a factor of two, as done in Ref. [9]. One half of the difference between the predicted cross
section for the increased and reduced scale choice is used as the cross section uncertainty for a given mass. This uncertainty lies in the the range 12–17% for the mass points considered in this paper.
• The impact of theoretical uncertainties related to the parton-shower algorithm and multiple-interactions tune were evaluated by varying the corresponding parameters, as specified in Ref. [66]. This leads to an uncertainty in signal acceptance of up to 2%.
• The uncertainty in the signal cross section due to the choice of PDF set was calculated as the envelope of the predictions of 40 different CTEQ6.6 NLO error sets [9]. The uncertainty ranges from 11% at mLQ = 500 GeV to 34% at mLQ = 1500 GeV. The predicted signal acceptance was studied using NNPDF23LO [28], CT14 [67] and MMHT14 [68] PDF sets. The acceptance is very insensitive to the choice of parton distribution function; the systematic uncertainty from this source is less than 1%.
Table 2: Normalisation factors for the main backgrounds obtained from the combined fit in each of the channels. Channel DY+jets t¯t ee j j 0.9 ± 0.1 1.0 ± 0.1 µµ j j 0.9 ± 0.1 1.0+0.2−0.1
9 Results
The results are consistent with SM expectations. The normalisation factors obtained in the fit described in Section6are summarised in Table2. Similar results are obtained in the two channels and the normalisation factors are found to be compatible with unity within the uncertainties. The reliability of extrapolating the background predictions from the control regions to the signal region was checked in the VRs defined in Section6. The distribution of mminLQ in the two validation regions is compared to the background prediction after the fit in Figure5. Within the uncertainties, the predictions are compatible with the observed data.
The observed and expected event yields in the signal regions for the eejj and the µµjj channels, after the fits, are shown in Tables3and4, respectively. The values in these tables are intended to illustrate the sensitivity independent of a specific signal hypothesis and thus, in this case, the fit was performed using only the control regions as input. The resulting fit parameters (DY+jets and t¯t normalisation factors and values of the nuisance parameters) were transferred to the signal region, using appropriate transfer factors based on the MC models. The different contributions to the back-ground do not necessarily exactly sum to the total quoted number of backback-ground events owing to the rounding scheme used. The dominant experimental systematic uncertainties in the background prediction arise from uncertainties on corrections to the simulated electron and muon trigger e ffi-ciencies and the jet energy scale; the latter source gives an uncertainty of 2–4% in the signal region. The luminosity uncertainty of 5% contributes for simulated backgrounds not constrained by the fit (diboson and single-top production). The theoretical uncertainties after the fit range from 3% to 12% for the DY+jets background and from 3% to 16% for the t¯t background. The global fit takes correlations of the nuisance parameters into account, which results in the uncertainty in the total background being smaller than the quadratic sum of the uncertainties in the separate components. The contribution of Z → ττ+jets to the background is negligible and not shown in the tables. Figure6shows the SR distribution of mminLQ compared to background predictions based on the com-bined fit in the CRs and the SR. The signal prediction for a LQ of mass 1.1 TeV is also shown. The wider signal shape in the muon channel compared to the electron channel is due the worsening of the muon momentum resolution with increasing momentum. Again, no significant deviation from
0 200 400 600 800 1000 Events / 100 GeV 1 − 10 1 10 2 10 3 10 4 10 5 10 ATLAS -1 13 TeV, 3.2 fb eejj, VR Data t t DY + jets Diboson Fake lepton Single top [GeV] min LQ m 0 200 400 600 800 1000 Data / MC 1 2 (a) 0 200 400 600 800 1000 Events / 100 GeV 1 − 10 1 10 2 10 3 10 4 10 5 10 ATLAS -1 13 TeV, 3.2 fb jj, VR µ µ Data t t DY + jets Diboson Single top [GeV] min LQ m 0 200 400 600 800 1000 Data / MC 1 2 (b)
Figure 5: Minimum reconstructed lepton–jet invariant mass in the validation regions for pairs of (a) electrons and (b) muons. Data are compared to the background prediction. The DY+jets and t¯texpectations are scaled by the normalisation factors obtained from the fit described in Section6. The hatched bands show the total systematic uncertainty in the background prediction.
the SM predictions was observed. Limits on the LQ signal strength were derived using pseudo-experiments and following a modified frequentist CLs method [69]. Apart from the luminosity uncertainty (5%), dominant uncertainties in the signal event yields arise from lepton scale factors and are of the order of 2–5% at low masses and up to 10% at high masses.
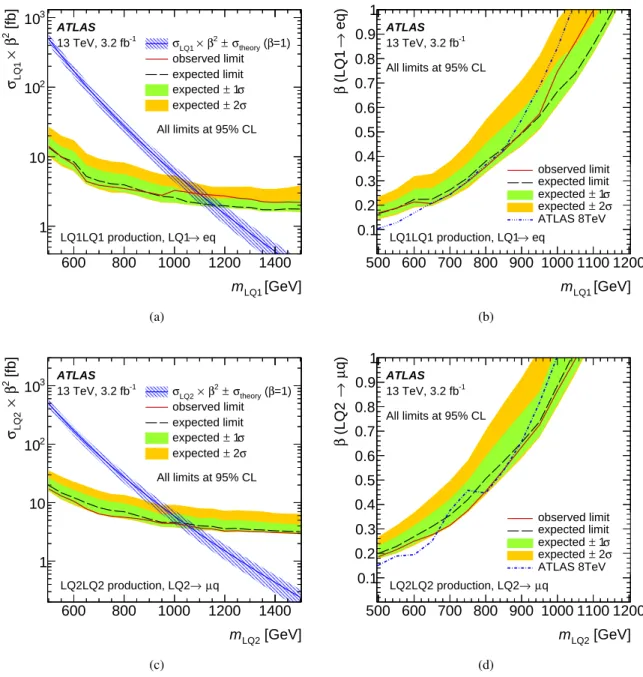
In Figure7, limits on the cross section times branching ratio are shown on the left, for leptoquarks of the first (second) generation in the top (bottom) plot. The expected limit is depicted by the dashed line; the uncertainty bands result from considering all sources of systematic as well as statistical uncertainties. The observed limit is given by the solid line. The NLO pair-production cross section for β = 1 is shown as a line with a shaded band representing the uncertainties. The shaded band around it illustrates the uncertainties in the theoretical prediction due to PDF and scale uncertainties. The intersection of this line with the cross-section limits yields the lower limit on the leptoquark mass for a value of β = 1. These observed (expected) limits are found to be 1100 GeV (1160 GeV) and 1050 GeV (1040 GeV) for first- and second-generation LQs, respectively. The observed limit for each channel is stronger than the previous bound [20] by 50 GeV. The expected limits are improved by 110 GeV for the first-generation search and by 40 GeV in the second generation search. The theoretical cross section was scaled by β2 and then used to obtain the limits on the branching ratio as a function of the LQ mass shown on the right
Table 3: Observed and predicted event yields in the signal and control regions in the eejj channel. The background prediction with its total uncertainty after the fit is shown. The fit is performed using only the control regions as input. The lower part of the table shows the separate contributions from the different background processes and their total uncertainty after the fit. In addition, the expected signal event yields for β= 1 and LQ masses of 500,1000, and 1500 GeV are given.
SR CR DY+jets CR t¯t
Observed events 279 20328 5194
Total background events 300 ± 30 20300 ± 200 5200 ± 50
Fitted DY+jets events 74 ± 7 19100 ± 200 < 0.01
Fitted t¯t events 190 ± 30 1060 ± 10 4840 ± 40
MC predicted diboson events 12.5 ± 0.6 63 ± 3 115 ± 6
MC predicted single-top events 20 ± 1 42 ± 2 230 ± 10
Estimated fake-lepton events 9 ± 4 120 ± 10 6 ± 3
MC exp. signal events (mLQ= 500 GeV) 1000 ± 100 26 ± 4 < 0.01
MC exp. signal events (mLQ= 1000 GeV) 13 ± 2 0.03 ± 0.00 < 0.01
MC exp. signal events (mLQ= 1500 GeV) 0.6 ± 0.1 < 0.01 < 0.01
of Figure 7. Below LQ masses of 650 GeV, the limits on β are weaker than those obtained at 8 TeV centre-of-mass energy, which are shown as the dashed-dotted line, owing to the much lower integrated luminosity collected in 2015 and the effects of background at lower LQ masses. At high masses (above 900 GeV), however, the gain in the production cross section at 13 TeV compensates for the smaller luminosity and stronger bounds than at 8 TeV are obtained. In the intermediate mass region, the results are comparable. Mass limits for various values of β are summarised in Table5.
Table 4: Observed and predicted event yields in the signal and control regions in the µµjj channel. The background prediction with its total uncertainty after the fit is shown. The fit is performed using only the control regions as input. The lower part of the table shows the separate contributions from the different background processes and their total uncertainty after the fit. Where no number is given, the contribution is found to be negligible. In addition, the expected signal event yields for β= 1 and LQ masses of 500,1000, and 1500 GeV are given.
SR CR DY+jets CR t¯t
Observed events 188 10233 5194
Fitted background events 200 ± 30 10200 ± 100 5200 ± 70
Fitted DY+jets events 56 ± 8 9800 ± 100 9 ± 1
Fitted t¯t events 120 ± 30 400 ± 20 4840 ± 80
MC predicted diboson events 8.6 ± 0.6 32 ± 3 115 ± 10
MC predicted single-top events 12.8 ± 0.9 18 ± 2 230 ± 20
Estimated fake-lepton events – – –
MC exp. signal events (mLQ= 500 GeV) 610 ± 40 25 ± 2 3 ± 3
MC exp. signal events (mLQ= 1000 GeV) 8.0 ± 0.8 0.08 ± 0.01 0.1 ± 0.1
0 500 1000 Events / 100 GeV 1 − 10 1 10 2 10 3 10 ATLAS -1 13 TeV, 3.2 fb eejj, SR Data t t DY + jets Diboson Fake lepton Single top LQ 1.1 TeV [GeV] min LQ m 0 500 1000 Data / MC 0.5 1.0 1.5 (a) 0 500 1000 Events / 100 GeV 1 − 10 1 10 2 10 3 10 ATLAS -1 13 TeV, 3.2 fb jj, SR µ µ Data t t DY + jets Diboson Single top LQ 1.1 TeV [GeV] min LQ m 0 500 1000 Data / MC 0.5 1.0 1.5 (b)
Figure 6: Distribution of the minimum reconstructed LQ candidate mass, mmin
LQ, in the signal region of (a)
the first-generation leptoquark search and (b) the second-generation search. Data are compared to the back-ground prediction. The DY+jets and t¯t expectations are scaled by the normalisation factors obtained from the fit described in Section6. The signal expectation for a LQ of mass 1.1 TeV is also shown. The hatched bands show the total systematic uncertainty in the background prediction.
[GeV] LQ1 m 600 800 1000 1200 1400 [fb] 2 β × LQ1 σ 1 10 2 10 3 10 ATLAS -1 13 TeV, 3.2 fb eq → LQ1LQ1 production, LQ1 All limits at 95% CL =1) β ( theory σ ± 2 β × LQ1 σ observed limit expected limit σ 1 ± expected σ 2 ± expected (a) [GeV] LQ1 m 500 600 700 800 900 1000 1100 1200 eq) → (LQ1 β 0.1 0.2 0.3 0.4 0.5 0.6 0.7 0.8 0.9 1 ATLAS -1 13 TeV, 3.2 fb eq → LQ1LQ1 production, LQ1 All limits at 95% CL observed limit expected limit σ 1 ± expected σ 2 ± expected ATLAS 8TeV (b) [GeV] LQ2 m 600 800 1000 1200 1400 [fb] 2 β × LQ2 σ 1 10 2 10 3 10 ATLAS13 TeV, 3.2 fb-1 q µ → LQ2LQ2 production, LQ2 All limits at 95% CL =1) β ( theory σ ± 2 β × LQ2 σ observed limit expected limit σ 1 ± expected σ 2 ± expected (c) [GeV] LQ2 m 500 600 700 800 900 1000 1100 1200 q) µ → (LQ2 β 0.1 0.2 0.3 0.4 0.5 0.6 0.7 0.8 0.9 1 ATLAS -1 13 TeV, 3.2 fb q µ → LQ2LQ2 production, LQ2 All limits at 95% CL observed limit expected limit σ 1 ± expected σ 2 ± expected ATLAS 8TeV (d)
Figure 7: The cross-section limits (a) on scalar LQ pair production times the square of the branching ratio as a function of mass and (b) limits on the branching ratio as a function of mass for first-generation leptoquarks. Analogous limits are shown for second-generation leptoquarks in (c) and (d). Expected and observed limits are also shown. The uncertainty bands on the expected limit represent all sources of systematic and stat-istical uncertainty. On the left, the expected NLO production cross section (β= 1.0) for scalar leptoquark pair-production and its corresponding theoretical uncertainty due to the choice of PDF set and renormalisa-tion/factorisation scale are also included. The observed limit from the 8 TeV analysis is also shown on plots
Table 5: Expected and observed 95% CL lower limits on first- and second-generation leptoquark masses for different assumptions of β.
β
95% CL limit on
mLQ1[GeV] mLQ2[GeV]
Expected Observed Expected Observed
1.00 1160 1100 1040 1050
0.75 1050 1000 950 960
0.50 900 900 800 830
0.25 680 700 580 600
10 Summary and conclusions
Searches for first- and second-generation scalar leptoquarks, pair-produced in pp collisions at 13 TeV centre-of-mass energy, have been performed with the ATLAS detector at the LHC. An integrated luminosity of 3.2 fb−1 of data was used. No significant excess above the SM back-ground expectation was observed in either channel. The results were interpreted in the framework of the mBRW model. Mass-dependent limits were derived on the pair-production cross section times the square of the branching ratio (β2) and on β. For β= 1, the observed (expected) LQ mass limits at 95% CL are 1100 GeV and 1050 GeV (1160 GeV and 1040 GeV) for first- and second-generation leptoquarks, respectively. The observed bounds are more stringent than the previous ATLAS limits by 50 GeV in each channel. This analysis is the first result at 13 TeV using the Run 2 data collected by the ATLAS experiment in a program of high precision inclusive searches for resonant signatures involving a lepton and a jet.
Acknowledgements
We thank CERN for the very successful operation of the LHC, as well as the support staff from our institutions without whom ATLAS could not be operated efficiently.
We acknowledge the support of ANPCyT, Argentina; YerPhI, Armenia; ARC, Australia; BM-WFW and FWF, Austria; ANAS, Azerbaijan; SSTC, Belarus; CNPq and FAPESP, Brazil; NSERC, NRC and CFI, Canada; CERN; CONICYT, Chile; CAS, MOST and NSFC, China; COLCIEN-CIAS, Colombia; MSMT CR, MPO CR and VSC CR, Czech Republic; DNRF and DNSRC, Denmark; IN2P3-CNRS, CEA-DSM/IRFU, France; GNSF, Georgia; BMBF, HGF, and MPG, Ger-many; GSRT, Greece; RGC, Hong Kong SAR, China; ISF, I-CORE and Benoziyo Center, Israel;
INFN, Italy; MEXT and JSPS, Japan; CNRST, Morocco; FOM and NWO, Netherlands; RCN, Norway; MNiSW and NCN, Poland; FCT, Portugal; MNE/IFA, Romania; MES of Russia and NRC KI, Russian Federation; JINR; MESTD, Serbia; MSSR, Slovakia; ARRS and MIZŠ, Slove-nia; DST/NRF, South Africa; MINECO, Spain; SRC and Wallenberg Foundation, Sweden; SERI, SNSF and Cantons of Bern and Geneva, Switzerland; MOST, Taiwan; TAEK, Turkey; STFC, United Kingdom; DOE and NSF, United States of America. In addition, individual groups and members have received support from BCKDF, the Canada Council, CANARIE, CRC, Compute Canada, FQRNT, and the Ontario Innovation Trust, Canada; EPLANET, ERC, FP7, Horizon 2020 and Marie Skłodowska-Curie Actions, European Union; Investissements d’Avenir Labex and Idex, ANR, Région Auvergne and Fondation Partager le Savoir, France; DFG and AvH Foundation, Ger-many; Herakleitos, Thales and Aristeia programmes co-financed by EU-ESF and the Greek NSRF; BSF, GIF and Minerva, Israel; BRF, Norway; Generalitat de Catalunya, Generalitat Valenciana, Spain; the Royal Society and Leverhulme Trust, United Kingdom.
The crucial computing support from all WLCG partners is acknowledged gratefully, in particu-lar from CERN and the ATLAS Tier-1 facilities at TRIUMF (Canada), NDGF (Denmark, Nor-way, Sweden), CC-IN2P3 (France), KIT/GridKA (Germany), INFN-CNAF (Italy), NL-T1 (Neth-erlands), PIC (Spain), ASGC (Taiwan), RAL (UK) and BNL (USA) and in the Tier-2 facilities worldwide.
References
[1] S. K. Dimopoulos and L. Susskind, Mass without scalars,
Nucl.Phys. B B155 (1979) 237–252.
[2] S. Dimopoulos, Technicoloured signatures,Nucl.Phys. B 168 (1980) 69–92. [3] E. Eichten and K. D. Lane, Dynamical Breaking of Weak Interaction Symmetries,
Phys. Lett. B 90 (1980) 125–130.
[4] V. D. Angelopoulos, J. R. Ellis, H. Kowalski et al.,
Search for new quarks suggested by the superstring,Nucl.Phys. B 292 (1986) 59–92. [5] W. Buchmüller and D. Wyler, Constraints on SU(5)-type leptoquarks,
Phys. Lett. B 177 (1986) 377–382.
[6] J. C. Pati and A. Salam, Lepton Number as the Fourth Color,
Phys. Rev. D 10 (1974) 275–289, Erratum: Phys. Rev. D 11,703(1975). [7] H. Georgi and S. Glashow, Unity of All Elementary Particle Forces,
Phys. Rev. Lett. 32 (1974) 438–441.
[9] M. Krämer et al., Pair production of scalar leptoquarks at the CERN LHC,
Phys. Rev. D 71 (2005) 057503, arXiv:hep-ph/0411038 [hep-ph].
[10] W. Buchmüller, R. Rückl and D. Wyler, Leptoquarks in Lepton - Quark Collisions,
Phys. Lett. B 191 (1987) 442–448, Erratum: Phys. Lett. B 448 (1999) 320.
[11] K. A. Olive et al., Review of Particle Physics,Chin. Phys. C 38 (2014) 090001, and 2015 updates, Section on Leptoquarks in ’Hypothetical Particles and Concepts’.
[12] CMS Collaboration, Search for Pair Production of First-Generation Scalar Leptoquarks in pp Collisions at √s= 7 TeV,Phys. Rev. Lett. 106 (2011) 201802,
arXiv:1012.4031 [hep-ex].
[13] CMS Collaboration, Search for Pair Production of Second-Generation Scalar Leptoquarks in pp Collisions at √s= 7 TeV,Phys. Rev. Lett. 106 (2011) 201803,
arXiv:1012.4033 [hep-ex].
[14] ATLAS Collaboration, Search for pair production of first or second generation leptoquarks in proton–proton collisions at √s= 7 TeV using the ATLAS detector at the LHC,
Phys. Rev. D 83 (2011) 112006, arXiv:1104.4481 [hep-ex].
[15] ATLAS Collaboration, Search for first generation scalar leptoquarks in pp collisions at √
s= 7 TeV with the ATLAS detector,Phys. Lett. B 709 (2012) 158, arXiv:1112.4828 [hep-ex].
[16] ATLAS Collaboration, Search for second generation scalar leptoquarks in pp collisions at√ s= 7 TeV with the ATLAS detector,Eur. Phys. J. C 72 (2012) 2151,
arXiv:1203.3172 [hep-ex].
[17] CMS Collaboration, Search for pair production of first- and second-generation scalar leptoquarks in pp collisions at √s= 7 TeV,Phys. Rev. D 86 (2012) 052013,
arXiv:1207.5406 [hep-ex].
[18] CMS Collaboration, Search for pair production of third-generation leptoquarks and top squarks in pp collisions at √s= 7 TeV,Phys. Rev. Lett. 110 (2013) 081801,
arXiv:1210.5629 [hep-ex].
[19] ATLAS Collaboration, Search for third generation scalar leptoquarks in pp collisions at√ s= 7 TeV with the ATLAS detector,JHEP 06 (2013) 033, arXiv:1303.0526 [hep-ex]. [20] ATLAS Collaboration,
Searches for scalar leptoquarks in pp collisions at √s= 8 TeV with the ATLAS detector,
Eur. Phys. J. C 76 (2016) 5, arXiv:1508.04735 [hep-ex].
[21] CMS Collaboration, Search for pair production of first and second generation leptoquarks in proton–proton collisions at √s= 8 TeV,Phys. Rev. D 93 (2016) 032004,
arXiv:1509.03744 [hep-ex].
[22] CMS Collaboration, Search for third-generation leptoquarks and scalar bottom quarks in pp collisions at √s= 7 TeV,JHEP 12 (2012) 055, arXiv:1210.5627 [hep-ex].
[23] CMS Collaboration, Search for pair production of third-generation scalar leptoquarks and top squarks in proton–proton collisions at √s= 8 TeV,Phys. Lett. B 739 (2014) 229, arXiv:1408.0806 [hep-ex].
[24] CMS Collaboration, Search for third-generation scalar leptoquarks in the tτ channel in proton-proton collisions at √s= 8 TeV,JHEP 07 (2015) 042,
arXiv:1503.09049 [hep-ex].
[25] ATLAS Collaboration, The ATLAS Experiment at the CERN Large Hadron Collider,
JINST 3 (2008) S08003.
[26] T. Sjöstrand, S. Mrenna and P. Z. Skands, A Brief Introduction to PYTHIA 8.1,
Comput.Phys.Commun. 178 (2008) 852–867, arXiv:0710.3820 [hep-ph].
[27] ATLAS Collaboration, ATLAS Pythia 8 tunes to 7 TeV data, ATL-PHYS-PUB-2014-021, 2014, url:http://cdsweb.cern.ch/record/1966419.
[28] R. D. Ball et al., Parton distributions with LHC data,Nucl. Phys. B 867 (2013) 244–289, arXiv:1207.1303 [hep-ph].
[29] T. Gleisberg et al., Event generation with SHERPA 1.1,JHEP 0902 (2009) 007, arXiv:0811.4622 [hep-ph].
[30] T. Gleisberg and S. Höche, Comix, a new matrix element generator,
JHEP 0812 (2008) 039, arXiv:0808.3674 [hep-ph].
[31] F. Cascioli, P. Maierhofer and S. Pozzorini, Scattering Amplitudes with Open Loops,
Phys. Rev. Lett. 108 (2012) 111601, arXiv:1111.5206 [hep-ph]. [32] S. Schumann and F. Krauss,
A Parton shower algorithm based on Catani-Seymour dipole factorisation,
JHEP 0803 (2008) 038, arXiv:0709.1027 [hep-ph].
[33] S. Höche et al., QCD matrix elements+ parton showers: The NLO case,
JHEP 1304 (2013) 027, arXiv:1207.5030 [hep-ph]. [34] H.-L. Lai et al., New parton distributions for collider physics,
Phys.Rev. D 82 (2010) 074024, arXiv:1007.2241 [hep-ph].
[35] P. Nason, A New method for combining NLO QCD with shower Monte Carlo algorithms,
JHEP 0411 (2004) 040, arXiv:hep-ph/0409146 [hep-ph]. [36] S. Frixione, P. Nason and C. Oleari,
Matching NLO QCD computations with Parton Shower simulations: the POWHEG method,
JHEP 0711 (2007) 070, arXiv:0709.2092 [hep-ph].
[37] S. Alioli et al., A general framework for implementing NLO calculations in shower Monte Carlo programs: the POWHEG BOX,JHEP 1006 (2010) 043,
[38] E. Re, Single-top Wt-channel production matched with parton showers using the POWHEG method,Eur. Phys. J. C 71 (2011) 1547, arXiv:1009.2450 [hep-ph].
[39] T. Sjöstrand, S. Mrenna and P. Z. Skands, PYTHIA 6.4 Physics and Manual, JHEP 0605 (2006) 026, arXiv:hep-ph/0603175.
[40] P. Z. Skands, Tuning Monte Carlo Generators: The Perugia Tunes,
Phys. Rev. D 82 (2010) 074018, arXiv:1005.3457 [hep-ph]. [41] J. Pumplin et al.,
New generation of parton distributions with uncertainties from global QCD analysis,
JHEP 0207 (2002) 012, arXiv:hep-ph/0201195 [hep-ph]. [42] D. J. Lange, The EvtGen particle decay simulation package,
Nucl. Instrum. Meth. A 462 (2001) 152.
[43] ATLAS Collaboration, Summary of ATLAS Pythia 8 tunes, ATL-PHYS-PUB-2012-003, 2012, url:http://cds.cern.ch/record/1474107.
[44] A. Martin et al., Parton distributions for the LHC,Eur. Phys. J. C 63 (2009) 189, arXiv:0901.0002 [hep-ph].
[45] ATLAS Collaboration, The ATLAS Simulation Infrastructure,
Eur. Phys. J. C 70 (2010) 823, arXiv:1005.4568 [hep-ex]. [46] S. Agostinelli et al., GEANT4: A Simulation Toolkit,
Nucl. Instrum. Meth. A 506 (2003) 250–303.
[47] ATLAS Collaboration, The simulation principle and performance of the ATLAS fast calorimeter simulation FastCaloSim, ATL-PHYS-PUB-2010-013, 2010,
url:http://cds.cern.ch/record/1300517.
[48] S. Frixione et al., Single-top hadroproduction in association with a W boson,
JHEP 0807 (2008) 029, arXiv:0805.3067 [hep-ph]. [49] M. Czakon and A. Mitov,
Top++: A Program for the Calculation of the Top-Pair Cross-Section at Hadron Colliders,
Comput. Phys. Commun. 185 (2014) 2930, arXiv:1112.5675 [hep-ph].
[50] ATLAS Collaboration, Electron efficiency measurements with the ATLAS detector using the 2012 LHC proton–proton collision data, ATLAS-CONF-2014-032, 2014,
url:http://cdsweb.cern.ch/record/1706245.
[51] ATLAS Collaboration, Electron Efficiency Measurements in 2015 Data, 2015,
url:
http://atlas.web.cern.ch/Atlas/GROUPS/PHYSICS/PLOTS/EGAM-2015-006/index.html.
[52] ATLAS Collaboration, Measurement of the muon reconstruction performance of the ATLAS detector using 2011 and 2012 LHC proton–proton collision data,
[53] ATLAS Collaboration, Muon reconstruction performance of the ATLAS detector in proton–proton collision data at √s= 13 TeV, (2016), arXiv:1603.05598 [hep-ex]. [54] M. Cacciari, G. P. Salam and G. Soyez, The anti-ktjet clustering algorithm,
JHEP 0804 (2008) 063, arXiv:0802.1189 [hep-ph]. [55] ATLAS Collaboration,
Topological cell clustering in the ATLAS calorimeters and its performance in LHC Run 1, (2016), arXiv:1603.02934 [hep-ex].
[56] ATLAS Collaboration,
Selection of jets produced in13 TeV proton–proton collisions with the ATLAS detector, ATLAS-CONF-2015-029, 2015, url:http://cdsweb.cern.ch/record/2037702. [57] ATLAS Collaboration, Jet energy measurement and its systematic uncertainty in
proton–proton collisions at √s= 7 TeV with the ATLAS detector,
Eur. Phys. J. C 75 (2015) 17, arXiv:1406.0076 [hep-ex].
[58] ATLAS Collaboration, 2015 start-up trigger menu and initial performance assessment of the ATLAS trigger using Run-2 data, ATL-DAQ-PUB-2016-001, 2016,
url:https://cds.cern.ch/record/2136007/.
[59] ATLAS Collaboration, Muon reconstruction performance in early √s= 13 TeV data, ATL-PHYS-PUB-2015-037, 2015, url:http://cdsweb.cern.ch/record/2047831. [60] G. Cowan et al., Asymptotic formulae for likelihood-based tests of new physics,
Eur. Phys. J. C 71 (2011) 1554, Erratum: Eur. Phys. J. C 73 (2013) 2501, arXiv:1007.1727 [physics.data-an].
[61] M. Baak et al., HistFitter software framework for statistical data analysis,
Eur. Phys. J. C 75 (2015) 153, arXiv:1410.1280 [hep-ex].
[62] ATLAS Collaboration, Search for high-mass dilepton resonances in pp collisions at √
s= 8 TeV with the ATLAS detector,Phys. Rev. D 90 (2014) 052005, arXiv:1405.4123 [hep-ex].
[63] ATLAS Collaboration, Improved luminosity determination in pp collisions at √s= 7 TeV using the ATLAS detector at the LHC,Eur. Phys. J. C 73 (2013) 2518,
arXiv:1302.4393 [hep-ex].
[64] G. Corcella et al., HERWIG 6: An Event generator for hadron emission reactions with interfering gluons (including supersymmetric processes),JHEP 0101 (2001) 010, arXiv:hep-ph/0011363 [hep-ph].
[65] J. Alwall et al., The automated computation of tree-level and next-to-leading order differential cross sections, and their matching to parton shower simulations,
JHEP 1407 (2014) 079, arXiv:1405.0301 [hep-ph].
[66] ATLAS Collaboration, Further ATLAS tunes of Pythia 6 and Pythia 8,
[67] S. Dulat et al., The CT14 Global Analysis of Quantum Chromodynamics, (2015), arXiv:1506.07443 [hep-ph].
[68] L. A. Harland-Lang et al., Parton distributions in the LHC era: MMHT 2014 PDFs,
Eur. Phys. J. C 75 (2015) 204, arXiv:1412.3989 [hep-ph]. [69] A. L. Read, Presentation of search results: the CLstechnique,
Journal of Physics G: Nuclear and Particle Physics 28 (2002) 2693, url:http://stacks.iop.org/0954-3899/28/i=10/a=313.
The ATLAS Collaboration
M. Aaboud136d, G. Aad87, B. Abbott114, J. Abdallah65, O. Abdinov12, B. Abeloos118, R. Aben108, O.S. AbouZeid138, N.L. Abraham150, H. Abramowicz154, H. Abreu153, R. Abreu117,
Y. Abulaiti147a,147b, B.S. Acharya164a,164b,a, L. Adamczyk40a, D.L. Adams27, J. Adelman109, S. Adomeit101, T. Adye132, A.A. Affolder76, T. Agatonovic-Jovin14, J. Agricola56,
J.A. Aguilar-Saavedra127a,127f, S.P. Ahlen24, F. Ahmadov67,b, G. Aielli134a,134b,
H. Akerstedt147a,147b, T.P.A. Åkesson83, A.V. Akimov97, G.L. Alberghi22a,22b, J. Albert169, S. Albrand57, M.J. Alconada Verzini73, M. Aleksa32, I.N. Aleksandrov67, C. Alexa28b,
G. Alexander154, T. Alexopoulos10, M. Alhroob114, M. Aliev75a,75b, G. Alimonti93a, J. Alison33, S.P. Alkire37, B.M.M. Allbrooke150, B.W. Allen117, P.P. Allport19, A. Aloisio105a,105b,
A. Alonso38, F. Alonso73, C. Alpigiani139, M. Alstaty87, B. Alvarez Gonzalez32, D. Álvarez Piqueras167, M.G. Alviggi105a,105b, B.T. Amadio16, K. Amako68,
Y. Amaral Coutinho26a, C. Amelung25, D. Amidei91, S.P. Amor Dos Santos127a,127c, A. Amorim127a,127b, S. Amoroso32, G. Amundsen25, C. Anastopoulos140, L.S. Ancu51, N. Andari109, T. Andeen11, C.F. Anders60b, G. Anders32, J.K. Anders76, K.J. Anderson33, A. Andreazza93a,93b, V. Andrei60a, S. Angelidakis9, I. Angelozzi108, P. Anger46, A. Angerami37, F. Anghinolfi32, A.V. Anisenkov110,c, N. Anjos13, A. Annovi125a,125b, M. Antonelli49,
A. Antonov99, F. Anulli133a, M. Aoki68, L. Aperio Bella19, G. Arabidze92, Y. Arai68, J.P. Araque127a, A.T.H. Arce47, F.A. Arduh73, J-F. Arguin96, S. Argyropoulos65, M. Arik20a, A.J. Armbruster144, L.J. Armitage78, O. Arnaez32, H. Arnold50, M. Arratia30, O. Arslan23, A. Artamonov98, G. Artoni121, S. Artz85, S. Asai156, N. Asbah44, A. Ashkenazi154,
B. Åsman147a,147b, L. Asquith150, K. Assamagan27, R. Astalos145a, M. Atkinson166, N.B. Atlay142, K. Augsten129, G. Avolio32, B. Axen16, M.K. Ayoub118, G. Azuelos96,d, M.A. Baak32,
A.E. Baas60a, M.J. Baca19, H. Bachacou137, K. Bachas75a,75b, M. Backes32, M. Backhaus32, P. Bagiacchi133a,133b, P. Bagnaia133a,133b, Y. Bai35a, J.T. Baines132, O.K. Baker176,
E.M. Baldin110,c, P. Balek130, T. Balestri149, F. Balli137, W.K. Balunas123, E. Banas41, Sw. Banerjee173,e, A.A.E. Bannoura175, L. Barak32, E.L. Barberio90, D. Barberis52a,52b, M. Barbero87, T. Barillari102, T. Barklow144, N. Barlow30, S.L. Barnes86, B.M. Barnett132, R.M. Barnett16, Z. Barnovska5, A. Baroncelli135a, G. Barone25, A.J. Barr121,
L. Barranco Navarro167, F. Barreiro84, J. Barreiro Guimarães da Costa35a, R. Bartoldus144, A.E. Barton74, P. Bartos145a, A. Basalaev124, A. Bassalat118, R.L. Bates55, S.J. Batista159, J.R. Batley30, M. Battaglia138, M. Bauce133a,133b, F. Bauer137, H.S. Bawa144, f, J.B. Beacham112, M.D. Beattie74, T. Beau82, P.H. Beauchemin162, P. Bechtle23, H.P. Beck18,g, K. Becker121, M. Becker85, M. Beckingham170, C. Becot111, A.J. Beddall20e, A. Beddall20b, V.A. Bednyakov67, M. Bedognetti108, C.P. Bee149, L.J. Beemster108, T.A. Beermann32, M. Begel27, J.K. Behr44, C. Belanger-Champagne89, A.S. Bell80, G. Bella154, L. Bellagamba22a, A. Bellerive31, M. Bellomo88, K. Belotskiy99, O. Beltramello32, N.L. Belyaev99, O. Benary154,
D. Benchekroun136a, M. Bender101, K. Bendtz147a,147b, N. Benekos10, Y. Benhammou154, E. Benhar Noccioli176, J. Benitez65, D.P. Benjamin47, J.R. Bensinger25, S. Bentvelsen108,
L. Beresford121, M. Beretta49, D. Berge108, E. Bergeaas Kuutmann165, N. Berger5, J. Beringer16, S. Berlendis57, N.R. Bernard88, C. Bernius111, F.U. Bernlochner23, T. Berry79, P. Berta130, C. Bertella85, G. Bertoli147a,147b, F. Bertolucci125a,125b, I.A. Bertram74, C. Bertsche44, D. Bertsche114, G.J. Besjes38, O. Bessidskaia Bylund147a,147b, M. Bessner44, N. Besson137, C. Betancourt50, S. Bethke102, A.J. Bevan78, W. Bhimji16, R.M. Bianchi126, L. Bianchini25, M. Bianco32, O. Biebel101, D. Biedermann17, R. Bielski86, N.V. Biesuz125a,125b, M. Biglietti135a, J. Bilbao De Mendizabal51, H. Bilokon49, M. Bindi56, S. Binet118, A. Bingul20b, C. Bini133a,133b, S. Biondi22a,22b, D.M. Bjergaard47, C.W. Black151, J.E. Black144, K.M. Black24, D. Blackburn139, R.E. Blair6, J.-B. Blanchard137, J.E. Blanco79, T. Blazek145a, I. Bloch44, C. Blocker25,
W. Blum85,∗, U. Blumenschein56, S. Blunier34a, G.J. Bobbink108, V.S. Bobrovnikov110,c, S.S. Bocchetta83, A. Bocci47, C. Bock101, M. Boehler50, D. Boerner175, J.A. Bogaerts32, D. Bogavac14, A.G. Bogdanchikov110, C. Bohm147a, V. Boisvert79, P. Bokan14, T. Bold40a, A.S. Boldyrev164a,164c, M. Bomben82, M. Bona78, M. Boonekamp137, A. Borisov131, G. Borissov74, J. Bortfeldt101, D. Bortoletto121, V. Bortolotto62a,62b,62c, K. Bos108, D. Boscherini22a, M. Bosman13, J.D. Bossio Sola29, J. Boudreau126, J. Bouffard2,
E.V. Bouhova-Thacker74, D. Boumediene36, C. Bourdarios118, S.K. Boutle55, A. Boveia32, J. Boyd32, I.R. Boyko67, J. Bracinik19, A. Brandt8, G. Brandt56, O. Brandt60a, U. Bratzler157, B. Brau88, J.E. Brau117, H.M. Braun175,∗, W.D. Breaden Madden55, K. Brendlinger123, A.J. Brennan90, L. Brenner108, R. Brenner165, S. Bressler172, T.M. Bristow48, D. Britton55, D. Britzger44, F.M. Brochu30, I. Brock23, R. Brock92, G. Brooijmans37, T. Brooks79,
W.K. Brooks34b, J. Brosamer16, E. Brost117, J.H Broughton19, P.A. Bruckman de Renstrom41, D. Bruncko145b, R. Bruneliere50, A. Bruni22a, G. Bruni22a, L.S. Bruni108, BH Brunt30,
M. Bruschi22a, N. Bruscino23, P. Bryant33, L. Bryngemark83, T. Buanes15, Q. Buat143,
P. Buchholz142, A.G. Buckley55, I.A. Budagov67, F. Buehrer50, M.K. Bugge120, O. Bulekov99, D. Bullock8, H. Burckhart32, S. Burdin76, C.D. Burgard50, B. Burghgrave109, K. Burka41,
S. Burke132, I. Burmeister45, E. Busato36, D. Büscher50, V. Büscher85, P. Bussey55, J.M. Butler24, C.M. Buttar55, J.M. Butterworth80, P. Butti108, W. Buttinger27, A. Buzatu55, A.R. Buzykaev110,c, S. Cabrera Urbán167, D. Caforio129, V.M. Cairo39a,39b, O. Cakir4a, N. Calace51, P. Calafiura16, A. Calandri87, G. Calderini82, P. Calfayan101, L.P. Caloba26a, D. Calvet36, S. Calvet36, T.P. Calvet87, R. Camacho Toro33, S. Camarda32, P. Camarri134a,134b, D. Cameron120,
R. Caminal Armadans166, C. Camincher57, S. Campana32, M. Campanelli80, A. Camplani93a,93b, A. Campoverde142, V. Canale105a,105b, A. Canepa160a, M. Cano Bret35e, J. Cantero115,
R. Cantrill127a, T. Cao42, M.D.M. Capeans Garrido32, I. Caprini28b, M. Caprini28b,
M. Capua39a,39b, R. Caputo85, R.M. Carbone37, R. Cardarelli134a, F. Cardillo50, I. Carli130, T. Carli32, G. Carlino105a, L. Carminati93a,93b, S. Caron107, E. Carquin34b,
G.D. Carrillo-Montoya32, J.R. Carter30, J. Carvalho127a,127c, D. Casadei19, M.P. Casado13,h, M. Casolino13, D.W. Casper163, E. Castaneda-Miranda146a, R. Castelijn108, A. Castelli108, V. Castillo Gimenez167, N.F. Castro127a,i, A. Catinaccio32, J.R. Catmore120, A. Cattai32, J. Caudron85, V. Cavaliere166, E. Cavallaro13, D. Cavalli93a, M. Cavalli-Sforza13,
V. Cavasinni125a,125b, F. Ceradini135a,135b, L. Cerda Alberich167, B.C. Cerio47, A.S. Cerqueira26b, A. Cerri150, L. Cerrito78, F. Cerutti16, M. Cerv32, A. Cervelli18, S.A. Cetin20d, A. Chafaq136a,
D. Chakraborty109, S.K. Chan59, Y.L. Chan62a, P. Chang166, J.D. Chapman30, D.G. Charlton19, A. Chatterjee51, C.C. Chau159, C.A. Chavez Barajas150, S. Che112, S. Cheatham74,
A. Chegwidden92, S. Chekanov6, S.V. Chekulaev160a, G.A. Chelkov67, j, M.A. Chelstowska91, C. Chen66, H. Chen27, K. Chen149, S. Chen35c, S. Chen156, X. Chen35f, Y. Chen69, H.C. Cheng91, H.J Cheng35a, Y. Cheng33, A. Cheplakov67, E. Cheremushkina131, R. Cherkaoui El Moursli136e, V. Chernyatin27,∗, E. Cheu7, L. Chevalier137, V. Chiarella49, G. Chiarelli125a,125b, G. Chiodini75a, A.S. Chisholm19, A. Chitan28b, M.V. Chizhov67, K. Choi63, A.R. Chomont36, S. Chouridou9, B.K.B. Chow101, V. Christodoulou80, D. Chromek-Burckhart32, J. Chudoba128, A.J. Chuinard89, J.J. Chwastowski41, L. Chytka116, G. Ciapetti133a,133b, A.K. Ciftci4a, D. Cinca55, V. Cindro77, I.A. Cioara23, A. Ciocio16, F. Cirotto105a,105b, Z.H. Citron172, M. Citterio93a, M. Ciubancan28b, A. Clark51, B.L. Clark59, M.R. Clark37, P.J. Clark48, R.N. Clarke16, C. Clement147a,147b, Y. Coadou87, M. Cobal164a,164c, A. Coccaro51, J. Cochran66, L. Coffey25, L. Colasurdo107, B. Cole37, A.P. Colijn108, J. Collot57, T. Colombo32, G. Compostella102, P. Conde Muiño127a,127b, E. Coniavitis50, S.H. Connell146b, I.A. Connelly79, V. Consorti50, S. Constantinescu28b,
G. Conti32, F. Conventi105a,k, M. Cooke16, B.D. Cooper80, A.M. Cooper-Sarkar121,
K.J.R. Cormier159, T. Cornelissen175, M. Corradi133a,133b, F. Corriveau89,l, A. Corso-Radu163, A. Cortes-Gonzalez13, G. Cortiana102, G. Costa93a, M.J. Costa167, D. Costanzo140, G. Cottin30, G. Cowan79, B.E. Cox86, K. Cranmer111, S.J. Crawley55, G. Cree31, S. Crépé-Renaudin57, F. Crescioli82, W.A. Cribbs147a,147b, M. Crispin Ortuzar121, M. Cristinziani23, V. Croft107, G. Crosetti39a,39b, T. Cuhadar Donszelmann140, J. Cummings176, M. Curatolo49, J. Cúth85, C. Cuthbert151, H. Czirr142, P. Czodrowski3, G. D’amen22a,22b, S. D’Auria55, M. D’Onofrio76, M.J. Da Cunha Sargedas De Sousa127a,127b, C. Da Via86, W. Dabrowski40a, T. Dado145a, T. Dai91, O. Dale15, F. Dallaire96, C. Dallapiccola88, M. Dam38, J.R. Dandoy33, N.P. Dang50,
A.C. Daniells19, N.S. Dann86, M. Danninger168, M. Dano Hoffmann137, V. Dao50, G. Darbo52a, S. Darmora8, J. Dassoulas3, A. Dattagupta63, W. Davey23, C. David169, T. Davidek130,
M. Davies154, P. Davison80, E. Dawe90, I. Dawson140, R.K. Daya-Ishmukhametova88, K. De8, R. de Asmundis105a, A. De Benedetti114, S. De Castro22a,22b, S. De Cecco82, N. De Groot107, P. de Jong108, H. De la Torre84, F. De Lorenzi66, A. De Maria56, D. De Pedis133a, A. De Salvo133a, U. De Sanctis150, A. De Santo150, J.B. De Vivie De Regie118, W.J. Dearnaley74, R. Debbe27, C. Debenedetti138, D.V. Dedovich67, N. Dehghanian3, I. Deigaard108, M. Del Gaudio39a,39b, J. Del Peso84, T. Del Prete125a,125b, D. Delgove118, F. Deliot137, C.M. Delitzsch51,
M. Deliyergiyev77, A. Dell’Acqua32, L. Dell’Asta24, M. Dell’Orso125a,125b, M. Della Pietra105a,k, D. della Volpe51, M. Delmastro5, P.A. Delsart57, C. Deluca108, D.A. DeMarco159, S. Demers176, M. Demichev67, A. Demilly82, S.P. Denisov131, D. Denysiuk137, D. Derendarz41,
J.E. Derkaoui136d, F. Derue82, P. Dervan76, K. Desch23, C. Deterre44, K. Dette45,
P.O. Deviveiros32, A. Dewhurst132, S. Dhaliwal25, A. Di Ciaccio134a,134b, L. Di Ciaccio5, W.K. Di Clemente123, C. Di Donato133a,133b, A. Di Girolamo32, B. Di Girolamo32, B. Di Micco135a,135b, R. Di Nardo32, A. Di Simone50, R. Di Sipio159, D. Di Valentino31,
C. Diaconu87, M. Diamond159, F.A. Dias48, M.A. Diaz34a, E.B. Diehl91, J. Dietrich17, S. Diglio87, A. Dimitrievska14, J. Dingfelder23, P. Dita28b, S. Dita28b, F. Dittus32, F. Djama87, T. Djobava53b, J.I. Djuvsland60a, M.A.B. do Vale26c, D. Dobos32, M. Dobre28b, C. Doglioni83, T. Dohmae156,