Publisher’s version / Version de l'éditeur:
Vous avez des questions? Nous pouvons vous aider. Pour communiquer directement avec un auteur, consultez la première page de la revue dans laquelle son article a été publié afin de trouver ses coordonnées. Si vous n’arrivez pas à les repérer, communiquez avec nous à [email protected].
Questions? Contact the NRC Publications Archive team at
[email protected]. If you wish to email the authors directly, please see the first page of the publication for their contact information.
https://publications-cnrc.canada.ca/fra/droits
L’accès à ce site Web et l’utilisation de son contenu sont assujettis aux conditions présentées dans le site LISEZ CES CONDITIONS ATTENTIVEMENT AVANT D’UTILISER CE SITE WEB.
Monthly Notices of the Royal Astronomical Society, 490, 3, pp. 4121-4132,
2019-12-11
READ THESE TERMS AND CONDITIONS CAREFULLY BEFORE USING THIS WEBSITE. https://nrc-publications.canada.ca/eng/copyright
NRC Publications Archive Record / Notice des Archives des publications du CNRC :
https://nrc-publications.canada.ca/eng/view/object/?id=eb391d46-ab33-4be6-ba66-f8f8de564fda
https://publications-cnrc.canada.ca/fra/voir/objet/?id=eb391d46-ab33-4be6-ba66-f8f8de564fda
NRC Publications Archive
Archives des publications du CNRC
This publication could be one of several versions: author’s original, accepted manuscript or the publisher’s version. / La version de cette publication peut être l’une des suivantes : la version prépublication de l’auteur, la version acceptée du manuscrit ou la version de l’éditeur.
For the publisher’s version, please access the DOI link below./ Pour consulter la version de l’éditeur, utilisez le lien DOI ci-dessous.
https://doi.org/10.1093/mnras/stz2826
Access and use of this website and the material on it are subject to the Terms and Conditions set forth at
A DECam view of the diffuse dwarf galaxy Crater II: the
colour–magnitude diagram
Walker, A. R.; Martínez-Vázquez, C. E.; Monelli, M.; Vivas, A. K.; Bono, G.;
Gallart, C.; Cassisi, S.; Andreuzzi, G.; Bernard, E. J.; Dall’Ora, M.;
A DECam View of the Diffuse Dwarf Galaxy Crater II:
The Colour-Magnitude Diagram
A.R. Walker,
1
?
C.E. Mart´ınez-V´
azquez,
1
M. Monelli,
2,3
A.K. Vivas,
1
G. Bono,
4
C. Gallart,
2,3
S. Cassisi,
5,6
G. Andreuzzi,
7,11
E.J. Bernard,
8
M. Dall’Ora,
9
G. Fiorentino,
10,11
D.L. Nidever,
12,13
K. Olsen,
12
A. Pietrinferni,
5
P.B. Stetson
14
1Cerro Tololo Inter-American Observatory, NSF’s National Optical-Infrared Astronomy Research Laboratory, Casilla 603, La Serena, Chile 2Instituto de Astrof´ısica de Canarias, Calle V´ıa L´actea, E-38205 La Laguna, Tenerife, Spain
3Universidad de La Laguna, Dpto. Astrof´ısica, E-38206 La Laguna, Tenerife, Spain
4Departimento di Fisica, Universit´a di Roma Tor Vergata, via della Ricerca Scientifica 1, 00133, Rome, Italy 5INAF-Osservatorio Astronomico d’Abruzzo, Via M. Maggini, I-64100 Teramo, Italy
6INFN-Sezione di Pisa, Largo Pontocorvo 3, 56127, Pisa, Italy
7INAF-Fundaci´on Galileo Galilei, Rambla Jos´e Ana Fernandez P´erez 7, 38712, Bre˜na Baja, Spain 8Universit´e Cˆote d’Azur, OCA, CNRS, Lagrange, F-06304 Nice, France
9INAF-Osservatorio Astronomico di Capodimonte, salita Moiariello 16, 80131, Napoli, Italy 10INAF-Osservatorio Astronomico di Bologna, via Ranzani 1, I-40127 Bologna, Italy
11INAF-Osservatorio Astronomico di Roma, via Frascati 33, 0040 Monte Porzio Catone, Italy
12NSF’s National Optical-Infrared Astronomy Research Laboratory, 950 North Cherry Avenue, Tucson, AZ 85719, USA 13Department of Physics, Montana State University, P.O. Box 173840, Bozeman, MT 59717-3840, USA
14Herzberg Astronomy and Astrophysics, National Research Council, 5071 West Saanich Road, Victoria, British Columbia V9E 2E7, Canada
Accepted 2019 October 4. Received 2019 September 27; in original form 2019 August 18
ABSTRACT
We present a deep Blanco/DECam colour-magnitude diagram (CMD) for the large but very diffuse Milky Way satellite dwarf galaxy Crater II. The CMD shows only old stars with a clearly bifurcated subgiant branch (SGB) that feeds a narrow red giant branch. The horizontal branch (HB) shows many RR Lyrae and red HB stars. Comparing the CMD with [Fe/H] = -2.0 and [α/Fe] = +0.3 alpha-enhanced BaSTI isochrones indicates a mean age of 12.5 Gyr for the main event and a mean age of 10.5 Gyr for the brighter SGB. With such multiple star formation events Crater II shows similarity to more massive dwarfs that have intermediate age populations, however for Crater II there was early quenching of the star formation and no intermediate age or younger stars are present. The spatial distribution of Crater II stars overall is elliptical in the plane of the sky, the detailed distribution shows a lack of strong central concentration, and some inhomogeneities. The 10.5 Gyr subgiant and upper main sequence stars show a slightly higher central concentration when compared to the 12.5 Gyr population. Matching to Gaia DR2 we find the proper motion of Crater II: µαcos δ=-0.14 ± 0.07 , µδ=-0.10 ± 0.04 mas yr−1, approximately perpendicular to the semi-major axis of Crater II. Our results provide constraints on the star formation and chemical enrichment history of Crater II, but cannot definitively determine whether or not substantial mass has been lost over its lifetime.
Key words: galaxies: dwarf; galaxies: individual: Crater II; Local Group; methods: data analysis; techniques: photometric; Astrophysics - Astrophysics of Galaxies
1 INTRODUCTION
Crater II (Torrealba et al. 2016) is an enigmatic object in the pantheon of normal and ultra-faint dwarf galaxies
asso-? E-mail: [email protected]
ciated with our Galaxy. It occupies a parameter space where it is physically very large - with half light radius 1066 ± 84 pc (Torrealba et al. 2016) so similar in size to classic dwarf galaxies such as Sculptor and Fornax - but 100 times less lu-minous with Mv= −8.2 (Torrealba et al. 2016), and of such
2
A.R. Walker et al.
amongst Galactic foreground stars and faint background galaxies. In this latter characteristic it is similar to the ultra-faint dwarfs (UFD) and Simon(2019) draws the boundary between UFDs and more luminous dwarfs in the luminosity - metallicity plane close to the position of Crater II. The discovery of Antlia II (Torrealba et al. 2019) lying behind the Galactic disk and also of similar size and very low sur-face brightness might argue for a significant number of such galaxies still to be discovered. It is presently an open ques-tion as to how Crater II formed and subsequently evolved, with a key aspect being whether it has lost most of its orig-inal mass and, if not, how has it managed to remain intact for a Hubble time?Fritz et al.(2018) analysed the orbits of a number of Milky Way (MW) satellites by use of Gaia Data Release 2 (Gaia DR2,Gaia Collaboration 2018) proper mo-tion determinamo-tions. For Crater II, they find a reconstructed orbit that is radial with eccentricity ∼ 0.7 and with pericen-ter that may be less than 20 kpc from the cenpericen-ter of the MW, depending on the adopted mass for the MW. Such an orbit, consistent with models bySanders, Evans & Dehnen (2018);Fattahi et al.(2018), together with the observed size of Crater II, would suggest a system vulnerable to disrup-tion. In addition,Fu, Simon & Alarc´on Jara(2019) identify 37 Crater II members from radial velocities, 22 previously classified as members byCaldwell et al.(2017), and together with Gaia DR2 astrometry calculate an orbit for Crater II, concluding that it is almost certain that the galaxy has been stripped over its lifetime. Spectroscopy of Crater II mem-bers, mostly Red Giant Branch (RGB) and Asymptotic Gi-ant Branch (AGB) stars (Caldwell et al. 2017; Fu, Simon & Alarc´on Jara 2019), demonstrates a resolved but rather narrow range of [Fe/H] values, suggesting a relatively sim-ple chemical evolution, together with very cold dynamics although, despite this, apparently Crater II is dark-matter dominated with M/L = 53+15
−11 M /LV, (Caldwell et al.
2017).
Studies of Crater II by our group and others (Joo et al. 2018;Monelli et al. 2018;Vivas et al. 2019), have identified a copious number of RR Lyrae (RRL) variable stars indicative of a strong ancient population. Importantly, RRL are useful for delineating the spatial distribution of the galaxy, and for large enough structures can determine the depth as well. In the case of Crater II, the RRL distribution could provide a strong observational constraint as to whether stars are still being lost (Vivas et al. 2019).
In this paper we study the star formation history of Crater II by analyzing a Colour Magnitude Diagram (CMD) that reaches well below the main sequence turn-off (MSTO) for the oldest population. A companion paper (Vivas et al. 2019) discusses the variable star content of Crater II, from the same set of observations. In §2we describe the observa-tions and preparation of the data, in §3we discuss the fea-tures of the CMD and compare with theoretical isochrones, in §4we discuss the spatial distribution of Crater II stars, and by matching 80 stars classified as members and with low Gaia proper motion errors, we calculate the Crater II proper motion. In §5we relate the variable stars properties to the CMD results, and in §6 we discuss the results and present our conclusions.
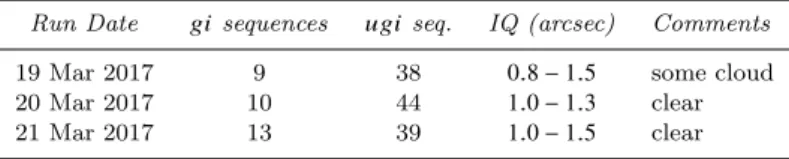
Table 1. Log of the DECam observations
Run Date gi sequences ugi seq. IQ (arcsec) Comments 19 Mar 2017 9 38 0.8 − 1.5 some cloud 20 Mar 2017 10 44 1.0 − 1.3 clear 21 Mar 2017 13 39 1.0 − 1.5 clear
2 OBSERVATIONS AND DATA REDUCTION
The Crater II observations presented here derive from an allocation of three nights awarded by NOAO (P.I. A.R. Walker, prop-id 2017A-0210) with DECam on the Blanco 4m telescope at Cerro Tololo Inter-American Observatory (CTIO). From these observations we have produced a deep CMD and high-quality light curves for the Crater II variable stars, with main science goals to study the star formation history and the spatial distribution of the galaxy’s stellar populations. The observing log of the observations used for the CMD is summarized in Table1. When the Moon was down we took exposures of 180s in a u, g, i sequence, cen-tered on the Crater II position as given byTorrealba et al. (2016) with small dithers to fill in the CCD gaps. If the Moon was up only g, i exposures were taken. In photometric conditions SDSS standard star fields were observed, mostly equatorial.
2.1 Image Combination
The images were processed by the DECam Community Pipeline (CP,Valdes 2014), which removes the instrument signature and provides various data products. For the spe-cific purposes of this study custom stacks were produced, as follows: A total of 153 g, 153 i and 32 u band exposures were available, and after examination of the image quality and the depth of each of these exposures, stacks were produced con-taining 100, 100, 31 selected images in g, i, u respectively, rejecting images that were taken in poor sky transparency, or with a very bright sky, or in poor seeing conditions. For these stacks, the CP produces multi-extension FITS (MEF) files that have 9 image extensions with each containing ap-proximately 9K × 9K pixels and corresponding to ∼ 39 × 39 arcmin on the sky. The extensions are spatially arranged in a 3 × 3 format that covers the approximately circular 2 de-gree diameter DECam field, thus the four corner extensions (numbers 1, 3, 7, 9) are only partially filled by DECam.
Two alternative algorithms for flattening the sky back-ground are offered by the CP. Here we chose to use the osj option rather than osi after visual inspection that the former skies were flatter with only minimal over-subtraction around very bright objects. The bad pixel masks provided for stacks are very simple, with a value 0 corresponding to good data, a value 1 coming from an input image bad pixel mask, and a value 2 (the majority of the bad pixels) coming from where there was no useful data, e.g. from a star saturated on all images. Of particular utility is the exposure map provided by the CP, that is, an image where the data are the expo-sure times corresponding to each pixel in the stacked object image.
for photometry, producing two sets of images as follows: the first full set had (i) any pixel appearing with a value of 1 or 2 in the bad pixel mask was replaced by 32767, the second uniform set had (i) any pixel appearing with a value of 1 or 2 in the bad pixel mask was replaced by 32767, in addition (ii) for all pixels in the exposure maps with value less than 16200 seconds (g, i) or 5040 seconds (u) the corresponding image pixel was replaced by 32767. The values of 16200 and 5040 seconds are 90% of the maximum possible exposure times for g, i and u respectively. The value of 32767 for the invalid pixel indicator was chosen for compatibility with the requirements of the photometry program (see below).
The observation scripts used for the Crater II expo-sures deliberately dithered the telescope just enough to fill in the gaps between the CCDs, with small additional ran-dom dithers of size a few arcsec arising from errors in the telescope pointing and adjustments made by the active op-tics system on an image by image basis to optimize image quality. The full data set will therefore contain stars, at a given magnitude, that have a range in S/N due to a varying contribution of exposures. However for brighter stars (e.g. including the RRL at g ∼ 21) high S/N is achieved even with only a few contributing exposures, and the photometric ac-curacy is dominated by systematic effects rather than shot noise. Therefore, for bright stars we have full spatial cov-erage with no drawbacks, and we can with confidence use the full dataset (74541 stars) for studying the morphology of Crater II as indicated by the RRL (Vivas et al. 2019). For the uniform set as described above with selection by exposure time, the sacrifice is that the coverage fraction is reduced to ∼ 60 percent (44294 stars) however the remaining good pixels are very uniform in depth. This is very important for correct interpretation of any changes in features in the faintest parts of the CMD as a function of spatial position.
In summary, from the above procedures we have pro-duced two sets of three image FITS files, one each for g, i and u, each file with 9 image extensions of approximately 9K × 9K pixels. The first set covers the full field with no gaps, and the second set is more restrictive, including ∼ 60 percent of the stars, but with uniformity and cleanness suitable for interpreting the photometry to the faintest levels.
2.2 Photometry
We use DAOPHOT (Stetson 1987, 1994) for the photometry. Firstly, the DAOPHOT parameter files were prepared, of par-ticular note is that we set the highest good pixel value (hi) = 15000 counts. While this is much less that the full-well val-ues for any of the DECam CCDs, the CP does not explicitly correct for the brighter-fatter effect (Bernstein, et al. 2017) so it is preferable to keep stars selected to define the PSF and also those used for comparison with photometric standards to be those of no more than medium brightness. In any case, the brighter stars will all be Galactic foreground field stars and not of interest to this project. We searched for objects down to S/N threshold (t h) of 3.5, in two passes. For the cen-ter 9K × 9K field (extension 5, cencen-tered on Cracen-ter II), and considering the uniform sample that excludes the dithered regions, we found 42890, 60368, 1574 objects in g, i, u re-spectively thus the object density for g, i is approximately one per 90 arcsec2, i.e. comfortably low.
The Blanco-DECam combination produces tight
stel-lar images and a Moffat function with beta parameter = 3.5 is an excellent fit to the stellar image profiles, including the profile wings. After some experimentation we chose a linear-varying (va= 1) PSF as being appropriate; while a quadratic-varying (va= 2) PSF showed slightly smaller fit residuals for the PSF stars, the resulting photometry showed no improvement and we decided to keep the simpler func-tional form for the PSF. In itself, the ability to fit the stacks with a va=1 psf form is a simple confirmation that noth-ing untoward with regard to the star images is taknoth-ing place spatially in the stacking process.
Following aperture photometry and PSF star picking, the PSF photometry was performed in the standard way with ALLSTAR. For each image the PSF was constructed from ∼ 200 stars (100 for u). The photometric errors for the g − i colors were calculated as the quadrature sum of the errors in g and i returned by ALLSTAR, and were <0.01 mag for g< 21, < 0.02 mag for g < 22.5, and averaged 0.04, 0.1, 0.2 mag at g= 24, 25, 26 respectively. Since the depths achieved in g and i are similar, the errors in the g and i bands at these stated magnitudes will be approximately 2/3 of those for the colors. Exactly the same procedure was carried out on the two sets of images (uniform, full).
It is instructive to compare the approach chosen here (stack the images, then run DAOPHOT/ALLSTAR), to the al-ternative of running DAOPHOT/ALLSTAR/ALLFRAME on the in-dividual images. In principle the latter forced-photometry approach should be superior (Stetson 1994) and be able to go deeper since the star list is constructed from all avail-able images. However the computation resources needed to handle 231 DECam images as opposed to 3 is very signif-icant, and was beyond those available to our group, even when using PHOTRED1(Nidever et al. 2017) to handle all the book-keeping and efficiently automate the process. By con-trast, all the photometry for this project was run in a few minutes per image using a MacBook Pro laptop. The well-known difficulties for doing photometry on stacks, such as poor control of PSF across the field, poor control of errors, varying depth, are mitigated here by the low distortion and near-constant image quality across the DECam focal plane, by the similariry of the quantum efficiency response for the DECam CCDs over the passbands of main interest (g, i), and by use of the uniform set of reductions as described above for the critical interpretive tasks.
The photometric (g, i) calibration involved transforma-tion to the SDSS system (Alam et al. 2015; Nidever et al. 2017) by cross-correlating low-error matches (σ < 0.05 mag) at the catalogue level with the Crater II catalogue produced by PHOTRED (Nidever et al. 2017), seeVivas et al.(2019) for details on how the reference catalogue was produced. The SDSS and DECam g and i passbands are quite similar, and we find simple linear transformations, excluding stars with photometric errors σ > 0.05 mag., and using S and D to denote SDSS and DECam respectively:
gS− gD= 0.0710(±0.0003)(gS−iS)+0.0174(±0.0004), N = 7141
(1)
4
A.R. Walker et al.
iS− iD= 0.0783(±0.0003)(gS− iS) − 0.0541(±0.0004), N= 7258
(2) The u band photometry was left on the DECam natural system, since our intent was to use these observations to select Crater II members –mostly RGB, AGB and Horizontal Branch (HB) stars– in g vs. g − i vs. u − g space (Di Cecco et al. 2015). For this task it is not necessary to calibrate the u band.
With the photometry in hand, we proceeded with an initial evaluation by constructing plots of the photometric errors as a function of magnitude, and plots of the PSF fit parameters chi and sharp as functions of magnitude. The former allowed formation of an envelope that included the great majority of detected objects but excluded those with large errors, and bounds on chi of 0, 1 fulfilled a similar func-tion of removing errant measurements. Because of the high Galactic latitude of Crater II and the diffuse nature of the galaxy itself the star density is not so great as to make pho-tometry difficult by having many overlapping stars, and thus the sharp parameter is a very efficient separator of stars and galaxies. We used −0.5 < shar p < 0.2 to select stars and shar p > 0.2 to select galaxies. The samples appear to be very pure (referring here to g and i, the shallower u band images contain few galaxies) except in the final faintest one magnitude, where from the CMDs (see below) some stars are clearly classified as galaxies, and vice versa. With these def-initions in hand, we proceeded to match stars between the photometric bands, taking account of the systematic few-pixel positional differences between the g, i, u stacks, defin-ing a successful match for objects with centers separated by no more than 3.5 pixels (0.9 arcsec). In the case of multiple matches, the closest was selected. With astrometry from the original images WCS and redefined using SAOImageDS9, the nine photometry files were merged into a single stellar pho-tometric catalogue. By comparison, the galaxy phopho-tometric catalogue (i.e. that containing all objects with shar p> 0.2) contains approximately four times as many objects as the stellar catalogue. The stellar catalogue is shown in Table2, where we use flags to denote whether the object is in the uniform selection (Funi= 1), is a variable star (Fvar= 1), or
is identified as a probable member on spectroscopic (Fspec
= 1) or photometric grounds (Fphot = 1).
3 THE COLOUR MAGNITUDE DIAGRAM
3.1 Reddening Correction
We first correct the Crater II photometry for foreground reddening, obtaining E(B-V ) from the Schlegel, Finkbeiner & Davis(1998) interstellar dust maps using the python task dustmaps (Green 2018). Although the reddening is small due to the high Galactic latitude, the very large field of DECam usually means that the reddening varies across the field, and so this aspect should be taken into account (see Figure 1). In order to apply the reddening correction, we correct each g and i magnitude of our detected sources using theSchlegel, Finkbeiner & Davis(1998) reddening values and the coeffi-cients given inSchlafly & Finkbeiner(2011), i.e. Ag= 3.303
176.5
177.0
177.5
178.0
178.5
RA [deg]
19.25
19.00
18.75
18.50
18.25
18.00
17.75
17.50
17.25
Dec [deg]
0.0300
0.0325
0.0350
0.0375
0.0400
0.0425
0.0450
0.0475
0.0500
E(B-V)
Figure 1. Interstellar dust reddening map from Schlegel, Finkbeiner & Davis(1998) of the central ∼3 sq. deg. of Crater II observed with DECam.
E(B-V ), Ai= 1.698 E(B-V ). The same procedure was applied
in the companion paper (Vivas et al. 2019).
The reddening-corrected i, g −i CMDs are shown in Fig-ure3, where results for both the full and uniform reductions are displayed, each of the two sets of three panels depict stars within a elliptical distance2 of 0.35 degrees of the center of Crater II, between 0.35 and 0.65 degrees, and exterior to 0.65 degrees. We denote these inner, central, and outer regions, respectively.
3.2 CMD Description
The CMD (Figure3) reaches to g, i ∼ 25.5 and the stellar se-quences belonging to Crater II are thus defined to well below the level of the oldest MSTO. Crater II stars are prominent in the inner and central regions, while the outer region is dominated by field stars. In the outer region of the DE-Cam field, compact and relatively blue galaxies dominate in numbers over both field and Crater II stars for magni-tudes fainter than i ∼ 24.5. With low S/N some galaxies will have measured value of DAOPHOT shar p < 0.2 and will thus be classified as stars, and given the relative numbers, will appear on the CMD. It is notable that this contamination is less prominent in the uniform sample than for the full sam-ple, as expected since the uniform sample will exclude stars with low S/N for a given magnitude. Over the whole field, compact galaxies outnumber stars by a factor three, but as previously discussed a cut on DAOPHOT sharp excludes these with high efficiency except near the faint magnitude cutoff. Crater II shows a strongly populated HB in the vicinity of the RRL, the latter are relatively easy to see on the CMD since they are bluer than the majority of field stars. There are red HB (RHB) stars, much more contaminated by MSTO field stars than the RRL. There is a likely increase in density of the RHB stars of stars near the red end of the RHB. There appear to be no blue HB (BHB) stars at all, and this is consistent with the RRL distribution, see discussion
2 We use the elliptical geometry for Crater II as determined from
the RRL (Vivas et al. 2019) so the elliptical distance stated is half of the geometrical constant of the ellipse at the position of each star. We denote this by using the nomenclature r’.
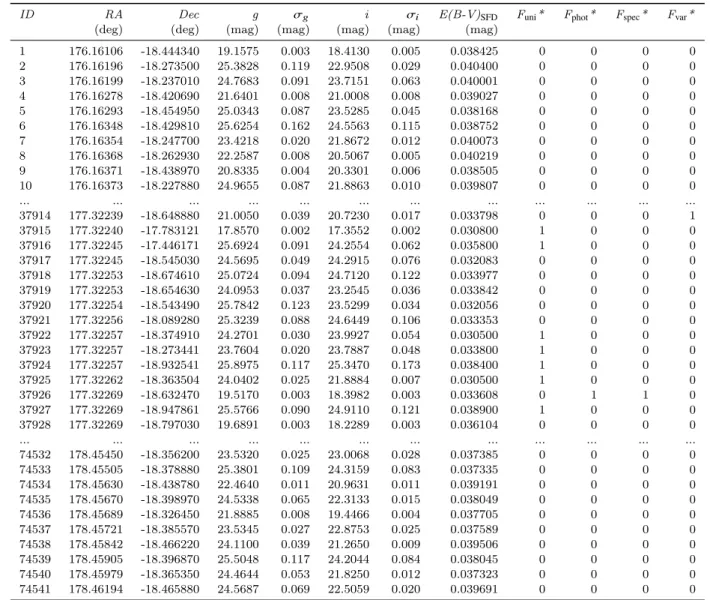
Table 2. Crater II Stellar Photometry Catalogue
ID RA Dec g σg i σi E(B-V)SFD Funi* Fphot* Fspec* Fvar*
(deg) (deg) (mag) (mag) (mag) (mag) (mag)
1 176.16106 -18.444340 19.1575 0.003 18.4130 0.005 0.038425 0 0 0 0 2 176.16196 -18.273500 25.3828 0.119 22.9508 0.029 0.040400 0 0 0 0 3 176.16199 -18.237010 24.7683 0.091 23.7151 0.063 0.040001 0 0 0 0 4 176.16278 -18.420690 21.6401 0.008 21.0008 0.008 0.039027 0 0 0 0 5 176.16293 -18.454950 25.0343 0.087 23.5285 0.045 0.038168 0 0 0 0 6 176.16348 -18.429810 25.6254 0.162 24.5563 0.115 0.038752 0 0 0 0 7 176.16354 -18.247700 23.4218 0.020 21.8672 0.012 0.040073 0 0 0 0 8 176.16368 -18.262930 22.2587 0.008 20.5067 0.005 0.040219 0 0 0 0 9 176.16371 -18.438970 20.8335 0.004 20.3301 0.006 0.038505 0 0 0 0 10 176.16373 -18.227880 24.9655 0.087 21.8863 0.010 0.039807 0 0 0 0 ... ... ... ... ... ... ... ... ... ... ... ... 37914 177.32239 -18.648880 21.0050 0.039 20.7230 0.017 0.033798 0 0 0 1 37915 177.32240 -17.783121 17.8570 0.002 17.3552 0.002 0.030800 1 0 0 0 37916 177.32245 -17.446171 25.6924 0.091 24.2554 0.062 0.035800 1 0 0 0 37917 177.32245 -18.545030 24.5695 0.049 24.2915 0.076 0.032083 0 0 0 0 37918 177.32253 -18.674610 25.0724 0.094 24.7120 0.122 0.033977 0 0 0 0 37919 177.32253 -18.654630 24.0953 0.037 23.2545 0.036 0.033842 0 0 0 0 37920 177.32254 -18.543490 25.7842 0.123 23.5299 0.034 0.032056 0 0 0 0 37921 177.32256 -18.089280 25.3239 0.088 24.6449 0.106 0.033353 0 0 0 0 37922 177.32257 -18.374910 24.2701 0.030 23.9927 0.054 0.030500 1 0 0 0 37923 177.32257 -18.273441 23.7604 0.020 23.7887 0.048 0.033800 1 0 0 0 37924 177.32257 -18.932541 25.8975 0.117 25.3470 0.173 0.038400 1 0 0 0 37925 177.32262 -18.363504 24.0402 0.025 21.8884 0.007 0.030500 1 0 0 0 37926 177.32269 -18.632470 19.5170 0.003 18.3982 0.003 0.033608 0 1 1 0 37927 177.32269 -18.947861 25.5766 0.090 24.9110 0.121 0.038900 1 0 0 0 37928 177.32269 -18.797030 19.6891 0.003 18.2289 0.003 0.036104 0 0 0 0 ... ... ... ... ... ... ... ... ... ... ... ... 74532 178.45450 -18.356200 23.5320 0.025 23.0068 0.028 0.037385 0 0 0 0 74533 178.45505 -18.378880 25.3801 0.109 24.3159 0.083 0.037335 0 0 0 0 74534 178.45630 -18.438780 22.4640 0.011 20.9631 0.011 0.039191 0 0 0 0 74535 178.45670 -18.398970 24.5338 0.065 22.3133 0.015 0.038049 0 0 0 0 74536 178.45689 -18.326450 21.8885 0.008 19.4466 0.004 0.037705 0 0 0 0 74537 178.45721 -18.385570 23.5345 0.027 22.8753 0.025 0.037589 0 0 0 0 74538 178.45842 -18.466220 24.1100 0.039 21.2650 0.009 0.039506 0 0 0 0 74539 178.45905 -18.396870 25.5048 0.117 24.2044 0.084 0.038045 0 0 0 0 74540 178.45979 -18.365350 24.4644 0.053 21.8250 0.012 0.037323 0 0 0 0 74541 178.46194 -18.465880 24.5687 0.069 22.5059 0.020 0.039691 0 0 0 0 *Funi, Fphot, Fspec, and Fvarare flags that show if a particular star has been identified in the uniform catalogue, as photometric member,
as spectroscopically-confirmed star, and as variable star member, respectively.
Notes.- Table2is published in its entirety in the machine-readable format. A portion is shown here for guidance regarding its form and content.
in Vivas et al. (2019). The RGB is narrow, down to the base, however the subgiant branch (SGB) is clearly split into two components, both feeding into the RGB. There is an indication that the brighter SGB is less prominent at larger radii, this will be discussed in the following section. There are many blue stragglers, but no turn-off brighter than the two just described is visible.
The Crater II AGB stars and RGB stars brighter than the HB are difficult to discern from amongst the foreground field stars, even in the inner regions. However there are three ways in principle that we can identify Crater II stars in the field-star dominated regions of the CMD.
Firstly, we can cross reference our photometry to stars classified as members byCaldwell et al. (2017); Fu, Simon & Alarc´on Jara (2019) on the basis of radial velocity and metallicity; we call this the spectroscopic membership sam-ple. There are a total of 70 stars in this sample, 56 of them are inCaldwell et al.(2017) and 35 inFu, Simon & Alarc´on
Jara (2019), with 21 stars in common between both cata-logues. It is worth noting that, by definition, this is a very pure sample.
Secondly, we have u band photometry for all stars to below the level of the HB, and so can select for stars that are metal-poor in the two-colour diagram, and also lie close to the cluster sequences in the CMD. In order to separate candidates and field stars, we followed the prescription de-scribed byDi Cecco et al.(2015) andCalamida et al.(2017). Briefly, we generated two isodensity maps in the i, u − g and in the g, u − g CMDs and created two ridge lines that helped us to locate our most probable candidates. These candidates were selected considering those stars located between ±1σ (defined as the quadratic sum of the photometric errors in the three bands) to the 3D ridge line and their position in the (u − g), (g −i) diagram. We selected a total of 1166 stars that we call the photometric catalogue. This method is expected to work well for AGB and RGB stars because the magnitude
6
A.R. Walker et al.
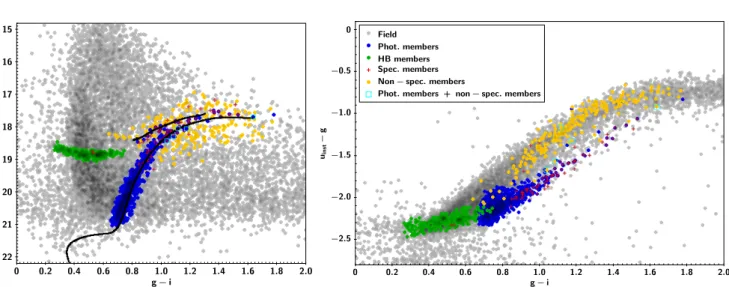
0 0:2 0:4 0:6 0:8 1:0 1:2 1:4 1:6 1:8 2:0 g ¡ i 15 16 17 18 19 20 21 22 uin st 0 0:2 0:4 0:6 0:8 1:0 1:2 1:4 1:6 1:8 2:0 g ¡ i ¡2:5 ¡2:0 ¡1:5 ¡1:0 ¡0:5 0 uin st ¡ g Field Phot: members HB members Spec: membersNon ¡ spec: members
Phot: members + non ¡ spec: members
Figure 2. Left.- (uinst, g − i) colour-magnitude diagram of the sources contained within the DECam FoV centered on Crater II. Field
stars are shown in grey, photometric members in blue (AGB+RGB) and in green (HB), spectroscopically confirmed members as red crosses and spectroscopically confirmed non-members in yellow. Cyan open squares display those stars that were classified in this work as photometric members of Crater II but they are not members from the spectroscopy. A 12.5 Gyr isochrone of [Fe/H] = -2.0 dex is plotted for guidance. Right.- Colour-colour diagram for the same sources. The spectroscopically confirmed non-members are located in the region of the more metal-rich stars, while the members of Crater II are in the region of the most metal-poor stars.
of these stars in the g and i bands is a strong function of the colour, and thus provides an effective constraint. We can select HB stars similarly, although the small range in lumi-nosity makes field star discrimination less effective. Figure2 shows, in the left panel, the (uinst, g − i) CMD and, in the
right panel, the (uinst− g) versus (g − i) colour-colour
dia-gram for the selected photometric membership sample with blue (RGB+AGB) and green (HB) dots while red crosses represent the spectroscopic membership sample.
We can test for field star contamination in the RGB and AGB photometric catalogue (863 stars) in the following way: Caldwell et al.(2017) in their table 2 list all their observed stars, and have provided probabilities (private communica-tion to M. Monelli) that each star is a Crater II member. All except a very few stars are classified as member (prob-ability 1) or non-member (prob(prob-ability 0), see Caldwell et al.(2017) for details of how they calculate the probability. There are 314 stars with probability 0, represented as yellow dots in Figure 2. We cut off our photometric catalogue at i = 20.1 to match the spectroscopic catalogue, leaving 157 stars, and search for positional matches; we find five (cyan open squares in Figure2) stars with positional agreements 0.2-0.3 arcsec using a 5 arcsec window. With the areas of the two catalogues differing by a factor 2.0, then the contamina-tion in our catalogue of RGB and AGB stars is thus 5 × 2 / 157 = 0.06. This analysis does assume that the fainter stars in our photometric catalogue have the same degree of field star contamination as do those brighter than i = 20.1 but this is a reasonable assumption, see Figure2. We note that one of the five stars is metal poor, [Fe/H] = -1.67 and with a radial velocity indicating a non-member, is apparently a halo giant at approximately the distance of Crater II. The remaining four stars are non members on the grounds of both metallicity and radial velocity.
The photometric sample also contains 303 RHB stars. Unfortunately, we have no way of testing spectroscopically for membership in any significant way, with only two RHB
stars in the Fu, Simon & Alarc´on Jara (2019) catalogue. Membership can be evaluated by counting field stars in pho-tometric (magnitude, colour) boxes above and below the RHB. This is complicated by the high density of field stars, and the rapid change of star density as a function of colour as the MSTO colour for the foreground stars is approached. We conclude that the photometric catalogue for the RGB and AGB stars is pure at the 95% level, but the RHB star entries (303 stars) will be contaminated by field stars at a much higher level, and one that is difficult to estimate.
Thirdly, we have the variable star members. In our com-panion paper (Vivas et al. 2019), we have identified a total of 106 variable star members of Crater II which consist of 983 RRL, seven Anomalous Cepheid (AC), and one dwarf Cepheid (DC) stars. This sample is also considered a very pure.
3.3 Isochrone Comparison to the CMD
The BaSTI4 (Hidalgo et al. 2018) model grid selected for the present analysis corresponds to that of stellar evolution-ary computations accounting for the occurrence of mass loss (according to the Reimers’ law and the free parameter η set to the value of 0.3) as well as for core convective over-shooting during the central H-burning stage and atomic dif-fusion. However core convective overshooting is irrelevant in the present context since low-mass (i.e. old) stars burn H into a radiative core. In Figure4we compare the CMD se-quences with alpha-enhanced (Pietrinferni et al. in prep.) BaSTI isochrones and zero-age horizontal branch (ZAHB) models.
The spectroscopy byCaldwell et al.(2017);Fu, Simon
3 There are 99 RRL members of Crater II but one, discovered by Joo et al.(2018) is outside our DECam field of view.
0.0 0.5 1.0 1.5 g0 i0 16 18 20 22 24 i0 N = 43891
Full Catalog, r ' 0.65 deg
0.0 0.5 1.0 1.5 g0 i0 16 18 20 22 24 i0 N = 19693
Full Catalog, 0.35 r ' < 0.65 deg
0.0 0.5 1.0 1.5 g0 i0 16 18 20 22 24 i0 N = 10957
Full Catalog, r ' < 0.35 deg
0.0 0.5 1.0 1.5 g0 i0 16 18 20 22 24 i0 N = 25998
Uniform Catalog, r ' 0.65 deg
0.0 0.5 1.0 1.5 g0 i0 16 18 20 22 24 i0 N = 11908
Uniform Catalog, 0.35 r ' < 0.65 deg
0.0 0.5 1.0 1.5 g0 i0 16 18 20 22 24 i0 N = 6388
Uniform Catalog, r ' < 0.35 deg
Figure 3. Colour-Magnitude diagrams of Crater II. Top and bottom panels represent the full and the uniform catalogues, respectively (see the text for details). Left panels show those stars within 0.35◦elliptical distance (see text for details) centred on Crater II, middle
panels display those stars within 0.35◦and 0.65◦, while right panels show those stars beyond 0.65◦.
& Alarc´on Jara(2019) finds mean [Fe/H] = -2.0 with a small dispersion (sigma ∼ 0.2 ± 0.1 dex). With Crater II lying near the boundary between UFDs and classical dwarfs (Simon 2019), we assume that Crater II will behave similarly with respect to alpha element enhancement. All these galaxies, at the metallicity of Crater II or lower, are alpha-enhanced (Kirby, et al. 2011; Vargas, et al. 2013; Simon 2019) with the transition from high alpha to solar alpha ratio driven by the change from dominance of SN II to SN Ia, and showing variance from galaxy to galaxy depending on the details of the star formation history for each. For Crater II a choice of [α/Fe] = +0.3 would seem appropriate. We therefore choose BaSTI-IAC alpha-enhanced isochrones (Pietrinferni et al. in preparation) with [Fe/H] = -2.0 and [α/Fe] = +0.3, af-ter exploring parameaf-ter space quite widely. In matching the isochrones and the ZAHB to the data we use the most
re-cent RRL distance modulus (µ0= 20.333 ± 0.004 mag,Vivas
et al. 2019), and apply a small colour shift of 0.04 magni-tude so that the isochrones better coincide with the obser-vational sequences. The origin of this colour shift could be one or more of small errors in the reddening scale, errors in the photometric zeropoints, or a residual shortcoming in the adopted colour-effective temperature scale adopted for transferring the isochrones from the theoretical plane to the observational one.
The right panel of Figure4 shows that the photomet-ric (dark blue dots) and spectroscopic (black open squares) members of Crater II play an important role when doing the isochrone matching. The age of the isochrone that best matches the older turnoff is 12.5 Gyr and the younger SGB is best matched with an isochrone with the same metallicity and an age of 10.5 Gyr. The latter is a minority population,
8
A.R. Walker et al.
0.0
0.5
1.0
1.5
g
0
i
0
16
18
20
22
24
i
0
12.5 Gyr, [Fe/H]=-2.0, [ /Fe]=+0.3
10.5 Gyr, [Fe/H]=-2.0, [ /Fe]=+0.3
ZAHB [Fe/H]=-2.0, [ /Fe]=+0.3
0.0
0.5
1.0
1.5
g
0
i
0
16
18
20
22
24
i
0
phot
var
spec
Figure 4. Isochrone Comparison to the CMD of Crater II (r’< 0.78◦, 1.5×r
h). The CMD was corrected star-by-star by theSchlegel, Finkbeiner & Davis (1998) reddening map, using the modified version ofSchlafly & Finkbeiner (2011). Orange and light blue lines represent the best set of [Fe/H]=-2.0 alpha enhanced ([α/Fe]=+0.3) isochrones from BaSTI (Pietrinferni et al. in preparation) that match the CMD of Crater II, 12.5 Gyr and 10.5 Gyr respectively. Isochrones and ZAHB were shifted using a distance modulus for Crater II of 20.33 mag (Vivas et al. 2019). Additionally, we add 0.04 mag to the total reddening in order to make the isochrones and the stellar sequences match better (see text for more details). Spectroscopic members are shown as black squares in the right panel, while photometric members are displayed as dark blue dots and variable members (RR Lyrae stars, Anomalous Cepheids, dwarf Cepheid) are purple dots.
and given the errors in the individual spectroscopic mea-surements for the stars classed as Crater II members, we cannot rule out that the 10.5 Gyr stars might have slightly lower alpha elements abundance and slightly higher [Fe/H] than does the 12.5 Gyr population, a scenario similar to that convincingly demonstrated for the Carina dwarf galaxy by VandenBerg, Stetson & Brown (2015). If, for example, we compare a solar-scaled isochrone with [Fe/H] = -1.7 ( Hi-dalgo et al. 2018) to the younger population then an excel-lent match is obtained, although at an age 1 Gyr younger (9.5 Gyr) than the alpha enhanced isochrone.
Similarly, while there is no obvious evidence for older (12.5 - 13.5 Gyr) stars, the lack of sensitivity of the RGB colour to metallicity for metal poor stars, the age-metallicity degeneracy, and the unknown alpha element enhancement for such stars, make it possible to hide such a minority pop-ulation. We return to this issue in §6.
Note that the isochrones are placed on the centre of the star distributions in the CMD; compared to the magnitude errors at the level of the SGBs both appear to be broadened in age. The younger population is close to, or under, the age limit of 10-11 Gyr for forming RRL (Walker 1989;Glatt et al. 2008;Catelan 2018), and is thus expected to contain few
or no RRL, with the majority of the core-helium burning stars populating the RHB.
3.4 The Horizontal Branch Morphology
We consider an inner region with r’< 35 arcmin (see §4.2) within which we count 0 BHB, 43 RRL and 80 RHB stars, and (see Table 3) 530 stars from the older SGB and 233 from the younger. The older SGB will populate the RHB and RRL, while the younger SGB will likely only populate the RHB, if so we calculate that 43 RRL and 42 RHB stars belong to the 12.5 Gyr population and 38 RHB stars belong to the 10.5 Gyr population. We calculate the HB morphol-ogy parameter (Lee 1990) for the 12.5 Gyr population to be
N(BHB)−N(RHB)
N(BHB)+N(RRL)+N(RHB)= −0.49.
As demonstrated by Lee et al.(1994) and Sarajedini, Lee & Lee(1995) for Galactic globular clusters, a HB dom-inated by RRL and RHB stars with few or no BHB stars can be produced by high metal abundance, clearly not the case here, but also by young age. For a metal poor popula-tion such as Crater II, an age of the RRL of 11-12 Gyr after applying a small zeropoint offset, accounting for the modern
age of the Universe (13.8 Gyr), to the results of Lee et al. (1994) andSarajedini, Lee & Lee(1995), is consistent with the observed HB morphology, but suggesting an age slightly younger than found by our isochrone fitting.
Other parameters that can affect the HB morphol-ogy are He abundance enhancements or spread, or a non-canonical value for the mass loss on the RGB. After the discovery of multiple stellar populations in globular clusters there is compelling evidence (Milone, et al. 2014) that, after metallicity and age, He abundance anomalies play a major role in determining HB morphology. However for Crater II such anomalies would produce BHB stars, which are not ob-served. For mass loss,McDonald & Zijlstra(2015) show for a large sample of globular clusters that there is little disper-sion in the measurements. We will proceed for Crater II by making the assumption that age and metallicity are driv-ing the HB morphology, as there is no evidence from the available data that more exotic explanations are required.
3.5 The CMD and the RR Lyrae Variables Joo et al.(2018); Monelli et al.(2018);Vivas et al.(2019) show that the Crater II RRL period distribution is unusual with only a few RRcd stars and many RRab. This distribu-tion implies that a 12.5 Gyr stellar populadistribu-tion, during the core He-burning stage, is not able to populate the whole RR Lyrae domain from the blue edge of the First Over-tone instability strip to the red boundary of the Funda-mental strip. In this respect Crater II is similar to the un-usual Galactic globular cluster Ruprecht 106 (Dotter et al. 2018), which is young, metal-poor and contains only RRab variables (Buonanno, Corsi, Pecci, Richer & Fahlman 1993; Kaluzny, Krzeminski & Mazur 1995;Leaman, VandenBerg & Mendel 2013).
By considering the dispersion in brightness in the i-band RRL period-luminosity (PL) relation, and dividing the RRab stars into bright (B) and faint (F) groups by consid-ering the position of each star relative to the mean PL re-lation, Vivas et al. (2019) show that the two groups have a different spatial distribution with the F group more cen-trally concentrated (their figure 12). This is interpreted as a small difference in the mean metallicity (nominally 0.17 dex) between the two groups. We do note, considering the spec-troscopic sample of stars and removing the AGB stars, the RGB stars are almost all closer than 0.02 mag in colour to the fitted isochrone (Figure4). The BaSTI isochrones show that a small systematic metallicity shift of 0.1-0.2 dex could be hidden in the present observations particularly if com-bined with a slight age change (e.g. a few 100 Myr) given the well-known degeneracy between RGB age and metallic-ity, in the sense that younger age will produce a bluer RGB and higher metallicity will make the RGB redder.
Additionally, we plotted a Cugi diagram (Monelli, et
al. 2013) for the Crater II RGB stars with spectroscopy, this pseudo-colour can split stars with different metalliici-ties over much of the RGB. We divided the stars into two groups divided by [Fe/H] = -2.0, and found no significant difference between the location of the two groups of stars in this diagram. We conclude that we are not able, with the photometry alone, to provide further insight into the possi-ble metallicity gradients in Crater II suggested byVivas et al.(2019).
4 CRATER II STRUCTURE AND MOTION
4.1 Proper Motion
All proper motion measurements are from Gaia DR2 (Gaia Collaboration 2018). Figure5has three panels, the left panel shows the 2D proper motion distribution for stars in an ex-ternal field comprising an annulus with radii of 1.5 and 2.0 deg centered on Crater II, the center panel shows the 2D proper motions distribution for stars inside r < 1.0 deg, and the right panel is the subtraction between the first two pan-els (normalized) that clearly reveals Crater II. Guided by this, we proceed by selecting stars in our catalogue that sat-isfy the following criteria: they are flagged as photometric, spectroscopic, or variable star members; they are found in Gaia DR2 with proper motion errors smaller than 1 mas yr−1; and they have proper motions between ±3 mas yr−1 mas yr−1 (both in RA and Dec). This gives a sample of 80 stars, which are displayed as orange symbols in Figure6, of which 50 have spectroscopy and thus also appear in proper motion analyses byFritz et al.(2018);Fu, Simon & Alarc´on Jara(2019), 65 are photometric members (of which 36 have spectroscopy), and 1 AC. The proper motion of Crater II is then determined by a weighted average of the proper mo-tions for these 80 stars, in units of mas yr−1,µαcos δ= −0.14 ± 0.07 (standard deviation = 0.66),µδ= −0.10 ±0.04
(stan-dard deviation = 0.38), represented by a blue square in Fig-ure6. This Crater II systemic proper motion, using a slightly larger sample of stars, is consistent within the errors with the two previous Gaia derived proper motions (Fritz et al. 2018: µαcos δ = -0.18 ± 0.06, µδ = -0.11 ± 0.03 from 58 Caldwell et al. 2017spectroscopic members; Fu, Simon & Alarc´on Jara 2019: µαcos δ = -0.17 ± 0.06, µδ = -0.07 ± 0.07 from 37 of their spectroscopic members).
4.2 The Spatial Distribution of Crater II stars The GB stars (RGB + AGB) of Crater II overall have an elliptical distribution similar to that found for the RRL by Vivas et al.(2019), the parameters of which we have adopted for the analysis in this section. In Figure 7 we show the distribution and the morphology for the 863 GB stars from the photometric sample together with the proper motion vector obtained in §4.1.
The distribution of the members of Crater II (see §3.2) does not show a peaked central concentration, also suggested from the distribution of RRL (Vivas et al. 2019) and con-firmed by the larger sample of stars here. Although over-all the distribution of stars is smooth, on closer examina-tion there are indicaexamina-tions of inhomogeneities in the spatial distribution of stars. Figure8, an isodensity contour map, shows two overdensities located at (RA = 177.45 deg, DEC = -18.47 deg) and (RA = 177.18 deg, DEC = -18.40 deg). They are approximately the same distance from the Crater II center (displayed as a black cross), and between these two peaks, in the center of Crater II, there is a 2-σ fall in the number of stars. The reliability of these overdensities is sta-tistically confirmed by calculation of Poisson uncertainties.
There is an indication from Figure3that there may be a difference in the relative numbers of the two SGB popu-lations as a function of the elliptical distance (r’), and we investigate this further by selecting stars from the SGB and
10
A.R. Walker et al.
10
0
10
cos (masyr
1
)
10
5
0
5
10
(m
as
yr
1
)
1.5 < r < 2.0
10
0
10
cos (masyr
1
)
10
5
0
5
10
(m
as
yr
1
)
r < 1.0
10
0
10
cos (masyr
1
)
10
5
0
5
10
(m
as
yr
1
)
Subtraction
Figure 5. Left.- Proper motions of a field region defined by a circular ring of 1.5◦< r < 2.0◦centered on Crater II. Middle.- Proper motions of a circular area inside r< 1.0◦centered in Crater II. Right.- The subtraction between left and middle panel reveal the proper motion of Crater II. The intersection of the two dashed blue lines marks the locus of the proper motion determined by the members of Crater II (see text for details).
Figure 6. Proper motions of the Crater II photometric, spectro-scopic, and variable members (orange) present in our catalogue whose proper motion errors are smaller than 1 mas yr−1. The blue square shows the systemic proper motions of Crater II obtained from the selected (80) stars:µαcos δ = -0.14 ± 0.07 mas yr−1,µδ
= -0.10 ± 0.04 mas yr−1. The grey scale map shows the proper motions of a field mostly outside Crater II, defined by a region of 1.5◦< r < 2.0◦centered on Crater II.
the top of the MS region of the CMD (from i = 22.8 to i = 24.3). We follow up the 10.5 Gyr isochrone with a circular bin of radius 0.02 mag, and with a circular bin of radius 0.03 mag for the 12.5 Gyr isochrones. At the ends of the region under consideration the two tracks are close enough so the stars may appear in both selections, in such cases the clos-est isochrone is selected so that there is no double counting. The selection performed is shown in Figure9.
We then use the center of Crater II and the elliptical shape as defined by the RRL (Vivas et al. 2019) and divide into three annuli, the inner contains stars with elliptical dis-tance (r’) less than 0.35 degrees, the second with elliptical distances between 0.35 and 0.65 degrees, and the outer with elliptical distances between 0.70 and 0.78 degrees. Although there are Crater II stars across the whole DECam field, their numbers in this outer annulus will be very few compared to the field stars, and for the MSTO region a good approxi-mation for the purposes of this calculation is zero Crater II stars, however we conservatively consider an error of 10
per-176.0
176.5
177.0
177.5
178.0
178.5
[deg]
19.5
19.0
18.5
18.0
17.5
[d
eg
]
1 × rh 2 × rh GB phot. mem. CenterFigure 7. Spatial distribution of the giant branch (RGB + AGB) stars considered photometric members (grey dots) of Crater II. Morphological parameters were calculated using a robust bivari-ate normal distribution fit to these stars. The ellipticity (0.12) and position angle (135◦) of the blue ellipses located at 1 and 2×
rh (Torrealba et al. 2016) come from the results of this fit. The
new recalculated center of Crater II is marked with a black star. The blue line points to the direction of the semi-major axis, while the black arrow indicates the proper motion direction of Crater II derived in this work (µαcos δ=-0.14 ± 0.07 mas yr−1,µδ=-0.10
± 0.04 mas yr−1).
cent in the outer annulus (field) star counts when using this number to correct the inner and center annulus star counts for field star contamination. For stars definitely identified as Crater II members such as the RRL, no corrections are required for comparing their star counts in the two inner annuli, and the errors quoted derive from the counts only.
The results in Table3highlight the difference between the central concentration of faint and bright RRL, shown as a radial plot in figure 12 ofVivas et al.(2019). This has been interpreted as a slightly more metal poor population
Table 3. Radial Distributions of Crater II Stars
Population Inner Annulus Center Annulus Outer Annulus Normalised Inner Normalised Center Ratio Inner/Center
RR all 43 33 1.3 ± 0.4 RRab bright 12 17 0.7 ± 0.4 RRab faint 27 12 2.2 ± 1.1 12.5 Gyr 656 692 122 530 383 1.38 ± 0.15 10.5 Gyr 266 208 32 233 127 1.83 ± 0.15 Area (deg2) 0.2925 0.7163 0.2827 176.0 176.5 177.0 177.5 178.0 178.5 RA 19.5 19.0 18.5 18.0 17.5 Dec 176.0 176.5 177.0 177.5 178.0 178.5 0 30 60 90 120 N 0 30 60 90 120 N 19.5 19.0 18.5 18.0 17.5
Figure 8. Isodensity contour map and RA and DEC distribu-tions of the members (photometric + spectroscopic + variables) of Crater II.
having a wider spatial distribution than the more metal rich stars. In any case, the spread in metallicity between the two populations is expected to be small. In addition, we con-firm by star counts the visual impression that the SGB plus upper MS stars that follow the 10.5 Gyr isochrone appear slightly more centrally concentrated than those that follow the 12.5 Gyr isochrone. For more populous dwarf galaxies it is commonly found that younger populations are more centrally condensed than older populations (see e.g. Har-beck, et al. 2001;Tolstoy, et al. 2004;Okamoto, et al. 2017), although generally the age differences are greater than for Crater II. While it is suggestive here to make an association between the two populations of SG-MSTO stars and the ap-parent two groups of RRL stars, a direct association is not supported on stellar evolution grounds as discussed above, and the ratios in Table 3 have large error bars. However, the radial distributions of the RRL and the two SG-MSTO stars are not inconsistent, in a scenario of a small increase of metallicity over a rather narrow age range. Spectroscopy of the HB stars, possible with present large telescopes, would help to turn the tentative statements from the present data into firmer conclusions.
0.00 0.25 0.50 0.75 1.00
g
0
i
0
21.5
22.0
22.5
23.0
23.5
24.0
24.5
25.0
i
0
Figure 9. Zoom-in of the MS, SGB and lower RGB of the colour-magnitude diagram of Crater II. Orange (blue) dots represent the older (younger) MS-SGB stars selected under the criteria de-scribed in the text.
5 CRATER II VARIABLE STARS
PROGENITORS
The RRL variables are discussed byJoo et al.(2018); Mon-elli et al.(2018); Vivas et al.(2019), with the latter paper providing a definitive analysis of the pulsational properties. The distribution and relation of the RRL to other CMD components are discussed above. In addition to the 99 RRL (98 measured from DECam data), seven ACs and one DC have been found in Crater II byVivas et al.(2019). With the large numbers of blue stragglers (BS) and no young stars, the DC is interpreted as an SX Phoenicis variable, and its discovery amongst the BS stars is not surprising, indeed there are likely to be more of these (very faint and short period) stars waiting discovery. For the AC, there are two production channels (Bono, Caputo, Santolamazza, Cassisi & Piersimoni 1997; Fiorentino & Monelli 2012; Cassisi & Salaris 2013), the first is from an intermediate age popu-lation that directly produces the 1 − 2 M stars, and for which there is no progenitor evidence from the Crater II CMD, while the second channel is from BS stars. This route also has two possible production channels, both involving
12
A.R. Walker et al.
merging of two stars; in globular clusters stellar collisions in the dense cluster core will be frequent, however this route is clearly not significant for Crater II. Instead, the coalescence of close binaries will be the production channel relevant here (Gautschy & Saio 2017).
6 DISCUSSION AND CONCLUSIONS
From analysis of a deep CMD, and by comparison with the properties of the RRL discussed in detail in a companion pa-per (Vivas et al. 2019) we can make a number of statements about this unusual, but perhaps not uncommon, galaxy.
The main new finding in this paper has been possible thanks to the unprecedentedly deep CMD, which reaches the old MSTO with high photometric precision. The stellar pop-ulations of Crater II are characterized by two main events of star formation that occurred at a mean age of 12.5 and 10.5 Gyr ago. An old (∼ 13.5 Gyr) population seems to be a mi-nor component, as disclosed by the main sequence isochrone fitting, by the HB morphology, which lacks a blue compo-nent, and by the characteristics of the RRL variable star population. These characteristics of the stellar population of Crater II (MV= -8.2) are very unusual among UFDs; a sim-ilarly extended period of star formation in a UFD has been found so far only in the M31 satellite And XVI (Monelli, et al. 2016; MV = −7.3), even though in that case a double
star-formation episode is not evident in the CMD, while it is hinted in the star formation history derived through CMD fitting. What may be the origin of a stellar component with such unusual characteristics? To try to answer this question, we will consider other observed aspects of this galaxy.
Firstly, the Crater II proper motion confirmed here, and the orbit that has been derived (Fritz et al. 2018;Fu, Simon & Alarc´on Jara 2019) suggest strongly that Crater II should be disrupting due to penetrating well into the more central regions of our Galaxy on each orbit. From the current analy-sis, we can state, in contrast, that the galaxy structure seems regular, and the younger (10.5 Gyr) population is more cen-trally concentrated than the older (12.5 Gyr) population, as is common in dwarf galaxies (Harbeck, et al. 2001; Tol-stoy, et al. 2004;Okamoto, et al. 2017), which would support a quiet rather than an episodically violent life. However, we cannot make strong direct statements about this scenario, as a much wider area survey for extra tidal material, in partic-ular RRL, would be needed to provide observational proof.
In this scenario, a relatively minor old population could be explained by preferential tidal stripping in the earliest pericentric passages (see e.g. Fritz et al. 2018for an orbit integration under different assumptions of the Milky Way potential). The second event of star formation could have occurred or even have been triggered by one of these early pericentric passages, before complete removal of gas would have taken place, while the prior star formation events are consistent with star formation occurring along the orbit of the galaxy. This is behavior that is expected from simula-tions (see, e.g.Nichols, Revaz & Jablonka 2015or Hausam-mann, Revaz & Jablonka 2019) and that has been observed, for example, in the Sagittarius dSph, which has retained gas and continued star formation during several pericentric pas-sages prior to infalling (Siegel, et al. 2007).
An alternative scenario would be that Crater II is a
rel-atively recent capture by our Galaxy; a relrel-atively low initial star formation rate could indicate that it formed in an en-vironment isolated from other galaxies.Gallart et al.(2015) suggested that the difference between dwarf galaxies with fast evolution (in fast dwarfs, star formation would have started early, probably before reionization and would have terminated early) compared to slow evolution (low intensity of early star formation, which then takes place for most or all of a Hubble time) depended on the density of the envi-ronment at time of formation, with fast evolvers forming in high density environments.
If the low amount of old population in Crater II is in-trinsic (that is, not due to preferential stripping of the old population), it implies that the rate of star formation was low prior to reionization, and by this Crater II would comply with one of the criteria to be classified as a slow dwarf. How-ever, the relatively early cessation of star formation ∼10 Gyr ago is at odds with the normal definition of a slow dwarf.
A combination of the two scenarios is however plausi-ble. Given the high eccentricity of the derived orbit, and the expected orbital changes along the evolution in live haloes (Nichols, Revaz & Jablonka 2015), the early distance of Crater II to the Milky Way may have been in excess of the currently measured 116.5 kpc (Vivas et al. 2019), and thus, it would have formed in a relatively isolated environment. In fact, even its currently calculated apocenter is similar to that of Milky Way dSph satellites such as Carina or Fornax that show extended star formation and were classified by slow dwarfs by Gallart et al. (2015). Its apocenter is also not unlike the estimated current distance between M31 and And XVI. Given the more eccentric orbit of Crater II com-pared to Carina and Fornax, the closer perigalacticon, pos-sibly combined with the lower mass, would have resulted in a more efficient stripping of the gas in Crater II than in the other two galaxies, and thus resulted in an earlier ces-sation of its star formation. Some characteristics betraying the slow nature of Crater II may still noticeable. The ob-servational search for stripping remnants mentioned above, and a detailed star formation history, carefully dealing with field star subtraction and modeling the HB and MSTO -SGB regions in particular, will help to better delineate the evolutionary history of this intriguing galaxy.
ACKNOWLEDGEMENTS
We thank Giuseppina Battaglia for helpful discussions. This project used data obtained with the Dark En-ergy Camera (DECam), which was constructed by the Dark Energy Survey (DES) collaboration. Funding for the DES Projects has been provided by the U.S. Department of En-ergy, the U.S. National Science Foundation, the Ministry of Science and Education of Spain, the Science and Technol-ogy Facilities Council of the United Kingdom, the Higher Education Funding Council for England, the National Cen-ter for Supercomputing Applications at the University of Illinois at Urbana-Champaign, the Kavli Institute of Cos-mological Physics at the University of Chicago, the Center for Cosmology and Astro-Particle Physics at the Ohio State University, the Mitchell Institute for Fundamental Physics and Astronomy at Texas A&M University, Financiadora de Estudos e Projetos, Funda¸c˜ao Carlos Chagas Filho de
Amparo `a Pesquisa do Estado do Rio de Janeiro, Con-selho Nacional de Desenvolvimento Cient´ıfico e Tecnol´ogico and the Minist´erio da Ciˆencia, Tecnologia e Inovac˜ao, the Deutsche Forschungsgemeinschaft, and the Collaborating Institutions in the Dark Energy Survey. The Collaborating Institutions are Argonne National Laboratory, the Univer-sity of California at Santa Cruz, the UniverUniver-sity of Cam-bridge, Centro de Investigaciones En´ergeticas, Medioambi-entales y Tecnol´ogicas-Madrid, the University of Chicago, University College London, the DES-Brazil Consortium, the University of Edinburgh, the Eidgen¨ossische Technische Hochschule (ETH) Z¨urich, Fermi National Accelerator Lab-oratory, the University of Illinois at Urbana-Champaign, the Institut de Ci`encies de l’Espai (IEEC/CSIC), the Institut de F´ısica d’Altes Energies, Lawrence Berkeley National Labo-ratory, the Ludwig-Maximilians Universit¨at M¨unchen and the associated Excellence Cluster Universe, the University of Michigan, the National Optical Astronomy Observatory, the University of Nottingham, the Ohio State University, the OzDES Membership Consortium the University of Pennsyl-vania, the University of Portsmouth, SLAC National Ac-celerator Laboratory, Stanford University, the University of Sussex, and Texas A&M University.
Based on observations at Cerro Tololo Inter-American Observatory, National Optical Astronomy Observatory (NOAO Prop. ID 2017A-0210 P.I. A.R. Walker), which is operated by the Association of Universities for Research in Astronomy (AURA) under a cooperative agreement with the National Science Foundation.
This research has been supported by the Spanish Min-istry of Economy and Competitiveness (MINECO) under the grant AYA2014-56795-P. CG and MM acknowledge support by the Spanish Ministry of Economy and Com-petitiveness (MINECO) under the grant AYA2017-89076-P. SC acknowledges support from Premiale INAF MITiC, from INFN (Iniziativa specifica TAsP), and grant AYA2013-42781P from the Ministry of Economy and Competitiveness of Spain.
This research has made use of the NASA/IPAC Ex-traGalactic Database (NED) which is operated by the Jet Propulsion Laboratory, California Institute of Technology, under contract with the National Aeronautics and Space Administration.
REFERENCES
Alam, S., et al. 2015, ApJS, 219, 12
Bernstein G. M., et al., 2017, PASP, 129, 114502
Bono G., Caputo F., Santolamazza P., Cassisi S., Piersimoni A., 1997, AJ, 113, 2209
Buonanno R., Corsi C. E., Pecci F. F., Richer H. B., Fahlman G. G., 1993, AJ, 105, 184
Calamida A., et al., 2017, AJ, 153, 175
Caldwell, N., Walker, M.G., Mateo, M., 2017, ApJ, 815, 117 Cassisi S., Salaris M., 2013, Old Stellar Populations: How to Study
the Fossil Record of Galaxy Formation. Wiley, New York Catelan M., 2018, IAUS, 11, IAUS..334
Di Cecco A., et al., 2015, AJ, 150, 51
Dotter A., Milone A. P., Conroy C., Marino A. F., Sarajedini A., 2018, ApJL, 865, L10
Fattahi, A., et al., 2018, MNRAS, 476, 3816 Fiorentino G., Monelli M., 2012, A&A, 540, A102 Fiorentino, G., et al., 2015, ApJ, 798, 12
Fritz T. K., et al., 2018, A&A, 619, A103
Fu S. W., Simon J. D., Alarc´on Jara A. G., 2019, ApJ, 883, 11 Gaia Collaboration, arXiv:1804.09365
Gallart, C., et al., 2015, ApJ, 811, 18
Gautschy A., Saio H., 2017, MNRAS, 468, 4419 Glatt, K., et al., 2008, A.J., 135, 1106
Green, G. M., 2018, Journal of Open Source Software, 3(26), 695 Harbeck D., et al., 2001, AJ, 122, 3092
Hausammann L., Revaz Y., Jablonka P., 2019, A&A, 624, A11 Hidalgo, S.L., et al., ApJ, 856, 125
Ivezi´c ˇZ., Connelly A. J., VanderPlas J. T., Gray A., 2014, Statistics, Data Mining, and Machine Learning in Astronomy, Princeton Series in Modern Observational Astronomy Joo, S.-J., et al., 2018, ApJ, 861, 23
Kirby E. N., Cohen J. G., Smith G. H., Majewski S. R., Sohn S. T., Guhathakurta P., 2011, ApJ, 727, 79
Lee, Y.-W., Demarque, P., Zinn, R., 1994, Ap.J., 423, 248 Lee Y.-W., 1990, ApJ, 363, 159
Kaluzny J., Krzeminski W., Mazur B., 1995, AJ, 110, 2206 Leaman R., VandenBerg D. A., Mendel J. T., 2013, MNRAS, 436,
122
McDonald, I., Zijlstra, A.A., 2015, MNRAS, 448, 502 Milone A. P., et al., 2014, ApJ, 785, 21
Monelli M., et al., 2013, MNRAS, 431, 2126 Monelli M., et al., 2016, ApJ, 819, 147 Monelli, M., et al., 2018, MNRAS, 479, 4279
Nichols M., Revaz Y., Jablonka P., 2015, A&A, 582, A23 Nidever, D.L., et al., 2017, AJ, 154, 199
Okamoto S., et al., 2017, MNRAS, 467, 208
Sanders J. L., Evans N. W., Dehnen W., 2018, MNRAS, 478, 3879 Sarajedini A., Lee Y.-W., Lee D.-H., 1995, ApJ, 450, 712 Schlafly, E.F., & Finkbeiner, D.P., 2011, ApJ, 737, 103 Schlafly, R.F., Green, G.M., Lang, D., 2018, ApJS, 234,39 Schlegel D. J., Finkbeiner D. P., Davis M., 1998, ApJ, 500, 525 Scolnic, D., Casertano, S., Riess, A., 2015, ApJ, 815, 117 Siegel M. H., et al., 2007, ApJL, 667, L57
Simon, J.D., 2019, ARA&A, 57, 375 Stetson, P.B., 1987, PASP, 99, 191 Stetson, P.B., 1994, PASP, 106, 250 Tolstoy E., et al., 2004, ApJL, 617, L119
Tonry, J.L., Stubbs, C.W., Lykke, K.R., 2012, ApJ, 750, 99 Torrealba, G., Koposov, S.E., Belokurov, V, Irwin, M., 2016,
MN-RAS, 459, 2370
Torrealba, G., Belokurov, V., Koposov, S.E., 2019, MNRAS, 488, 2743
Valdes, F., Gruendl, R., DES Project, 2014, ASPC, 485, 379 VandenBerg D. A., Stetson P. B., Brown T. M., 2015, ApJ, 805,
103
Vargas L. C., Geha M., Kirby E. N., Simon J. D., 2013, ApJ, 767, 134
Vivas, A.K., et al., 2019, submitted Walker, A.R., 1989, PASP, 101, 570
This paper has been typeset from a TEX/LATEX file prepared by