Publisher’s version / Version de l'éditeur:
Vous avez des questions? Nous pouvons vous aider. Pour communiquer directement avec un auteur, consultez la première page de la revue dans laquelle son article a été publié afin de trouver ses coordonnées. Si vous n’arrivez pas à les repérer, communiquez avec nous à [email protected].
Questions? Contact the NRC Publications Archive team at
[email protected]. If you wish to email the authors directly, please see the first page of the publication for their contact information.
https://publications-cnrc.canada.ca/fra/droits
L’accès à ce site Web et l’utilisation de son contenu sont assujettis aux conditions présentées dans le site
LISEZ CES CONDITIONS ATTENTIVEMENT AVANT D’UTILISER CE SITE WEB.
Scientific Reports, 10, 1, 2020-07-22
READ THESE TERMS AND CONDITIONS CAREFULLY BEFORE USING THIS WEBSITE. https://nrc-publications.canada.ca/eng/copyright
NRC Publications Archive Record / Notice des Archives des publications du CNRC :
https://nrc-publications.canada.ca/eng/view/object/?id=60447a3d-1dc6-4f8d-aba3-56334d2dd389
https://publications-cnrc.canada.ca/fra/voir/objet/?id=60447a3d-1dc6-4f8d-aba3-56334d2dd389
Archives des publications du CNRC
This publication could be one of several versions: author’s original, accepted manuscript or the publisher’s version. / La version de cette publication peut être l’une des suivantes : la version prépublication de l’auteur, la version acceptée du manuscrit ou la version de l’éditeur.
For the publisher’s version, please access the DOI link below./ Pour consulter la version de l’éditeur, utilisez le lien DOI ci-dessous.
https://doi.org/10.1038/s41598-020-68934-y
Access and use of this website and the material on it are subject to the Terms and Conditions set forth at
A pooled genome-wide screening strategy to identify and rank
influenza host restriction factors in cell-based vaccine production
platforms
Sharon, David M.; Nesdoly, Sean; Yang, Hsin J.; Gélinas, Jean-François;
Xia, Yu; Ansorge, Sven; Kamen, Amine A.
A pooled genome‑wide screening
strategy to identify and rank
influenza host restriction factors
in cell‑based vaccine production
platforms
David M. Sharon
1, Sean nesdoly
1, Hsin J. Yang
1, Jean‑françois Gélinas
1, Yu Xia
1,
Sven Ansorge
2& Amine A. Kamen
1,2*Cell‑derived influenza vaccines provide better protection and a host of other advantages compared to the egg‑derived vaccines that currently dominate the market, but their widespread use is hampered by a lack of high yield, low cost production platforms. Identification and knockout of innate immune and metabolic restriction factors within relevant host cell lines used to grow the virus could offer a means to substantially increase vaccine yield. In this paper, we describe and validate a novel genome‑ wide pooled CRISPR/Cas9 screening strategy that incorporates a reporter virus and a FACS selection step to identify and rank restriction factors in a given vaccine production cell line. Using the HEK‑ 293SF cell line and A/PuertoRico/8/1934 H1N1 influenza as a model, we identify 64 putative influenza restriction factors to direct the creation of high yield knockout cell lines. In addition, gene ontology and protein complex enrichment analysis of this list of putative restriction factors offers broader insights into the primary host cell determinants of viral yield in cell‑based vaccine production systems. Overall, this work will advance efforts to address the public health burden posed by influenza.
Cell‑based influenza vaccine production.
Mitigating the disease burden of influenza virus is anongoing public health challenge, with 290,000–650,000 deaths annually and ten-fold as many hospitalizations worldwide1,2. The efficacy of influenza vaccines, which must be reformulated annually to adjust for antigenic
drift and changes in dominantly circulating strains, has fluctuated between 10 and 60% since 20053.
The vast majority (85–90%) of these vaccines are currently produced using embryonated chicken eggs, but a growing body of evidence suggests significant improvements in vaccine efficacy could be made by switching to cell-based manufacturing platforms4. Passaging influenza through eggs induces antigenic drift as the virus
adapts to an avian host4–6. As a result, egg-based vaccines exhibit a 15–20% decrease in protection rate compared
to similarly formulated cell-based vaccines6–8. Cell-based platforms can also drastically reduce production lead
time by accelerating seed stock reassortment via reverse genetics9. This, in turn, reduces the chance of major
changes in circulating strains occurring between initial strain selection and vaccine release, an issue that rendered the 2014–2015 seasonal vaccine largely ineffective10,11. Additionally, the manufacturing capacity of cell-based
vaccines is not constrained by the availability of billions of pathogen-free, synchronously fertilized chicken eggs, which would facilitate rapid response to influenza pandemics if they arise. Other advantages of cell-based vac-cines include a lack of allergen contamination and better growth of certain strains8.
For all the benefits of cell-based influenza vaccines, current production platforms generally exhibit 4 to 10 fold lower volumetric yield than egg-based counterparts and are 40–100% more expensive8,12. Given that influenza
vaccine demand exceeds 1.5 billion doses annually, the advantages of cell-based vaccines are irrelevant if high yield, low cost platforms for industrialization are lacking8. Past efforts to intensify cell-based vaccine production
open
1Department of Bioengineering, McGill University, McConnell Engineering Building, Room 363, 3480 Rue
University, Montreal, QC H3A 2K6, Canada. 2Human Health Therapeutics, National Research Council of Canada,
and drive down cost have largely centered on the optimization of media formulations, infection and harvest parameters, and feeding strategies. However, the advent of CRISPR/Cas9-mediated genome editing technology allows for an additional, relatively unexplored means of increasing vaccine yield: genetic engineering of the host cell line.
Screen rationale.
Cells contain restriction factors that defend against viral infection. Identification andknockout of these restriction factors in host cells could create a more permissive environment for viral replica-tion, thus increasing vaccine yield. However, the use of data from the relevant literature to identify and rank candidate restriction factors is mired by a lack of agreement between the results of independent studies on the gene-to-gene level. For instance, the results of two high-quality genome-wide studies to find influenza restriction factors by Heaton et al. (2017) and Tripathi et al. (2015) are largely consistent in terms of the functional pathways and processes identified13,14. However, the overlap between the sets of individual genes identified in the
respec-tive studies was less than would be expected by random chance (see Supplemental S1). These results reflect the importance of cell line, culture parameters, influenza strain, and other contextual factors in determining the role which individual genes will impact viral yield. This is particularly true for cell lines used to produce influenza vaccines such as MDCK, Vero, and HEK-293, which diverge heavily from primary cells and each other in terms of their innate antiviral response12,15. The question of which gene knockouts will give the greatest increase in
vaccine yield is then best probed on a case-by-case basis, using a genome-wide screen conducted on the relevant host cell line.
Wu et al. (2017) and van der Sanden et al. (2016) have attempted to use genome-wide screens to identify viral restriction factors in Vero cells and improve vaccine yield, with variable success16–18. In a retrospective analysis,
Hoeksema et al. (2018) identified several factors that may explain the difficulties encountered18, particularly the
issue of using human-specific libraries in non-human derived cell lines. Both screens also used RNAi-based methodologies to probe for restriction factors. Though this is generally more sensitive than CRISPR-based methods, and therefore desirable for basic research, difficulties can be encountered translating the results of RNAi screens into CRISPR/Cas9 knockout cell lines18. A further possible source of error is the arrayed
for-mat of previous screens. Arrayed screens, in which homogenous knockout populations are physically isolated, can require thousands of microtiter plates and hundreds of thousands of individual manipulations to achieve genome-wide coverage19. Aside from being resource intensive to conduct, the inherent difficulties in
control-ling a screen of this scale tend to result in high variability19,20. Alternatively, pooled screening formats, wherein
a mixed knockout population is contained in a single vessel, ensure identical treatment of all cells and can achieve genome-wide coverage without high-throughput robotics and other specialized facilities. However, pooled screens are limited in terms of readout, requiring some form of selection that results in enrichment/ depletion of knockout populations20. This complicates the assessment of phenotypes such as viral yield, which
do not directly impact cell survival.
In this study, we present the results of a pooled screening strategy using a reporter virus coupled with a Fluorescence Assisted Cell Sorting (FACS) based selection method to identify and rank host restriction factors for A/Puerto Rico/8/1934 H1N1 (PR/8) influenza in HEK-293SF cells.
Results
Screen design.
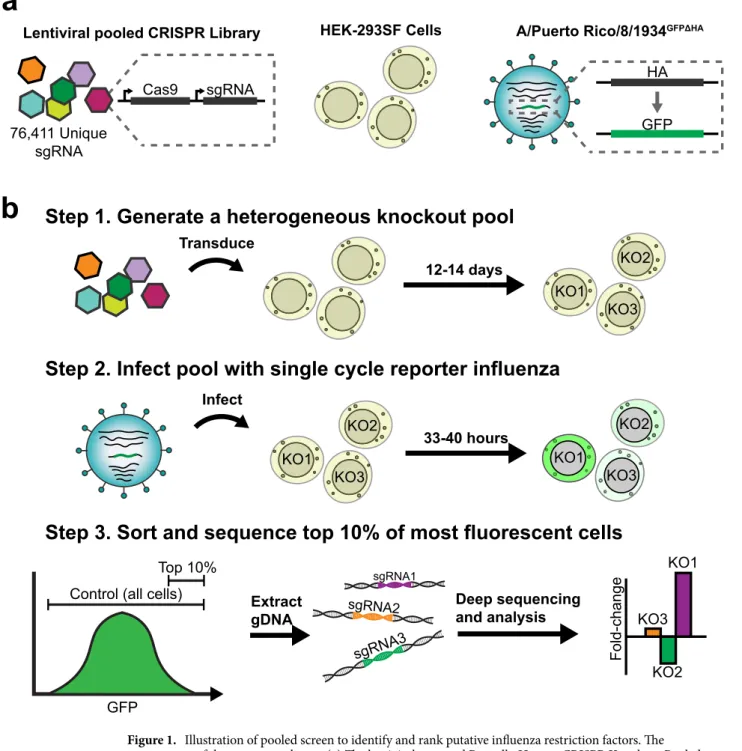
The screen components and workflow are described in Fig. 1.The Brunello Human CRISPR/Cas9 Knockout Pooled Library (Fig. 1a) consists of a pool 76,411 unique sgRNA, each with a CRISPR/Cas9 expression cassette, packaged in lentiviral vectors21. This library was selected
due to redundant (~ 4×) coverage of all protein coding genes, the inclusion of extensive (n = 1,000) non-targeting controls, and to avoid the confounding effects of using an siRNA library to direct the creation of CRISPR/Cas9 knockout cell lines21. The HEK-293SF cell line (Fig. 1a), a serum-free and suspension adapted variant of the
HEK-293 parent line, was selected due to its human origin and the availability of a well-annotated genome to ensure minimal off-target effects22,23. The HEK-293SF line is also highly attractive from a bioprocess standpoint
and, though currently less popular than the Vero or MDCK lines for influenza vaccine production, has shown considerable potential as a scalable and high yield vaccine production platform9,22,24,25.
The screen presented in Fig. 1 has been designed to enable a pooled screening format, using a single-cycle reporter virus and a FACS-based selection step. The A/Puerto Rico/8/1934GFPΔHA (PR/8 GFPΔHA) reporter virus
(Fig. 1a) can enter cells and replicate wild-type infection kinetics for one infection cycle, but it is unable to produce infectious progeny due to the lack of the HA coding sequence, a critical entry and attachment factor26.
Furthermore, as we will show in subsequent results, PR/8GFPΔHA transcribes GFP in direct proportion to wildtype
PR/8 HA transcription, and GFP expression predicts relative wildtype viral titer. Critically, this allows the indi-vidual viral yield of each cell in the knockout pool to be approximated via GFP fluorescence intensity. High yield cells in the knockout pool can then be selected via FACS. The relative abundance of various CRISPR/Cas9 cas-settes within the genomic DNA of these cells, integrated via the lentiviral vectors, can then be determined with deep sequencing to identify candidate restriction factors (Fig. 1b). The pooled screening format enables the entire knockout pool of a given replicate to be contained in a single 3L shaker flask, ensuring identical conditions for all cells during the screen. The use of a single-cycle infection virus avoids the confounding effects of secondary infection from neighboring cells.
PR/8
GFPΔHAclosely replicates PR/8 infection kinetics and effects on host cells for one infection
cycle.
The first step before conducting the screen was to investigate how closely PR/8GFPΔHA mirrors theinfec-tions kinetics of PR/8 for a single infection cycle. HEK-293SF cells were infected under condiinfec-tions identical to those used in the screen. Over the next 72 h, samples of cells were assayed for the percentage of cells infected, cell
density, and cell viability. In addition, cellular levels of mRNA for genomic segment 4 (HA/GFP) were measured over 40 h in the two cultures to determine whether the modified genomic segment 4 in PR/8GFPΔHA is transcribed
at the same rate as that of wildtype PR/8. Results are shown in Fig. 2.
HA
GFP
A/Puerto Rico/8/1934
GFPΔHACas9
sgRNA
76,411 Unique
sgRNA
Lentiviral pooled CRISPR Library
HEK-293SF Cells
Transduce
12-14 days
KO1
KO2
KO3
Step 1. Generate a heterogeneous knockout pool
Step 2. Infect pool with single cycle reporter influenza
Step 3. Sort and sequence top 10% of most fluorescent cells
Infect
KO1
KO2
KO3
33-40 hours
KO1
KO2
KO3
a
b
GFP
Top 10%
Control (all cells)
Extract
gDNA
sgRNA1 sgRNA2 sgRNA3Deep sequencing
and analysis
Fold-chang
e
KO1
KO2
KO3
Figure 1. Illustration of pooled screen to identify and rank putative influenza restriction factors. The components of the screen are shown: (a) The lentiviral-vectored Brunello Human CRISPR Knockout Pooled Library, consisting of a pool of 76,411 unique sgRNA as well as 1,000 non-targeting controls, each with a CRISPR/Cas9 expression cassette packaged in lentiviral vectors; The HEK-293SF cell line; The A/Puerto Rico/8/1934GFPΔHA (PR/8GFPΔHA) reporter virus, wherein the HA coding sequence on genomic segment 4 of the
virus has been replaced with the coding sequence of GFP. (b) The workflow of the screen is shown, including library transduction, infection with reporter influenza, and selection of a “high yield” knockout population via FACS. The high yield fraction is composed of the top 10% of all GFP expressing cells. A control population, composed of all GFP-expressing cells, is also collected. Deep sequencing is then used to determine the abundance of integrated sgRNA expression cassettes in the genomic DNA (gDNA) of the two fractions. Fold-change enrichment of sgRNA species in the high yield fraction relative to the control is then used to identify and rank putative restriction factors.
Both PR/8GFPΔHA and PR/8 infected cultures showed identical effects on host cells, inducing immediate cell
cycle arrest and declining viability 40 h post-infection (hpi) compared to mock infected controls (Fig. 2a). In terms of infection kinetics, PR/8GFPΔHA cultures showed a 1–2 h delay in viral entry and expression of the
influ-enza nucleoprotein (NP) as assessed by staining and flow cytometry (Fig. 2b). However, within 4 h, virtually all cells in both cultures were infected (Fig. 2b), indicating that PR/8GFPΔHA has no significant defects in
attach-ment and entry compared to wildtype. See Suppleattach-mentary S2 for flow cytometry gating. There was also a strong linear correlation (R2 = 0.83) between the absolute levels of cellular GFP mRNA and HA mRNA expressed over
the course of 40 h in PR/8GFPΔHA and PR/8 cultures (Fig. 2c) showing that the modified genomic segment 4 of
PR/8GFPΔHA is transcribed at a similar rate as that of PR/8 segment 4 and is an accurate predictor of PR/8
tran-scription levels. Overall, PR/8GFPΔHA closely replicates PR/8 infection kinetics and effect on host cells under the
conditions tested. Finally, we also sought to verify the “single cycle” nature of PR/8GFPΔHA infection. As expected,
PR/8GFPΔHA cultures 72hpi contain negligible concentrations of infectious viral particles compared to wildtype
PR/8 (Fig. 2d).
PR/8
GFPΔHAGFP reporter intensity predicts PR/8 viral yield.
Though the results of Fig. 2c show thatGFP reporter transcription in PR/8GFPΔHA infected cells correlates well with wildtype PR/8 transcription, we
wanted to assess whether GFP reporter expression was also indicative of viral yield using a positive control wherein a known restriction factor is knocked-out. Results are shown in Fig. 3.
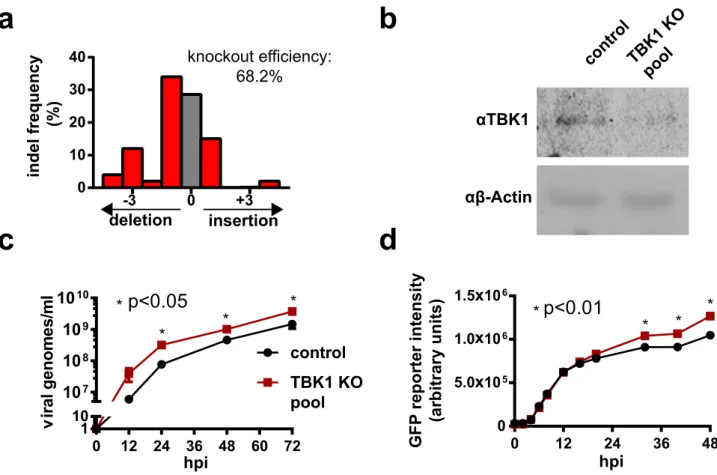
Tank binding kinase 1 (TBK1) is a serine-threonine kinase and a key component of the retinoic acid-inducible gene I (RIG-I) dsRNA sensing pathway27. Disruption of TBK1 expression has been shown to increase PR/8
titer in HEK-29327,28. In order to examine whether GFP expression in PR/8GFPΔHA infected cells could predict
increases in wildtype viral yield, CRISPR/Cas9 was used to knock out TBK1 in HEK-293SF cells, generating a HEK-293SFΔTBK1 knockout pool. Tracking of Indels by Decomposition (TIDE) analysis (Fig. 3a) and Western
blot (Fig. 3b) show successful modification at the target DNA loci and a reduction in TBK1 protein levels in the HEK-293SFΔTBK1 pool, respectively. Wildtype PR/8 yield was then assessed in these cells. As shown in Fig. 3c,
cells from the HEK-293SFΔTBK1 knockout pool showed a significant increase in viral yield compared to controls.
Both unmodified cells and those from the HEK-293SFΔTBK1 knockout pool were then infected with PR/8GFPΔHA,
PR/8
PR/8
GFP HAmock infected
ΔPR/8 HA mRNA
[log (copies/cell)]
PR
/8
GF PH AGF
Pm
RN
A
0 1 2 3 4 5 0 2 4 6R
2=0.83
Δinfective particles/ml
72 hpi
a
b
c
d
[log (c
op
ie
s/
ce
ll)]
p=9.3x10
-6hpi
viable
cells
(%
)
cel
ld
en
sit
y(
10
6/ml
)
0 12 24 36 48 60 72 0 50 100 0 2 4 6 8hpi
cell
si
nfected
(%
)
0 6 12 18 24 0 50 100 PR/8 PR/8 GFP HA 101 103 105 107 109 ΔFigure 2. Comparison of PR/8 and PR/8GFPΔHA infection kinetics and effect on cell viability and growth. (a)
Effect of PR/8 and PR/8GFPΔHA on cell viability and growth compared to mock-infected controls. (b) Infection
kinetics of PR/8 and PR/8GFPΔHA, infected cells are defined as those expressing the influenza nucleoprotein,
as measured by flow cytometry. (c) Correlation between expression of PR/8 HA mRNA and PR/8GFPΔHA GFP
mRNA over the course of a 40 h infection. Cellular mRNA content was measured by strand-specific dPCR. (d) Comparison of infective viral particle titer in cell-free supernatant (CFS) of PR/8 and PR/8GFPΔHA infected
cultures 72 h hpi. In all experiments, datapoints represent the average of n = 3 independent replicates run in parallel. Error bars represent standard error of the mean (SEM). Whisker plots show mean, range, and individual data points. R2 value was determined by linear regression, and p value was determined using 2-tailed
and the mean GFP fluorescence intensity of infected cells was measured over 48 h via flow cytometry. The flow cytometry gating strategy is depicted in Supplemental Figure S2. As shown in Fig. 3d, the mean GFP intensity of the HEK-293SFΔTBK1 knockout pool was significantly elevated relative to control cells. This demonstrates that
high yield knockout populations can be identified by GFP intensity from PR/8GFPΔHA reporter virus infection,
validating its use in the screen.
Screen controls and quality metrics performed as expected.
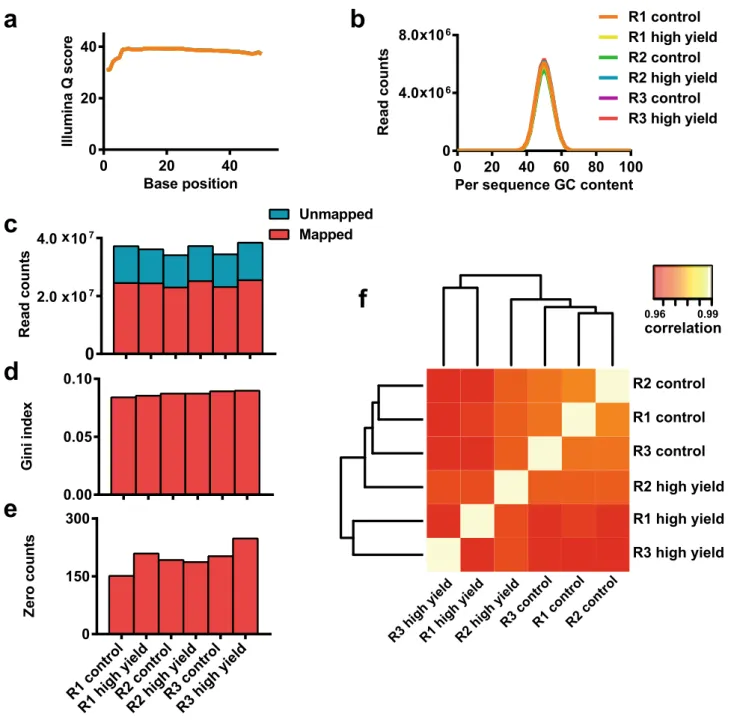
Three independent replicates of thescreen depicted in Fig. 1 were run, each generating a control (all infected cells) and high yield fraction (cells in the 90th percentile of GFP expression), totaling six samples. FACS gating strategy for sample collection is shown in Supplemental Figure S2. Figure 4 shows assessment of screen replicates in terms of deep sequencing base call-ing quality, read mappcall-ing, and the distribution of these reads within the library.
For all samples, average per base Illumina Q score, an aggregate measure of base calling quality, was > 30 for the entirety of the 50 bp read (Fig. 4a), indicating good base calling during sequencing. GC content per read was consistent between samples and indistinguishable from the theoretical distribution for the library (Fig. 4b), indicating that there was no significant bias in the PCR used to generate the amplicon libraries or in the deep sequencing itself. For all samples, > 65% of reads were mapped to the library (Fig. 4c), further indicating satis-factory sequencing quality. The library was also well represented in terms of both average read depth (~ 300 per sgRNA) (Fig. 4c), and a Gini index, a measure of read distribution across the library, below 0.1 for all samples. Zero count sgRNAs, elements in the library for which no read was mapped, comprise < 1% of total library ele-ments (n = 76,411) for all samples (Fig. 4e). Figure 4f shows correlation and clustering between samples. As
control TBK1 KO
pool
a
b
c
hpi
vi
ra
lg
enom
es
/m
l
0 12 24 36 48 60 72
1
10
10
710
810
910
10control
TBK1 KO
pool
p<0.05
hpi
GF
Pr
ep
or
te
ri
ntensity
(arb
itrary
uni
ts
)
0
12
24
36
48
0
5.0 10
51.0 10
61.5 10
6p<0.01
x
x
x
*
*
*
*
*
*
*
*
αTBK1
αβ-Actin
0
10
20
30
40
indel frequency
(%)
insertion
deletion
-3
0
+3
knockout efficiency:
68.2%
d
Figure 3. Validation of PR/8GFPΔHA GFP intensity as a reporter for increased viral titer using a HEK-293SFΔTBK1
knockout pool. (a) TIDE analysis of gDNA extracted from the HEK-293SFΔTBK1 knockout pool at the sgRNA
cut site. Frameshift from control sequence indicates successful indel at the gRNA target site and disruption of the TBK1 gene. Indel frequency is estimated at 68%. (b) Western blot for TBK1 against extracts from the HEK-293SFΔTBK1 knockout pool and control cells showing a reduction in TBK1 protein levels in the knockout pool.
(c) Timecourse measurement of wildtype PR/8 viral titers in terms of genomes/mL in HEK-293SFΔTBK1 and
control HEK-293SF CFS. Cells were infected at an MOI of 0.1. Results show significantly elevated viral titers generated by the HEK-293SFΔTBK1 knockout pool. (d) Timecourse measurement of GFP reporter intensity in
HEK-293SFΔTBK1 and control HEK-293SF cells infected with PR/8GFPΔHA. Results show significantly elevated
GFP reporter intensity in HEK-293SFΔTBK1 cells. TIDE analysis was conducted using the TIDE webtool.
Datapoints of figures (c) and (d) represent the average of n = 3 independent replicates run in parallel. Error bars represent SEM. All p values were determined using using 2-tailed Student’s t test. Uncropped Western blot is shown in Supplemental S3.
expected, the strongest correlations are seen between the three control samples and between the three high yield fractions, respectively.
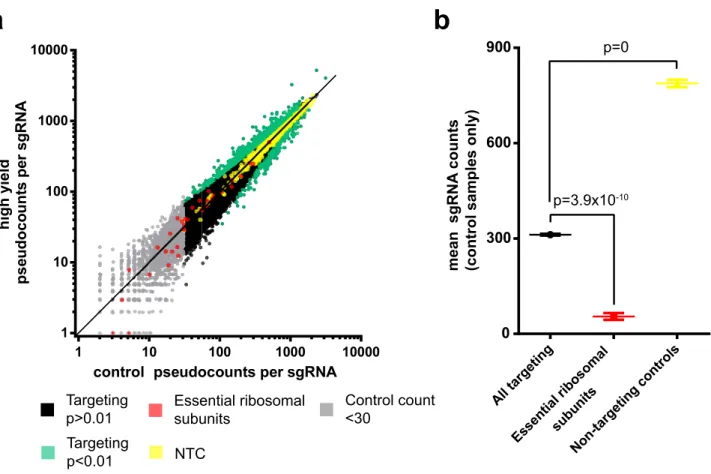
The library contains an average of four distinct sgRNA targeting towards each protein coding gene. Figure 5a shows the median abundance and enrichment of sgRNA reads for the three replicates.
A total of n = 754 sgRNA were significantly enriched or depleted with a threshold of p < 0.01 in high yield fractions. As shown in Fig. 5b, the mean count of all sgRNA targeting essential ribosomal subunits (as identified by Hart et al. (2014)) is significantly lower (p = 3.9 × 10⁻¹⁰) than the mean of all other targeting sgRNA in control
samples29. The depletion of this subpopulation in which essential cell survival factors have been targeted for
knockout indicates efficient CRISPR/Cas9 activity in the screen. Non-targeting controls were found to be sig-nificantly elevated compared to targeting sgRNA, which is an expected result considering we observe a 24–48 h
Base position Illum in aQ scor e 0 20 40 0 20 40 R1 control R1 high yield R2 control R2 high yield R3 control R3 high yield Per sequence GC content
Read co un ts 0 20 40 60 80 100 0 4.0 106 8.0 10x 6 x R1 high yiel d R2 high yiel d
R3 controlR1 controlR2 control
R3 high yield R3 control R1 control R2 control 0.96 0.99 correlation R3 high yiel d R2 high yield R1 high yield
a
b
Gini in de x 0.00 0.05 0.10 Ze ro co unts 0 150 300 Re ad co unt s0
2.0 107 4.0 107 Mapped Unmapped x xc
d
e
f
R1 high yiel d R2 high yiel d R3 contro l R1 contro l R2 contro l R3 high yiel dFigure 4. Deep sequencing and read mapping quality metrics. Six samples, consisting of high yield and control fraction for each of the three replicates (abbreviated R1, R2, and R3), were sequenced together as a barcoded pool. (a) Average per base Illumina Q score, an aggregate measure of base-calling quality, for each sample. (b) Distribution of average GC content per read for each sample. (c) Illustration of total reads per sample and reads that were successfully mapped to the library. (d) Gini index for each sample, a measure of read distribution across the library. (e) Number of zero counts, elements in the library for which no read was mapped, for each sample. (f) Heat map showing sample grouping and correlations between samples. Data was generated using the MAGeCK software suite.
growth arrest in HEK-293SF following CRISPR/Cas9 knockout. We speculate this is due to cells resolving the DNA damage that mediates CRISPR/Cas9 activity, as has been reported elsewhere30. See Supplemental File S4
for sgRNA count data.
Identification and analysis of putative influenza restriction factors in HEK‑293SF.
A totalof n = 135 significantly enriched gene knockouts were identified by Robust Rank Aggregation (RRA) analy-sis using the MAGeCKFlute software suite and a significance threshold of p < 0.0131. See methods section for
analysis parameters. An arbitrary threshold for minimal biological significance of log2 fold-change (lfc) > 0.4 was
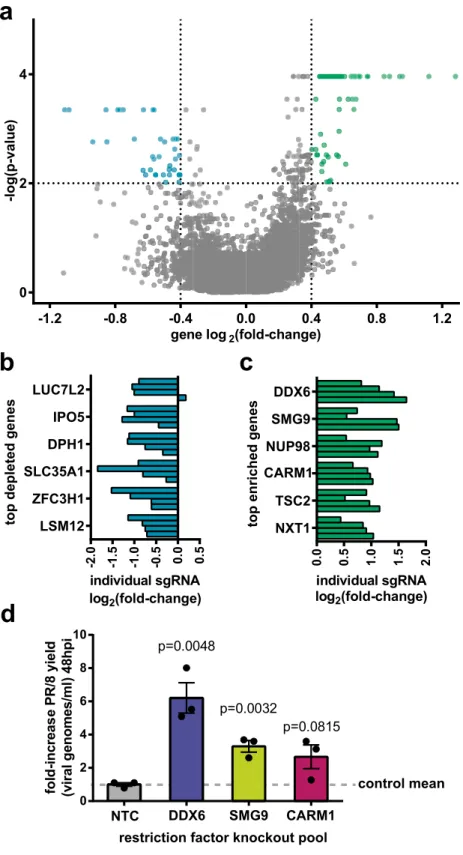
also imposed to refine the results. Overall, n = 64 gene knockouts were identified with these criteria, hereafter referred to as putative restriction factors (Fig. 6a). Although not a goal of this study, we also identified a subset of genes that were significantly depleted that may be of interest, particularly to those looking to identify host targets of antiviral drugs (Fig. 6b). However, we caution that the screen lacks adequate controls to distinguish whether these depleted factors exert a specific effect on influenza replication, or merely that their knockout is detrimental to the cell’s overall biosynthetic capacity. Top putative restriction factors in the screen are shown in Fig. 6c. The full output of the MAGeCKFlute analysis, including a list of all genes and their associated RRA score, lfc, and
p value, is available in Supplementary data file S4. In addition, because this screen used an indirect readout (GFP
florescence) to assess viral titer’ it was important to validate a portion of the putative restriction factors identi-fied by direct measurement of wildtype PR/8 titers to verify the integrity of the dataset. For each of the genes DDX6, SMG9, and CARM1, a knockout pool was generated using a randomly selected sgRNA sequence from the Brunello Library. Editing efficiency was estimated by TIDE analysis as > 80% for all pools (see Supplemental S5). Cells were then infected with PR/8, and fold-change in influenza yield measured compared to cells trans-duced with a non-targeting control sgRNA (Fig. 6d). Results show an increase of viral titer of three–sixfold over non-targeting controls, verifying the results of the screen.
Alltar getin g Esse ntial ribos omal subu nits Non-t argeti ngco ntrols
0
300
600
900
p=0
p=3.9x10
-10Essential ribosomal
subunits
NTC
Control count
<30
Targeting
p>0.01
Targeting
p<0.01
a
b
mean sgRN
A
counts
(control samples only)
control pseudocounts per sgRNA
1 10 100 1000 10000 1 10 100 1000 10000
high yiel
d
ps
eu
doco
un
ts
pe
r sg
RN
A
Figure 5. sgRNA abundance, enrichment, and controls. (a) Log–Log plot of abundance for each individual sgRNA in high yield and control samples. Values represent the median of three replicates. A pseudocount of + 1 was added to all sgRNA to allow plotting of zero count sgRNA. Elevation above or below the line x = y indicates enrichment or depletion of that sgRNA, respectively. Significantly enriched or depleted sgRNA (n = 754), non-targeting control (NTC) sgRNA (n = 1,000), and controls in the form of sgRNA that target essential ribosomal subunits (n = 34) are highlighted. sgRNA with a median read count in control samples of < 30 (n = 1,760) are displayed but were excluded from downstream analysis due to insufficient representation. (b) Mean abundance in control samples of all targeting sgRNA, sgRNA targeting essential ribosomal subunits, and NTC sgRNA. Significant enrichment/depletion of individual sgRNAs was determined using the MAGeCK software suite. Note that p values have been adjusted for multiple testing using the Benjamini–Hochberg procedure. Significance values in plot (b) were determined using 2-tailed Student’s t test. Whisker plots represent mean and SEM.
gene log2(fold-change) -log(p-value ) -1.2 -0.8 -0.4 0.0 0.4 0.8 1.2 0 2 4 individual sgRNA log2(fold-change) 0. 0 0. 5 1. 0 1. 5 2. 0 NXT1 TSC2 NUP98 SMG9 DDX6 log2(fold-change)
top depleted gene
s -2 .0 -1 .5 -1 .0 -0 .5 0.0 0.5 LSM12 ZFC3H1 SLC35A1 DPH1 IPO5 LUC7L2
a
b
c
d
fo ld -increas eP R/ 8y ie ld (v iral ge nomes/ml )4 8hpi 0 2 4 6 8 10 p=0.0048 p=0.0032 p=0.0815 control mean CARM1 SMG9 DDX6 NTCrestriction factor knockout pool individual sgRNA
top enriched gene
s
CARM1
Figure 6. Summary of significantly enriched and depleted genes and hit validation. (a) Volcano plot showing the mean
log2 fold enrichment (lfc) and p value for each gene knockout. Gene “hits” are defined as having p < 0.01 and |lfc|> 0.4. Using these criteria, n = 64 putative restriction factors were identified, as well as n = 37 significantly depleted genes. (b) Individual sgRNA lfc for the six most depleted genes in the screen, i.e. knockouts which were detrimental to influenza replications. (c) Enrichment of individual sgRNA corresponding to the top six putative restriction factors identified in the screen. (d) Validation of top putative restriction factors DDX6, SMG9, and CARM1 using wildtype PR/8 virus at an MOI of 0.1. Results indicate a 3 to 6–fold increase in viral titer at 48hpi following restriction factor knockout. Significance values in plot (d) were determined using 2-tailed Student’s t test, with n = 3 independent replicates run in parallel. Error bars represent SEM. Values in panels (a–c) were obtained by Robust Rank Aggregation (RRA) analysis with the MAGeCKFlute software suite and plotted in Prism. Note that p values have been adjusted for multiple testing using the Benjamini–Hochberg procedure. See methods section for analysis parameters.
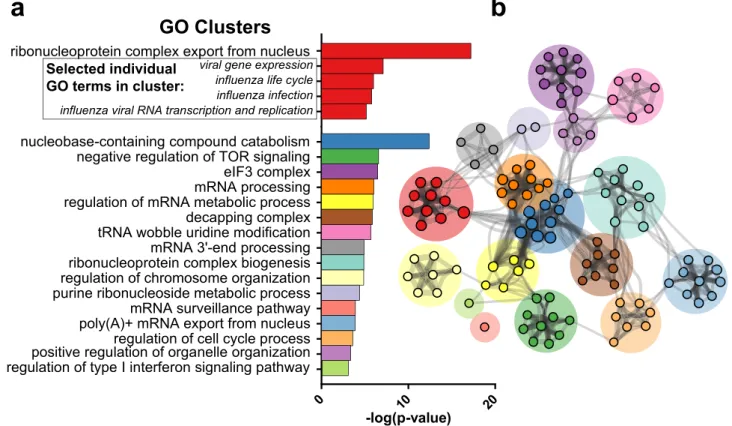
In order to identify common biological pathways, processes, and protein–protein interactions (PPI) within our list of putative restriction factors, a Gene Ontology (GO) analysis was conducted using Metascape (Fig. 7)32.
A total of n = 274 individual GO terms were significantly enriched with a significance threshold of p < 0.01. As expected, we see highly significant enrichment of terms related to influenza (Fig. 7a) including Transport of Virus (p = 2.0 × 10⁻⁵), Influenza Life Cycle (p = 5.8 × 10⁻⁴), and Influenza Infection (p = 7.7 × 10⁻⁴). While
enrich-ment of influenza-related terms serves as a supporting additional validation of the screen results, the majority of the putative restriction factors identified are not associated with these ontology terms, suggesting analysis of other highly enriched GO terms may provide insight into novel antiviral pathways in the cell. Highly significant GO clusters, groups of related GO terms, are shown in Fig. 7a. Figure 7b provides a graphical representation of the interactions between subclusters. See Supplementary data file S6 for the full list of significantly enriched GO terms.
In addition to the GO analysis, we also conducted an analysis for the enrichment of stable protein complexes using COMPLEAT33. If an individual restriction factor exerts its antiviral effect as part of a multiprotein complex,
it follows that the knockout of any protein in that complex which is required for complex functionality should exert a similar antiviral effect. We would thus expect to see that some of the top ranked genes in the screen are part of the same protein heterocomplexes. This analysis is useful both as an indirect validation of the screen, and to guide subsequent efforts to create high yield knockout cell lines based on the screen results, as the knockout of multiple restriction factors that exert their effect through a common protein complex would be redundant. Results are summarized in Fig. 8.
As shown in Fig. 8a, n = 84 protein complexes (either described in literature or predicted through proteomics studies) were found to be significantly enriched with a threshold of p < 0.01. The highest scoring complexes as determined by the COMPLEAT algorithm are depicted as well in Fig. 8b. See Supplementary data file S7 for the full list of significantly enriched complexes.
Discussion
In this work, we present a pooled screening strategy to identify and rank host restriction factors in vaccine-producing cell lines. In contrast to previous arrayed screens to identify host restriction factors in cell-based vaccine production systems, the use of a replication defective reporter virus and a pooled screen format allows
-log(p-value)
0 regulation of type I interferon signaling pathway
10 20 positive regulation of organelle organizationregulation of cell cycle process
poly(A)+ mRNA export from nucleusmRNA surveillance pathway purine ribonucleoside metabolic processregulation of chromosome organization ribonucleoprotein complex biogenesismRNA 3'-end processing tRNA wobble uridine modificationdecapping complex regulation of mRNA metabolic processmRNA processing eIF3 complex negative regulation of TOR signaling nucleobase-containing compound catabolism influenza viral RNA transcription and replicationinfluenza infection
influenza life cycle viral gene expression ribonucleoprotein complex export from nucleus
GO Clusters
Selected individualGO terms in cluster:
a
b
Figure 7. Gene ontology (GO) analysis of putative restriction factors. (a) Significantly enriched GO clusters obtained from the 64 putative restriction factors in the screen. In total, n = 274 individual GO terms were found to be enriched with a threshold of p < 0.01. Associated GO terms were clustered, with the name of that cluster represented by the individual GO term with the lowest p value. Within the first cluster, selected individual GO terms related to influenza have also been displayed. (b) Graphical representation of the association between GO clusters. Nodes represent subclusters, with node size corresponding to the number of genes in that node. Edges represent association between subclusters in terms of biological processes, pathways, or PPI. GO analysis was conducted using the Metascape webtool and plotted in Cytoscape.
genome-wide coverage without high-throughput robotics. The coculture of all cells in a given replicate also removes much of the inherent variability seen in large-scale arrayed screens20.
Using HEK-293SF cells and PR/8 influenza as a model, we identified 64 putative restriction factors that met the threshold for biological (lfc > 0.4) and statistical (p < 0.01) significance. The antiviral function of many of these restriction factors is implied from the fact that they are direct or indirect targets of influenza during infec-tion; nuclear pore components like RAE1 and NUPL2, are downregulated by influenza during infection, which has been shown to benefit influenza replication34. Similarly, TSC1 and TSC2 negatively regulate the mTORC1
complex, which influenza has been shown to activate during late-stage replication to maximize viral protein production35,36. Other factors identified have known antiviral activity against influenza or similar viruses; DDX6
and DPC2 are components of the decapping complex, which has been shown to inhibit the expression of Bunya-virus mRNA by competing with the viral “cap snatching” pathway (similar to that utilized by influenza) for the 5′ cap of host mRNA37. SMG9 and UPF2 are a components of the nonsense mediated RNA decay (NMD) pathway,
-1.2
0
1.2
gene log(fold-enrichment)
Protein complex enrichment score
(arbitary units)
0.0
0.2
0.4
0.6
0.8
0
2
4
6
-log (p-value
)
p<0.01
a
b
TSC2
TSC1
NEFL
TSC1-TSC2 complex
p=1.59x10
-3NUP155
GLE1
NUPL2
GLE1-NUPL2-NUP155
complex
p=7.41x10
-4EDC3
DCP2
DDX6
DCP1A
EDC4
Decapping complex
p=4.32x10
-4UBC
RAE1
NXF1
NUP98
NUP62
Predicted RNA transport
complex
p=5.30x10
-5RAN
NXF1
TNPO2
TNPO2-RAN-NXF1
complex
p=4.32x10
-4Figure 8. Protein complex enrichment analysis. (a) Significance and enrichment score (based on the COMPLEAT aggregate scoring system that factors in complex size, gene lfc, and other factors) of individual protein complexes. n = 84 protein complexes were found to be significantly enriched at a threshold of p < 0.01. (b) The top five enriched protein complexes identified, showing the individual genes corresponding to a given protein and lfc of that gene in the screen, as well as the interactions between proteins in the complex. Both
a common feature of viral transcripts, including those of influenza. Accordingly, NMD has been shown to exert antiviral effects on several RNA viruses39.
While antiviral function of many putative restriction factors identified in the screen is apparent, n = 41 of the factors identified have no association with a GO viral or antiviral process (see Supplemental S6). The results of this study therefore serve not only to guide the development of high yield knockout cell lines for influenza vaccine production, but also as a basis for studies into novel host antiviral pathways.
Interestingly, though by no means absent from the results, key mediators of canonical antiviral pathways, such as interferon and RIG-I, had a relatively minor impact on viral yield in this study. One explanation for this is that many vaccine production cell lines such as HEK-293, Vero, and MDCK show impaired antiviral signaling compared to primary cells, hence their inherent utility for virus production12,15,40. Another aspect to consider
is that in vivo a major function of these pathways is to upregulate antigen presentation and recruit specialized immune cells, which is obviously not possible within in vitro cell culture systems41,42. Far more represented in the
results are metabolic factors, particularly negative regulators of nucleic acid anabolism and translation (Fig. 7a). Even the highly represented non-canonical “antiviral” pathways identified, such as the decapping pathway, are activated not just in response to viral infection, but nutrient starvation as well. Together these results imply that in cell-based vaccine production systems, influenza yield is primarily determined by host cell metabolic state, rather than innate antiviral immunity, though there is significant overlap between these pathways.
The screening strategy presented here can in theory be applied to any cell-based vaccine production system. Even within the space of a single virus-host system, the FACS collection parameters can be adjusted depending on the end-use of the data. In this screen, for instance, we used a 1.5 drop yield mode and a high event rate dur-ing FACS acquisition, allowdur-ing a significant amount (~ 20%) of cells not in the 90th percentile of GFP expressdur-ing cells to contaminate the high yield fraction. In doing so, we sacrificed readout signal dynamic range to collect large numbers of cells and maintain library representation. This allowed us to generate a large list of hits for rich downstream bioinformatics analysis, while potentially compromising our ability to accurately rank those hits. Alternatively, if one was solely concerned with accurately ranking a smaller list of highly significant restriction factors for knockout cell line development, FACS acquisition could be run under more stringent conditions and with a lower fraction of cells collected (e.g. the 99th percentile of GFP expression). It should be noted though that even with the low dynamic range of the screen (± lfc1.2) the ranking of putative restriction factors was remarkably consistent between replicates; DDX6, for instance, was the top ranked gene in every replicate, and correlation between replicate samples was nearly 99%.
While the screen presented here is a useful tool for identifying and ranking viral restriction factors, it does have limitations; only restriction factors with an impact on viral protein expression can be identified, while those impacting viral packaging and egress are not. Furthermore, while this distinction is irrelevant for the purposes of increasing vaccine yield, there is no way to differentiate knockouts that induce a generic upregulation of transla-tion from restrictransla-tion factors that specifically inhibit viral replicatransla-tion, though this could be easily remedied with a stably expressed passive fluorescent reporter in host cells. There is also the possibility of false positive hits if a knockout somehow increases viral protein expression, but is detrimental to overall viral titer, as the results of Karlas et al. (2010) show is likely the case with NUP9843.
Overall the results show that the screening strategy we have demonstrated here is an effective and flexible tool to identify host restriction factors in cell-based influenza production systems. Future studies by our group will aim to exploit the results of this screen to generate high yield HEK-293SF knockout cell lines for influenza vaccine production, as well as elucidate host-virus interactions mediated by novel restriction factors identified in the screen.
Methods
Cell culture and maintenance.
HEK-293SF cells (RRID accession: CVCL_4V94) were obtained from theNational Research Council of Canada22. In all cases, cells were maintained in serum-free suspension at a density
of 0.5–4.0 × 10⁶ in Hyclone Hycell TransFX-H media (GE Healthcare) supplemented with 4 mM Glutamine
and 0.1% Pluronic F68 (Sigma-Aldrich). Cells were incubated in vented PETG shake flasks (Corning), spun at 110 rpm in a 37 °C incubator in a humidified 5% CO2 atmosphere. Cell counts and viability were determined by
trypan blue exclusion assay using a Vi-CELL XR Cell Viability Analyzer (Beckman Coulter).
Digital pcR (dpcR).
All dPCR assays were carried out on the QX200™ Droplet Digital™ PCR System(Bio-Rad) using the QX200 EvaGreen Digital PCR Supermix (Bio-(Bio-Rad) according to the manufacturer’s instructions. Primers and thermocycling conditions for all dPCR assays are listed in Supplemental S8.
Lentiviral vectors.
Lentiviral vectors were produced in the HEK-293SF cell line as described previously44.The psPAX2 (Addgene #12260) and CMV-VSVG (Addgene #8454) plasmids were gifts from Didier Trono and Bob Weinberg, respectively45.
HEK-293SF cells were transduced with the lentiviral vectors by spinfection at 1,000 rcf for 45 min in media supplemented with 8 µg/mL of polybrene. Cells were then immediately resuspended in normal growth media to eliminate polybrene.
In all cases, infectious titer of lentiviral vectors was determined by dPCR assay, using a protocol adapted from Baczak et al. (2015)46. Briefly, HEK-293SF were transduced with serial tenfold dilutions of lentivirus. After 48 h,
genomic DNA was extracted from cells using the Purelink Genomic DNA mini kit (Thermo Fisher) according to the manufacturer’s instructions. dPCR targeting the Woodchuck Hepatitis Virus Posttranscriptional Regulatory Element (WPRE) sequence of the vector genome was then used to determine the number of integrated vector
genomes/cell. A parallel dPCR assay targeting the albumin gene was used as a normalization control. See Sup-plemental File S8 for primers and thermocycling conditions.
A/Puerto Rico/8/1934 influenza.
PR/8 influenza (NCBI txid:211,044) stocks were generated by reversegenetics in HEK-293SF cells. The process was described previously in Milián et al. (2017)9. The reverse
genet-ics constructs used were a generous gift from Xuguang Li’s group at Health Canada, and their construction was described previously in Neumann et al. (2005)47.
To determine infectious particle titer, tenfold dilutions of virus were used to infect HEK-293SF cells. After a 3-h incubation, cells were stained for influenza NP expression and the percent of cells expressing influenza NP quantified by flow cytometry. See Sect. Flow cytometry and FACS for details on staining and flow cytometry. Only cultures showing between 2 and 20% of cells infected were used for quantification to minimize error due to superinfection.
Viral genomes were quantified by extracting RNA from cell-free supernatants using the QIAamp Viral RNA Mini Kit (Qiagen) according to the manufacturer’s instructions. RNA was then reverse transcribed with the iScript Select Reverse Transcription Kit (Bio-Rad) according to the manufacturer’s instructions and using gene specific primers targeted to influenza genomic segment 7(M). dPCR assay using the same primers was then used to determine viral genome copy number. See Supplemental File S8 for primers and thermocycling conditions.
All PR/8 infections were carried out at an MOI of 0.1 at a cell density of 106 cells/ml. PR/8 cultures were
supplemented with 1 µg/mL of 6-(1-tosylamido-2-phenyl) ethyl chloromethyl ketone (TPCK) trypsin (Sigma-Aldrich) to allow proteolytic activation of HA.
PR/8
GFPΔHAreporter influenza.
The PR/8GFPΔHA virus was a generous gift from Alain Townsend (OxfordUniversity). The cloning and production of this virus was previously described in Powell et al. (2012)48. Briefly,
the coding sequence of the HA gene is removed and replaced with that of GFP. The virus is then propagated in an HA-expressing MDCK line. All PR/8GFPΔHA infections were carried out at a multiplicity of infection (MOI) of 5.
Knockout pool generation.
To generate the HEK-293SFΔTBK1 knockout pool, an sgRNA was designedusing CHOPCHOP (v.2)49 to target the first exon of the TBK1 gene (NCBI accession:NG_046906.1). sgRNA
for the HEK-293SFΔDDX6, HEK-293SFΔSMG9, and HEK-293SFΔCARM1 knockout pools were randomly selected
from corresponding Brunello library guides for that gene21. This sgRNA was then cloned into LentiCRISPR.
V2 (Addgene #52961) using standard techniques and verified by Sanger sequencing. LentiCRISPR.V2 was a gift from Feng Zhang50. Lentiviral vectors produced using this construct were used to infect HEK-293SF at an MOI
of 10. Following selection with 2 µg/mL Puromycin for 48 h, CRISPR editing efficiency was assessed using the TIDE webtool (v2.0.1)51. Primers used to generate PCR amplicons for this analysis are listed in Supplemental S8.
Cells were then incubated for a further 10 days to allow knockout phenotypes to manifest and recover the drop in cell viability arising from DNA cleavage. TBK1 knockout was further verified by Western blot using mouse αTBK1 (Santa Cruz, sc9085) at a 1/200 dilution. αβ-Actin (Sigma A1978) at a 1/1,000 dilution was used as a loading control.
Brunello library knockout pool generation.
The Human Brunello CRISPR knockout pooled librarywas a gift from David Root and John Doench (Addgene #73178)21. Lentiviral preparations obtained from
Addgene were used to transduce cells at an MOI of 2, incubated for 48 h, and then selected with 2 µg/mL Puro-mycin for 48 h. Cells were then incubated for a further 10 days to allow knockout phenotypes to manifest and recover the drop in cell viability arising from DNA cleavage. Aliquots of cells were then frozen in 10% DMSO. Cells were thawed and subcultured for 48 h before use in the screen. At all points, a minimum representation of 300 copies/sgRNA was maintained.
flow cytometry and fAcS.
For each of the three screen replicates, cells were sorted live, and sortingwas carried out on the FACSJazz (BD Biosciences) instrument using 1.5 drop yield mode and an event rate of 7,000–9,000 events/second. Cells were sorted 33–40 hpi with PR/8GFPΔHA, a window in which GFP
expres-sion was stable, but cell viability was still high (Figs. 2, 3). Two fractions of cells were collected: the top 10% of GFP expressing cells (“high yield”), and a control fraction consisting of all infected cells (i.e. GFP positive). For both fractions, the number of cells collected is such that a minimum representation of 300 copies/sgRNA was maintained. Flow cytometry was carried out on the Accuri C6 (BD Biosciences) instrument. GFP-expressing samples were run live. In cases where influenza NP protein expression was assessed, cells were fixed and per-meabilized with the BD Transcription Factor Buffer Set (BD Pharmingen). Infected cells were then identified by staining with a 1:50 dilution of mouse αNP-FITC (Thermo Fisher, clone D67J) for 50 min. In cases where GFP expression interfered with the use of the conjugated FITC fluorophore, goat αmouse-PE-Cy5.5 (Thermo Fisher, cat#M32218) was used as a secondary antibody, and any GFP/FITC fluorescence compensated for. In all cases, data analysis was conducted using FlowJo (v.10).
Deep sequencing sample preparation and sequencing.
gDNA was extracted from cells using theJetQuick Blood and Cell Culture DNA Midiprep Kit (Thermo Fisher). PCR was then used to amplify the sgRNA inserts and append Illumina adaptors and hexamer barcodes to the amplicons. See Supplemental S8 for primer sequences and thermocycling. PCR was performed using the Q5 Hot Start High-Fidelity 2X Master Mix (New England Biolabs). Before creating the amplicon library, dPCR was used to assay the copy number of sgRNA inserts in extracted genomic DNA. Sufficient genomic DNA template was used to ensure a minimum read depth
fied on a 2% agarose gel before sequencing. Gel extraction was carried out with the PureLink Gel Extraction kit (Thermo Fisher). The purified, barcoded amplicon libraries were then pooled and sequenced as single-read 50 bp reads on the Illumina HiSeq 4,000 (Illumina).
Bioinformatics.
Data to assess sequencing quality and read mapping, as well as quantification of thechanges in sgRNA abundance between the high yield and control cell populations was carried out using the MAGeCK software suite (v.0.5.9.2)31,52,53. In this analysis, read counts were normalized using a set of 1,000
nontargeting control sgRNA’s that were provided in the Brunello library. The initial set of 1,000 was reduced to 963 after the removal of outliers whose difference in normalized read counts between conditions were outside of the range [Q1 − 1.5 * IQR, Q3 + 1.5 * IQR], where Q1, Q3, and IQR are the first quartile, third quartile, and interquartile range, respectively. To test for significance of sgRNA abundance between conditions, the MAGeCK “tool” test was used with additional parameters –remove-zero and –remove-zero-threshold set to "control" and "30 ", respectively. This removed 1,760 sgRNA’s that have an average read count in the control condition that is less than 30. All other parameters were left at the default setting. Of note, sgRNA-level p values were adjusted using the Benjamini–Hochberg procedure, which controls the False Discovery Rate at level α = 0.25. To obtain gene-level p values from multiple sgRNA’s targeting a single gene, version 0.5.9 of the modified Robust Rank Aggregation (RRA) algorithm, named α-RRA, was used54.
GO analysis was carried out using the Metascape webtool (v.3.5), and plotted using default parameters32.
Plots were created using Cytoscape (v.3.7.2)55. Protein complex enrichment analysis was carried out using the
COMPLEAT webtool (v.1.0)33. Genes were submitted as a single list using lfc as a ranking metric.
Statistical analysis.
Where stated, the coefficient of correlation and statistically significant differencesbetween two groups of means were determined by Student’s t test using Prism GraphPad (v.6.01). Error bars in figures represent SEM.
Data availability
All relevant data supporting the findings of this study are contained within the paper and supplementary infor-mation files, with the exception of the raw FASTQ sequencing files. Raw FASTQ data for screen replicates can be accessed by reasonable request to the corresponding author.
code availability
This study did not make use of custom code. The MAGeCKFlute software suite is freely available via the following link: https ://bioco nduct or.org/packa ges/relea se/bioc/html/MAGeC KFlut e.html.
Received: 11 December 2019; Accepted: 30 June 2020
References
1. Lee, V. J. et al. Advances in measuring influenza burden of disease. Influenza Other Respir Viruses 12, 3–9 (2018).
2. Iuliano, A. D. et al. Estimates of global seasonal influenza-associated respiratory mortality: a modelling study. Lancet 391, 1285– 1300 (2018).
3. Bouvier, N. M. The future of influenza vaccines: a historical and clinical perspective. Vaccines (Basel) 6, 58 (2018).
4. Barr, I. G. et al. Cell culture-derived influenza vaccines in the severe 2017–2018 epidemic season: a step towards improved influenza vaccine effectiveness. NPJ Vaccines 3, 44 (2018).
5. Skowronski, D. M. et al. Low 2012–13 influenza vaccine effectiveness associated with mutation in the egg-adapted H3N2 vaccine strain not antigenic drift in circulating viruses. PLoS ONE 9, e92153 (2014).
6. Zost, S. J. et al. Contemporary H3N2 influenza viruses have a glycosylation site that alters binding of antibodies elicited by egg-adapted vaccine strains. Proc Natl Acad Sci USA 114, 12578–12583 (2017).
7. Izurieta, H. S. et al. Relative effectiveness of cell-cultured and egg-based influenza vaccines among the U.S. elderly, 2017–2018. J
Infect Dis 220, 1255–1264 (2018).
8. Harding, A. T. & Heaton, N. S. Efforts to improve the seasonal influenza vaccine. Vaccines (Basel) 6, 19 (2018).
9. Milian, E. et al. Accelerated mass production of influenza virus seed stocks in HEK-293 suspension cell cultures by reverse genetics.
Vaccine 35, 3423–3430 (2017).
10. Agor, J. K. & Ozaltin, O. Y. Models for predicting the evolution of influenza to inform vaccine strain selection. Hum Vaccin
Immu-nother 14, 678–683 (2018).
11. Zimmerman, R. K. et al. 2014–2015 Influenza vaccine effectiveness in the united states by vaccine type. Clin Infect Dis 63, 1564– 1573 (2016).
12. Genzel, Y. Designing cell lines for viral vaccine production: where do we stand?. Biotechnol J 10, 728–740 (2015).
13. Tripathi, S. et al. Meta- and orthogonal integration of influenza “OMICs” data defines a role for UBR4 in virus budding. Cell Host
Microbe 18, 723–735 (2015).
14. Heaton, B. E. et al. A CRISPR Activation screen identifies a pan-avian influenza virus inhibitory host factor. Cell Rep 20, 1503–1512 (2017).
15. Reynolds, A. et al. Induction of the interferon response by siRNA is cell type- and duplex length-dependent. RNA 12, 988–993 (2006).
16. Wu, W., Orr-Burks, N., Karpilow, J. & Tripp, R. A. Development of improved vaccine cell lines against rotavirus. Sci Data 4, 170021 (2017).
17. van der Sanden, S. M. et al. Engineering enhanced vaccine cell lines to eradicate vaccine-preventable diseases: the polio end game.
J Virol 90, 1694–1704 (2016).
18. Hoeksema, F. et al. Enhancing viral vaccine production using engineered knockout vero cell lines: a second look. Vaccine 36, 2093–2103 (2018).
20. Costa, J. R. et al. Genome editing using engineered nucleases and their use in genomic screening. In Assay guidance manual, Vol. 2019 (eds Sittampalam, G. S. et al.) (Bethesda, Eli Lilly & Company and the National Center for Advancing Translational Sciences, 2017).
21. Doench, J. G. et al. Optimized sgRNA design to maximize activity and minimize off-target effects of CRISPR-Cas9. Nat Biotechnol
34, 184–191 (2016).
22. Cote, J., Garnier, A., Massie, B. & Kamen, A. Serum-free production of recombinant proteins and adenoviral vectors by 293SF-3F6 cells. Biotechnol Bioeng 59, 567–575 (1998).
23. Lin, Y. C. et al. Genome dynamics of the human embryonic kidney 293 lineage in response to cell biology manipulations. Nat
Commun 5, 4767 (2014).
24. Venereo-Sanchez, A. et al. Characterization of influenza H1N1 Gag virus-like particles and extracellular vesicles co-produced in HEK-293SF. Vaccine 37, 7100–7107 (2019).
25. Shen, C. F. et al. Optimization and scale-up of cell culture and purification processes for production of an adenovirus-vectored tuberculosis vaccine candidate. Vaccine 34, 3381–3387 (2016).
26. Benton, D. J. et al. Influenza hemagglutinin membrane anchor. Proc Natl Acad Sci USA 115, 10112–10117 (2018).
27. Chen, K. R. et al. TBK1-associated protein in endolysosomes (TAPE)/CC2D1A is a key regulator linking RIG-I-like receptors to antiviral immunity. J Biol Chem 287, 32216–32221 (2012).
28. Wu, X. et al. Inhibition of influenza a virus replication by TRIM14 via its multifaceted protein-protein interaction with NP. Front
Microbiol 10, 344 (2019).
29. Hart, T., Brown, K. R., Sircoulomb, F., Rottapel, R. & Moffat, J. Measuring error rates in genomic perturbation screens: gold stand-ards for human functional genomics. Mol Syst Biol 10, 733 (2014).
30. Haapaniemi, E., Botla, S., Persson, J., Schmierer, B. & Taipale, J. CRISPR-Cas9 genome editing induces a p53-mediated DNA damage response. Nat Med 24, 927–930 (2018).
31. Li, W. et al. MAGeCK enables robust identification of essential genes from genome-scale CRISPR/Cas9 knockout screens. Genome
Biol 15, 554 (2014).
32. Zhou, Y. et al. Metascape provides a biologist-oriented resource for the analysis of systems-level datasets. Nat Commun 10, 1523 (2019).
33. Vinayagam, A. et al. Protein complex-based analysis framework for high-throughput data sets. Sci Signal 6, rs5 (2013). 34. Satterly, N. et al. Influenza virus targets the mRNA export machinery and the nuclear pore complex. Proc Natl Acad Sci USA 104,
1853–1858 (2007).
35. Huang, J. & Manning, B. D. The TSC1-TSC2 complex: a molecular switchboard controlling cell growth. Biochem J 412, 179–190 (2008).
36. Kuss-Duerkop, S. K. et al. Influenza virus differentially activates mTORC1 and mTORC2 signaling to maximize late stage replica-tion. PLoS Pathog 13, e1006635 (2017).
37. Hopkins, K. C. et al. A genome-wide RNAi screen reveals that mRNA decapping restricts bunyaviral replication by limiting the pools of Dcp2-accessible targets for cap-snatching. Genes Dev 27, 1511–1525 (2013).
38. Fernandez, I. S. et al. Characterization of SMG-9, an essential component of the nonsense-mediated mRNA decay SMG1C complex.
Nucleic Acids Res 39, 347–358 (2011).
39. May, J. P., Yuan, X., Sawicki, E. & Simon, A. E. RNA virus evasion of nonsense-mediated decay. PLoS Pathog 14, e1007459 (2018). 40. Osada, N. et al. The genome landscape of the african green monkey kidney-derived vero cell line. DNA Res 21, 673–683 (2014). 41. Le Page, C., Genin, P., Baines, M. G. & Hiscott, J. Interferon activation and innate immunity. Rev Immunogenet 2, 374–386 (2000). 42. Murray, N. & McMichael, A. Antigen presentation in virus infection. Curr Opin Immunol 4, 401–407 (1992).
43. Karlas, A. et al. Genome-wide RNAi screen identifies human host factors crucial for influenza virus replication. Nature 463, 818–822 (2010).
44. Ansorge, S. et al. Development of a scalable process for high-yield lentiviral vector production by transient transfection of HEK293 suspension cultures. J Gene Med 11, 868–876 (2009).
45. Stewart, S. A. et al. Lentivirus-delivered stable gene silencing by RNAi in primary cells. RNA 9, 493–501 (2003).
46. Barczak, W., Suchorska, W., Rubis, B. & Kulcenty, K. Universal real-time PCR-based assay for lentiviral titration. Mol Biotechnol
57, 195–200 (2015).
47. Neumann, G., Fujii, K., Kino, Y. & Kawaoka, Y. An improved reverse genetics system for influenza A virus generation and its implications for vaccine production. Proc Natl Acad Sci USA 102, 16825–16829 (2005).
48. Powell, T. J., Silk, J. D., Sharps, J., Fodor, E. & Townsend, A. R. Pseudotyped influenza A virus as a vaccine for the induction of heterotypic immunity. J Virol 86, 13397–13406 (2012).
49. Montague, T. G., Cruz, J. M., Gagnon, J. A., Church, G. M. & Valen, E. CHOPCHOP: a CRISPR/Cas9 and TALEN web tool for genome editing. Nucleic Acids Res 42, W401–W407 (2014).
50. Sanjana, N. E., Shalem, O. & Zhang, F. Improved vectors and genome-wide libraries for CRISPR screening. Nat Methods 11, 783–784 (2014).
51. Brinkman, E. K., Chen, T., Amendola, M. & van Steensel, B. Easy quantitative assessment of genome editing by sequence trace decomposition. Nucleic Acids Res 42, e168 (2014).
52. Li, W. et al. Quality control, modeling, and visualization of CRISPR screens with MAGeCK-VISPR. Genome Biol 16, 281 (2015). 53. Wang, B. et al. Integrative analysis of pooled CRISPR genetic screens using MAGeCKFlute. Nat Protoc 14, 756–780 (2019). 54. Kolde, R., Laur, S., Adler, P. & Vilo, J. Robust rank aggregation for gene list integration and meta-analysis. Bioinformatics 28,
573–580 (2012).
55. Shannon, P. et al. Cytoscape: a software environment for integrated models of biomolecular interaction networks. Genome Res 13, 2498–2504 (2003).
Acknowledgements
This work was supported by funding from the Canadian Institutes of Health Research (CIHR-Grant CPG-151958), the Natural Sciences and Engineering Research Council (NSERC-Grant-CHRPJ-508335-17), and by the McGill Engineering Doctoral Award (MEDA). We also wish to thank Denis Flipo from the Université du Québec à Montréal (UQAM) Department of Biology for his advice and technical assistance.
Author contributions
D.M.S. designed all experiments, executed most experiments, and prepared the manuscript. S.N. performed the R.R.A. analysis of deep sequencing data and prepared figures related to this data. H.J.Y. executed some of experiments, specifically those relating to the generation of the HEK-293SFΔTBK1 knockout pool. J.F.G.
coordi-nated transfer of critical reagents from collaborators, assisted during some experiments, and provided critical reading of the manuscript. S.A., Y.X., and A.A.K. provided guidance, project supervision, and critical reading of the manuscript.
competing interests
The authors declare no competing interests.
Additional information
Supplementary information is available for this paper at https ://doi.org/10.1038/s4159 8-020-68934 -y. Correspondence and requests for materials should be addressed to A.A.K.
Reprints and permissions information is available at www.nature.com/reprints.
Publisher’s note Springer Nature remains neutral with regard to jurisdictional claims in published maps and institutional affiliations.
Open Access This article is licensed under a Creative Commons Attribution 4.0 International License, which permits use, sharing, adaptation, distribution and reproduction in any medium or format, as long as you give appropriate credit to the original author(s) and the source, provide a link to the Creative Commons license, and indicate if changes were made. The images or other third party material in this article are included in the article’s Creative Commons license, unless indicated otherwise in a credit line to the material. If material is not included in the article’s Creative Commons license and your intended use is not permitted by statutory regulation or exceeds the permitted use, you will need to obtain permission directly from the copyright holder. To view a copy of this license, visit http://creat iveco mmons .org/licen ses/by/4.0/.