Publisher’s version / Version de l'éditeur:
Vous avez des questions? Nous pouvons vous aider. Pour communiquer directement avec un auteur, consultez la première page de la revue dans laquelle son article a été publié afin de trouver ses coordonnées. Si vous n’arrivez pas à les repérer, communiquez avec nous à [email protected].
Questions? Contact the NRC Publications Archive team at
[email protected]. If you wish to email the authors directly, please see the first page of the publication for their contact information.
https://publications-cnrc.canada.ca/fra/droits
L’accès à ce site Web et l’utilisation de son contenu sont assujettis aux conditions présentées dans le site LISEZ CES CONDITIONS ATTENTIVEMENT AVANT D’UTILISER CE SITE WEB.
The Plant Genome, 12, 2, pp. 1-22, 2019-06-01
READ THESE TERMS AND CONDITIONS CAREFULLY BEFORE USING THIS WEBSITE. https://nrc-publications.canada.ca/eng/copyright
NRC Publications Archive Record / Notice des Archives des publications du CNRC : https://nrc-publications.canada.ca/eng/view/object/?id=17031767-41cc-4fb7-88f9-20f9de643755 https://publications-cnrc.canada.ca/fra/voir/objet/?id=17031767-41cc-4fb7-88f9-20f9de643755
NRC Publications Archive
Archives des publications du CNRC
This publication could be one of several versions: author’s original, accepted manuscript or the publisher’s version. / La version de cette publication peut être l’une des suivantes : la version prépublication de l’auteur, la version acceptée du manuscrit ou la version de l’éditeur.
For the publisher’s version, please access the DOI link below./ Pour consulter la version de l’éditeur, utilisez le lien DOI ci-dessous.
https://doi.org/10.3835/plantgenome2018.06.0040
Access and use of this website and the material on it are subject to the Terms and Conditions set forth at
Genome
-wide identification and characterization of the wheat remorin
(TaREM) family during cold acclimation
Badawi, Mohamed A.; Agharbaoui, Zahra; Zayed, Muhammad; Li, Qiang;
Byrns, Brook; Zou, Jitao; Fowler, D. Brian; Danyluk, Jean; Sarhan, Fathey
O R I G I N A L R ES E A R C H
The
Plant Genome
Genome-Wide Identification and Characterization of the
Wheat Remorin (TaREM) Family during Cold Acclimation
Mohamed A. Badawi, Zahra Agharbaoui, Muhammad Zayed, Qiang Li,
Brook Byrns, Jitao Zou, D. Brian Fowler, Jean Danyluk, and Fathey Sarhan*
ABSTRACT Remorins (REMs) are plant-specific proteins that play an essential role in plant–microbe interactions. However, their roles in vernalization and abiotic stress responses remain speculative. Most remorins have a variable proline-rich N-half and a more conserved C-half that is predicted to form coils. A search of the wheat (Triticum aestivum L.) database revealed the existence of 20 different REM genes, which we classified into six groups on the basis of whether they shared a common phylogenetic and structural origin. Analysis of the physical genomic distributions demonstrated that REM genes are dispersed in the wheat genome and have one to seven introns. Promoter analysis of TaREM genes revealed the presence of putative cis-elements related to diverse functions like development, hormonal regulation, and biotic and abiotic stress responsiveness. Expression levels of TaREM genes were measured in plants grown under field and controlled conditions and in response to hormone treatment. Our analyses revealed that 12 members of the REM family are regulated during cold acclimation in wheat in four different tissues (roots, crowns, stems, and leaves), with the highest expression in roots. Differential gene expression was found between wheat cultivars with contrasting degrees of cold tolerance, suggesting the implication of TaREM genes in cold response and tolerance. Additionally, eight genes were induced in response to abscisic acid and methyl jasmonate treatment. This genome-wide analysis of TaREM genes provides valuable resources for functional analysis aimed at understanding their role in stress adaptation.
R
emorins are plasma membrane-associated proteins found explicitly in all embryophytes including angio-sperms, gymnoangio-sperms, pteridophytes, and bryophytes (Checker and Khurana, 2013). Although REM proteins are speciically associated with the plasma membrane, they lack a transmembrane domain. hey are character-ized by a conserved C-terminal region with the signature coiled-coil structure, which is considered to be the fam-ily’s signature (Marín and Ott, 2012), and a dynamicCitation: Badawi, M.A., Z. Agharbaoui, M. Zayed, Q. Li, B. Byrns, J. Zou, D.B. Fowler, J. Danyluk, and F. Sarhan. 2019. Genome-wide identification and characterization of the wheat remorin (TaREM) family during cold acclimation. Plant Genome 12:180040. doi: 10.3835/ plantgenome2018.06.0040
Received 19 June 2018. Accepted 24 Jan. 2019. *Corresponding author ([email protected]).
© 2019 The Author(s). This is an open access article distributed under the CC BY-NC-ND license (http://creativecommons.org/licenses/by-nc-nd/4.0/).
M.A. Badawi, Z. Agharbaoui, M. Zayed, J. Danyluk, F. Sarhan, Dép. des Sciences Biologiques, Univ. du Québec à Montréal, Montréal, QC H3C 3P8, Canada; Q. Li, B. Byrns, D.B. Fowler, Dep. of Plant Sciences, Univ. of Saskatchewan, Saskatoon, SK S7N 5A8, Canada; Q. Li, J. Zou, National Research Council Canada, Saskatoon, SK S7N 0W9, Canada; M.A. Badawi, Agricultural Genetic Engineering Research Inst., Agricultural Research Centre, Giza, Egypt 12619; M. Zayed, Dep. of Biology and Centre for Structural and Functional Genomics, Concordia Univ., 7141 Sherbrooke St. W. Montreal, QC H4B 1R6, Canada; M. Zayed, Botany Dep., Faculty of Science, Menoufia Univ., Shebin El Kom, Egypt.
COREIDEAS
• Twenty diferent wheat remorin (TaREM) genes were identiied and classiied into six phylogenetic groups. • TaREM gene expression was measured in plants
grown under both ield and controlled cold conditions and in response to hormone treatment.
• Twelve TaREM were regulated during cold
acclimation in four diferent tissues (roots, crowns, stems, and leaves).
• Several TaREM genes are implicated in cold response and tolerance.
• Eight genes were induced in response to abscisic acid and methyl jasmonate treatment.
Abbreviations: ABA, abscisic acid; CBF, C-repeat binding factor; CRT, C-repeat; DRE, dehydration-responsive element; GSD1, REM setting defect1; IWGSC, International Wheat Genome Sequencing Consortium; MeJA, methyl jasmonate; MEME, Multiple Em for Motif Elucidation; NCBI, National Center for Biotechnology; REM, remorin; SA, salicylic acid
22
membrane-anchoring motif (Perraki et al., 2014). Experi-mental evidence has shown that the C-terminal region plays a determinant role in the mechanism by which most REM proteins bind speciically to the inner lealet of membrane domains. his binding is mediated by (S)-acyl-ation of cysteine residues in a C-terminal hydrophobic core (Konrad et al., 2014). he N-terminal region is highly variable and harbors many residues that can be phos-phorylated under a wide range of biological conditions (Marín and Ott, 2012; Marín et al., 2012). hrough a yeast two-hybrid interaction assay in Arabidopsis thaliana (L.) Heynh., Marín et al. (2012) demonstrated that the phos-phorylation of a serine residue (Ser-66) in the intrinsically disordered N-terminal region of AtREM1.3 mediates pro-tein–protein interactions, and may constitute a regulatory domain stabilizing these interactions.
Remorins have diverse functions in plant–microbe interactions (Campo et al., 2008; Jarsch and Ott, 2011) and plant defense against some pathogens (Jacinto et al., 1993; Reymond et al., 1996; Rafaele et al., 2009), and have been found in membrane lipid rats and plasmodesmata. It was reported that REMs impair cell-to-cell movement of Potato virus X by directly binding to the virus’s movement protein, TGBp1 (Rafaele et al., 2009). Other REMs, identiied as membrane-rat-associated proteins, interact with signaling proteins such as receptor-like kinases or act as scafold proteins (Lefebvre et al., 2010).
Recent studies report that REMs are critical factors for plant signaling cascades, particularly during plant– microbe interactions (Lucau-Danila et al., 2010; Rafaele et al., 2009; Tóth et al., 2012; Demir et al., 2013), and play essential roles in signal transduction and plasma membrane traicking (Reymond et al., 1996; Tóth et al., 2012; Marín et al., 2012; Marín and Ott, 2012). he REMs participate in plant hormone responses, as well as in cross-talk in several plant developmental processes (Gui et al., 2016). hey are also associated with apical, vascular, and embryonic tissues (Bariola et al., 2004) and are involved in somatic embryogenesis, as found in chicory (Cichorium intybus L.) (Lucau-Danila et al., 2010) and in regulating stem development and phloem formation in Populus deltoides Marshall (Li et al., 2013). OsREM4.1 protein coordinates the antagonistic interaction between abscisic acid (ABA) and brassinosteroid signaling pathways to regulate plant growth and development (Gui et al., 2016). In rice (Oryza sativa L.), the REM setting defect1 (GSD1) gene afects grain setting through regulating plasmodesmata conductance by interacting with actin. An overexpression of GSD1 leads to a reduction in the grain setting rate, carbohydrate accumulation in leaves, and soluble sugar content in the phloem exudates (Gui et al., 2014, 2015). Recently, Gui et al. (2016) found that the OsREM4.1 plays an essential function in equilibrating plant growth with varying environments in rice. In addition to their role in plant defense and development, there is evidence that REMs may play a role in plants’ adaptations to environmental conditions. he mulberry (Morus indica L.) remorin
(MiREM) transcript was induced during salt and water stress in mature leaves (Checker and Khurana, 2013). In foxtail millet [Setaria italica (L.) P.Beauv.], the SiREM6 transcript was induced by high salt and cold treatment but not by drought stress (Yue et al., 2014). Overexpression of these two REM genes improved salt (Checker and Khurana, 2013, Yue et al., 2014) and dehydration tolerance (Checker and Khurana, 2013) in transgenic A. thaliana during seed germination and seedling developmental stages. Although the REM gene family has been investigated in potato (Solanum tuberosum L.)(Jacinto et al., 1993), tobacco (Nicotiana tabacum L.) (Mongrand et al., 2004), tomato (Solanum lycopersicum L.) (Bariola et al., 2004), A. thaliana (Bhat et al., 2005), rice (Rafaele et al., 2007), and Medicago trunculata Gaertn. (Lefebvre et al., 2007), the structural features, phylogenetics, and functional properties of the REM gene family in common wheat (T. aestivum) have not been studied, especially in relation to cold tolerance and hormonal regulation.
In this study, 20 TaREM genes were identiied from Ensembl wheat genome sequences and RNA-Seq data. Phylogenetic analysis, chromosomal localization, and expression proiling of these REMs were investigated during phenological development and cold acclimation and in response to hormonal treatment. he analyses revealed that TaREMs are expressed in roots, crowns, stems, and leaves. Several members of the wheat REM family were regulated during cold acclimation and are associated with cold tolerance, whereas others responded to ABA and methyl jasmonate (MeJA) treatment. his genome-wide analysis of TaREM genes provides valuable resources for functional analysis to determine their role in stress adaptations.
MATERIALS AND METHODS
Plant Material and Environmental Conditions
‘Norstar’ (Grant, 1980) winter wheat and ‘Manitou’ (Campbell, 1967) spring wheat were used for gene expression experiments, where plants were grown in environmentally controlled growth chambers as previ-ously described (Badawi et al., 2007). Under the cold treatment (4°C), the sampling times were at 22 h and 7, 21, 35, and 56 d. Abscisic acid and MeJA treatments were performed as described previously (Danyluk et al., 1998; Diallo et al., 2014). Briely, two groups of seedlings were sprayed with 150 mM MeJA or 100 mM ABA dissolved in 0.1% Tween 20 (Sigma-Aldrich, St Louis, MO) solutions. Each group of treated plants was watered with one of these treatment solutions. he untreated plants received a mock treatment of 0.1% Tween 20 solution and were used as a control. he samples were collected at 4 and 24 h for both ABA and MeJA. For the tissue-speciic experiment, diferent tissues were collected at 22 h, 7, 21, 35, and 56 d for seedlings and at 1 and 8 d for roots, crowns, stems, and leaves. For all experiments, two biological replicates were collected for each sample for expression analysis.
For RNA-Seq analyses, developing crowns of Norstar and Manitou wheat grown under ield conditions were
collected at ive time points in 2010 as described by Li et al. (2018). Two biological replicates were collected for each sampling date and immediately frozen in liquid nitrogen and stored at –80°C for analysis.
Identification of the REM Genes in T. aestivum
To investigate the REM gene family in wheat, all REM sequences of O. sativa were used as queries for a BLAST search against the whole genome sequence of T. aes-tivum cv. Chinese Spring (release No. 42) from the Ensembl Plants database (http://plants.ensembl.org, accessed 21 Mar. 2019) (Kersey et al., 2014) with default parameters and from the International Wheat Genome Sequencing Consortium (IWGSC). All potential REM proteins were further screened to conirm the pres-ence of the REM domain in the the National Center for Biotechnology (NCBI) database (https://blast.ncbi. nlm.nih.gov/Blast.cgi?PROGRAM=blastp&PAGE_ TYPE=BlastSearch&LINK_LOC=blasthome, accessed 8 Apr. 2019). he REM sequences were conirmed by the presence of a remorin domain, and the putative REM proteins were aligned to rice and A. thaliana. Remo-rin proteins were classiied into diferent groups, as described by Rafaele et al. (2007). All putative annota-tions of the REM genes were retrieved from the T. aesti-vum genome website and the number and distribution of introns in REM genes were investigated through the use of T. aestivum genome annotation information.
Phylogenetic and Mapping Analyses
Rice and wheat REM protein sequences were obtained from the NCBI (http://www.ncbi.nlm.nih.gov/protein/, accessed 21 Mar. 2019), Ensembl (http://plants.ensembl. org, accessed 21 Mar. 2019) (Kersey et al., 2014), and IWGSC (https://urgi.versailles.inra.fr/blast_iwgsc/, accessed 21 Mar. 2019) databases. hese sequences were analyzed and 20 TaREMs and 20 OsREM genes were aligned with MUSCLE (http://www.ebi.ac.uk/Tools/ msa/muscle/, accessed 21 Mar. 2019). A maximum likeli-hood tree was derived from this alignment with the LG + Gamma model and a bootstrap value of 500 replicates in Molecular Evolutionary Genetics Analysis version 6 (Tamura et al., 2011). Graphical representations of TaREMs’ positions on the chromosomes of T. aestivum were drawn with MapChart sotware (Voorrips, 2002).
Gene Structure and Conserved Motif Analyses
Genomic sequences and open reading frames of TaREMs were obtained from Ensembl (Kersey et al., 2014). he exon and intron structure was identiied with Gene Struc-ture Display Server version 2.0 (http://gsds.cbi.pku.edu. cn/, accessed 21 Mar. 2019) (Hu et al., 2015) by aligning the cDNA sequences to the corresponding genomic sequences. he TaREMs’ coding sequences were translated to protein sequences with the TRANSLATE tool of the ExPASys-erver (http://web.expasy.org/translate/, accessed 21 Mar. 2019). Conserved motifs of the genes were analyzed with the Multiple Em for Motif Elucidation (MEME) program
(http://meme-suite.org/tools/meme, accessed 29 Mar. 2019) (Bailey and Elkan, 1994). he following parameters in the MEME tool were used for the distribution of motif occurrences: any number of repetitions, the maximum number of motifs was set to 20 motifs; optimum motif width was set to 6 to 100, and the ratio of minimum to maximum number of sites was 5:100. Identiied MEME motifs other than the C-remorin domain was achieved with PROSITE and the Eukaryotic Linear Motif tools (http://elm.eu.org/, accessed 21 Mar. 2019) (Gould et al., 2010) for functional sites in proteins.
Database Searching and Identification of Cis-Regulatory Elements in the Promoter Region
Putative cis-acting regulatory DNA elements in TaREM genes were identiied in the 1.5 kb upstream region preceeding the translation initiation site, as in previous studies (Badawi et al., 2008; Li et al., 2018). Promoter sequences were analyzed with PlantCARE sotware (http://bioinformatics.psb.ugent.be/webtools/plantcare/ html/, accessed 21 Mar. 2019) as previously described (Lescot et al., 2002).
Protein subcellular localization was determined by CELLO (http://cello.life.nctu.edu.tw, accessed 21 Mar. 2019). he ExPASy tools (http://web.expasy.org/ compute_pi, accessed 21 Mar. 2019) were used to predict some biochemical properties of REM proteins such as the molecular weight and the isoelectric point, which indicates the balance of positive and negative amino acid residues.
Gene Expression Profile Analysis
he RNA-Seq data corresponding to the TaREM genes was downloaded from the Norstar and Manitou wheat crown transcriptome database and can be found in the Gene Expression Omnibus under the accession number GSE101118 (Li et al., 2018).
Illumina RNA-Seq data analyses were performed on crowns of plants grown under ield conditions from early autumn to winter in 2010 (Li et al., 2018). he reads per million were obtained from the ield condition RNA-Seq database subjected to surrogate variable R analysis (Leek, 2014) to correct variation in the transcriptome sequencing data. he expression cluster for each TaREM gene for each cultivar–time point combination represents the total reads of the three copies (A, B, and D) and the mean values of the two biological replicates (Li et al., 2018).
A BLASTN search of the gene sequence obtained from the Ensmbl wheat genome was performed against the TaREM genes identiied in this study to ind and conirm the corresponding Genevestigator REM identiiers (Supplemental Table S4). he RNA-Seq databases of T. aestivum from diferent tissues and developmental stages (Hruz et al., 2008) were analyzed with the Genevestigator tool (http://www.genevestigator. ethz.ch/, accessed 21 Mar. 2019). he expression patterns obtained are presented as heat maps in yellow and blue for diferent stresses and burgundy–white color-coding for tissues and developmental stages.
22
RNA Extraction and Expression Analyses of the
TaREM Genes by Quantitative Real-Time Polymerase
Chain Reaction
Total RNA was isolated from samples of all the experi-ments with the mirVana miRNA Isolation Kit (hermo-Fisher-Scientiic). he purity and quality of RNA were analyzed by NanoDrop 2000c (hermoFisher-Scientiic). A 0.9-µg aliquot of total RNA was treated with gDNA wipeout bufer in the QuantiTect Reverse Transcrip-tion Kit (Qiagen) and then reverse-transcribed. For the quantitative real-time polymerase chain reaction (qRT-PCR), 2 μL of cDNA template (equivalent to 90 ng of total RNA) were used with LightCycler 480 SYBR Green I Master (Roche Life Science). he qRT-PCR was performed with the FX96 Real-time Detection System (Bio-Rad) according to the manufacturer’s instructions. he polymerase chain reaction conditions were as fol-lows: 95°C for 15 min and 40 cycles of 95°C for 15 s, 55°C for 30 s, and 72°C for 30 s. he experiments were repeated for the two biological replicates. Each reaction was conducted in duplicate to ensure the reproducibility of results. he DDCT method was used to calculate the relative expression levels of TaREM with using 18S as the reference gene. he gene-speciic primers were used to quantify the transcripts of TaREM. All the primers used for qRT-PCR are listed in Supplemental Table S5. Expres-sion levels were calculated from the cycle threshold according to the ΔΔCT method (Livak and Schmittgen, 2001). he statistical analysis was done using Prism ver-sion 5.0 (GraphPad Sotware). Values are shown as means ± SD. Means were compared via one-way ANOVA fol-lowed by Tukey’s test. Signiicance was set at P £ 0.05.
RESULTS AND DISCUSSION
Analyses of gene families have become essential in the understanding of gene structure, protein function, and evolution. Here, we conducted a comprehensive analysis of the TaREM gene family to determine their potential functions in response to an abiotic stress (i.e., exception-ally cold temperatures), phenological development, and hormones such as MeJA and ABA.
Identification and Phylogenetic Analysis of the Wheat Remorin Gene Family
Twenty rice REM genes were used to search the Ensembl database (release 42) and then used to identify genes encoding REMs in the wheat genome. Twenty complete TaREM coding sequences were identiied. Based on their genomic location, these genes were present as two or three homeoallelic coding sequences on the three genomes of hexaploid wheat (A, B, and D). On the basis of the phy-logeny of their C-terminal domain, the identiied REM genes were classiied into six groups. his classiication was based on nomenclature established by Rafaele et al. (2007) for the cereal species O. sativa. To be consistent with the method of Rafaele et al. (2007), we assigned identical gene
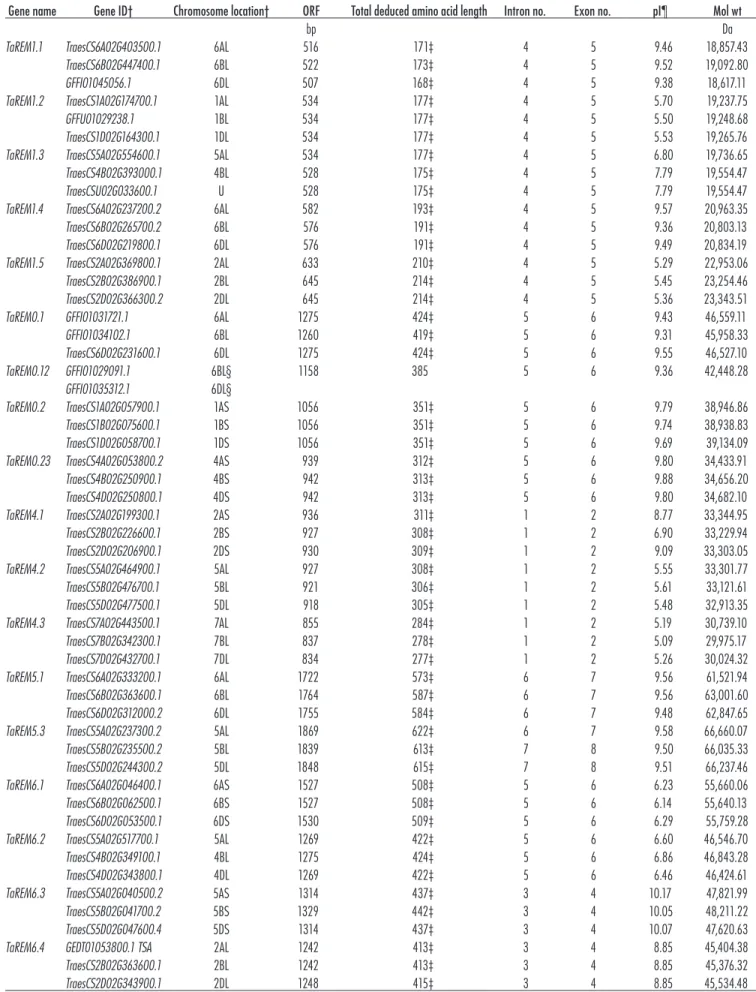
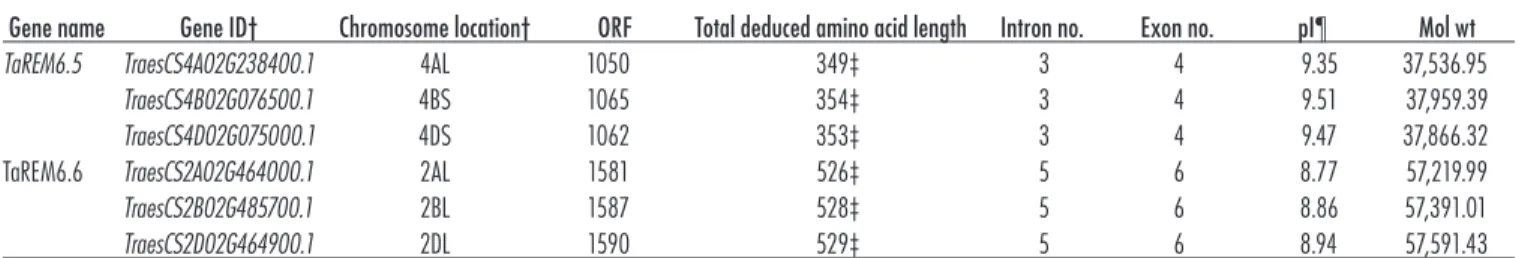
numbers to orthologs of hexaploid wheat (Groups 0.1, 0.2, 1, 4, 5, and 6). In total, 58 TaREM copies were identi-ied with their characteristic information such as the gene ID, position on the chromosomes, coding sequence size, amino acids, number of introns and exons, isoelectric point, and molecular weight of the predicted protein (Table 1). Most wheat REM gene loci have three copies distributed across the three wheat genomes except TaREM0.12, which has only two copies (Table 1). hese analyses found that TaREM genes encode predicted polypeptides with a wide range of sizes (168 –622 amino acids) and isoelectric points (5.09–10.17). All identiied TaREM proteins had a typical remorin motif at the C-terminus (Fig. 1A, B). he TaREM C-motif contained a coiled-coil domain, a signature of the remorin family. he multiple sequence alignment of the C-terminal region of all identiied wheat REM proteins revealed a highly conserved coiled-coil domain (Fig. 1A). he number of REMs in rice, A. thaliana, and wheat were found to be much higher than in poplar (eight REMs) (Rafaele et al. (2007), and foxtail millet (11 REMs) (Yue et al., 2014), indicating that the REM family in the irst three species has expanded over time. his expansion of the TaREM gene family is probably a result of whole-genome duplication or segmental duplication. Gene duplication played a crucial role in the expansion of gene families, cre-ating the opportunity for changes in gene function, which, in turn, allowed for optimal adaptability to diverse envi-ronmental conditions (Xu et al., 2012).
Previously, Rafaele et al. (2007) showed that some monocot and eudicot REM sequences are separated on a phylogenetic tree, suggesting the existence of speciic groups in monocots and eudicots. To study the phylogenetic relationships of the wheat REM family, we retrieved the REM proteins described by Rafaele et al. (2007), the 16 A. thaliana REM members, and the four Populus and Medicago group members associated with both genera as representatives of eudicot REMs, plus the 20 O. sativa REM members as additional monocot representatives. During our initial comparisons of REM proteins from diferent groups, it was diicult to align the entire protein of distant members with complete conidence. herefore, we only aligned the amino acids encompassing the conserved C-motif from the 58 proteins. A maximum likelihood tree was derived from this alignment and is presented in Fig. 2. his analysis showed that REM proteins cluster into six monophyletic groups. Groups 0.2, 1, and 4 clearly show a separation of monocot and eudicot REM sequences, suggesting that only one representative per group may have existed during eudicot–monocot divergence. hese groups now account for 10 REM proteins in each species. Groups 5 and 6 display two and four distinct branches that contain at least one REM member from each species, suggesting that the ampliication of genes within these groups preceded eudicot–monocot divergence. hese groups now contain six, nine, and eight REM proteins in A. thaliana, rice, and wheat, respectively. No A. thaliana REM proteins clustered with members from Group 0.1,
Table 1. Characteristics of remorin (TaREM) genes identified from the genome-wide search analysis.
Gene name Gene ID† Chromosome location† ORF Total deduced amino acid length Intron no. Exon no. pI¶ Mol wt
bp Da
TaREM1.1 TraesCS6A02G403500.1 6AL 516 171‡ 4 5 9.46 18,857.43
TraesCS6B02G447400.1 6BL 522 173‡ 4 5 9.52 19,092.80
GFFI01045056.1 6DL 507 168‡ 4 5 9.38 18,617.11
TaREM1.2 TraesCS1A02G174700.1 1AL 534 177‡ 4 5 5.70 19,237.75
GFFU01029238.1 1BL 534 177‡ 4 5 5.50 19,248.68
TraesCS1D02G164300.1 1DL 534 177‡ 4 5 5.53 19,265.76
TaREM1.3 TraesCS5A02G554600.1 5AL 534 177‡ 4 5 6.80 19,736.65
TraesCS4B02G393000.1 4BL 528 175‡ 4 5 7.79 19,554.47
TraesCSU02G033600.1 U 528 175‡ 4 5 7.79 19,554.47
TaREM1.4 TraesCS6A02G237200.2 6AL 582 193‡ 4 5 9.57 20,963.35
TraesCS6B02G265700.2 6BL 576 191‡ 4 5 9.36 20,803.13
TraesCS6D02G219800.1 6DL 576 191‡ 4 5 9.49 20,834.19
TaREM1.5 TraesCS2A02G369800.1 2AL 633 210‡ 4 5 5.29 22,953.06
TraesCS2B02G386900.1 2BL 645 214‡ 4 5 5.45 23,254.46
TraesCS2D02G366300.2 2DL 645 214‡ 4 5 5.36 23,343.51
TaREM0.1 GFFI01031721.1 6AL 1275 424‡ 5 6 9.43 46,559.11
GFFI01034102.1 6BL 1260 419‡ 5 6 9.31 45,958.33
TraesCS6D02G231600.1 6DL 1275 424‡ 5 6 9.55 46,527.10
TaREM0.12 GFFI01029091.1 6BL§ 1158 385 5 6 9.36 42,448.28
GFFI01035312.1 6DL§
TaREM0.2 TraesCS1A02G057900.1 1AS 1056 351‡ 5 6 9.79 38,946.86
TraesCS1B02G075600.1 1BS 1056 351‡ 5 6 9.74 38,938.83
TraesCS1D02G058700.1 1DS 1056 351‡ 5 6 9.69 39,134.09
TaREM0.23 TraesCS4A02G053800.2 4AS 939 312‡ 5 6 9.80 34,433.91
TraesCS4B02G250900.1 4BS 942 313‡ 5 6 9.88 34,656.20
TraesCS4D02G250800.1 4DS 942 313‡ 5 6 9.80 34,682.10
TaREM4.1 TraesCS2A02G199300.1 2AS 936 311‡ 1 2 8.77 33,344.95
TraesCS2B02G226600.1 2BS 927 308‡ 1 2 6.90 33,229.94
TraesCS2D02G206900.1 2DS 930 309‡ 1 2 9.09 33,303.05
TaREM4.2 TraesCS5A02G464900.1 5AL 927 308‡ 1 2 5.55 33,301.77
TraesCS5B02G476700.1 5BL 921 306‡ 1 2 5.61 33,121.61
TraesCS5D02G477500.1 5DL 918 305‡ 1 2 5.48 32,913.35
TaREM4.3 TraesCS7A02G443500.1 7AL 855 284‡ 1 2 5.19 30,739.10
TraesCS7B02G342300.1 7BL 837 278‡ 1 2 5.09 29,975.17
TraesCS7D02G432700.1 7DL 834 277‡ 1 2 5.26 30,024.32
TaREM5.1 TraesCS6A02G333200.1 6AL 1722 573‡ 6 7 9.56 61,521.94
TraesCS6B02G363600.1 6BL 1764 587‡ 6 7 9.56 63,001.60
TraesCS6D02G312000.2 6DL 1755 584‡ 6 7 9.48 62,847.65
TaREM5.3 TraesCS5A02G237300.2 5AL 1869 622‡ 6 7 9.58 66,660.07
TraesCS5B02G235500.2 5BL 1839 613‡ 7 8 9.50 66,035.33
TraesCS5D02G244300.2 5DL 1848 615‡ 7 8 9.51 66,237.46
TaREM6.1 TraesCS6A02G046400.1 6AS 1527 508‡ 5 6 6.23 55,660.06
TraesCS6B02G062500.1 6BS 1527 508‡ 5 6 6.14 55,640.13
TraesCS6D02G053500.1 6DS 1530 509‡ 5 6 6.29 55,759.28
TaREM6.2 TraesCS5A02G517700.1 5AL 1269 422‡ 5 6 6.60 46,546.70
TraesCS4B02G349100.1 4BL 1275 424‡ 5 6 6.86 46,843.28
TraesCS4D02G343800.1 4DL 1269 422‡ 5 6 6.46 46,424.61
TaREM6.3 TraesCS5A02G040500.2 5AS 1314 437‡ 3 4 10.17 47,821.99
TraesCS5B02G041700.2 5BS 1329 442‡ 3 4 10.05 48,211.22
TraesCS5D02G047600.4 5DS 1314 437‡ 3 4 10.07 47,620.63
TaREM6.4 GEDT01053800.1 TSA 2AL 1242 413‡ 3 4 8.85 45,404.38
TraesCS2B02G363600.1 2BL 1242 413‡ 3 4 8.85 45,376.32
TraesCS2D02G343900.1 2DL 1248 415‡ 3 4 8.85 45,534.48
22
suggesting its speciicity to the monocot group. he REM phylogenetic tree showed mostly the same clustering patterns in the two members of the grass family, wheat and rice. he phylogenetic similarity between T. aestivum and O. sativa REM proteins suggests that they might have evolved conservatively. In total, 19 REM proteins out of 20 were clustered as pairs, revealing their orthologous relationship. Furthermore, TaREM0.12 and OsREM5.2 represent additional genes that may have explicitly duplicated in wheat and rice, respectively. Yue et al. (2014) showed that the 11 SiREMs (foxtail millet) were classiied into four phylogenetic groups. In A. thaliana, all 16 AtREM genes were divided into ive groups (1, 3, 4, 5, and 6). hese results indicate that TaREM, OsREM, and AtREM genes may have undergone diferent duplication events. As shown in Supplemental Fig. S1, the orthologs from the A, B, and D genomes tended to form an orthologous pair at the branch end, indicating that the orthologs from A, B, and D had a close relationship.
Chromosomal Locations of Wheat Remorin Members
TaREM genes were located on all the homeologous groups of wheat chromosomes except Group 3 (Fig. 3), whereas no REM genes were found in rice chromosomes 1, 5, 6, and 7. REM genes in A. thaliana were distrib-uted among all ive chromosomes (Rafaele et al., 2007). TaREM genes were over-represented on Group 6 and 4 chromosomes, which contain six and four TaREM genes respectively (Fig. 3). Interestingly, the Group 6 chro-mosomes had the greatest number of COR genes (Li et al., 2018). TaREM4.2, TaREM5.3, and TaREM6.3 were located in Group 5 chromosomes, which are known to harbor most of the genes that regulate cold tolerance and development. It is known that chromosome 5A has the freezing tolerance locus (FR2) and contains a cluster of C-repeat binding factor (CBF) genes (Miller et al., 2006).
Gene Structure of Wheat Remorins
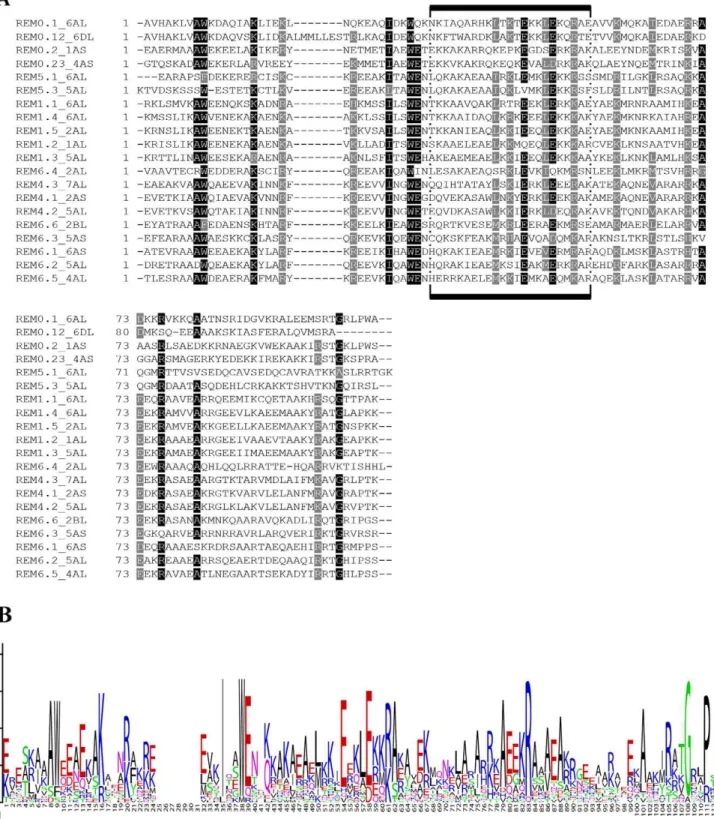
he exon–intron structure of the TaREMs was analyzed (Fig. 4A and B) to gain further insight into the evolu-tion of TaREM. his analysis showed a conserved intron number ranging from one to six per gene between wheat and rice (Fig. 4B). he conined number of introns sug-gests that there is similar gene structure diversity for the
REM genes in monocots. All genes from phylogenetic Groups 0.1 and 0.2 and three from Group 6 (TaREM6.1, TaREM6.2, and TaREM6.6) contained ive introns (Table 1, Fig. 4A, B), whereas all members of Group 1 had four introns. TaREM5.3 was the only member that had six to seven introns, whereas Group 4 contained only one intron. TaREM6.3, TaREM6.4, and TaREM6.5 have three introns, whereas TaREM5.1 has six introns. he most important diferences in the structure of TaREMs were in the intron length (Fig. 4A). he presence of several introns in these genes could cause alternative splicing and diferent splice variants of REMs. Sequence analysis shows that all REMs from the six groups produced diferent transcripts from each corresponding gene, indicating that TaREMs are subjected to alternative splicing. he number of splicing sites varied from two to seven sites (Supple-mentary Table S1). In general, most of the genes in the same group had similar sequence identities and shared the same number of intron structures, indicating a close evolutionary relationship and the related gene structure diversity of REM genes. he intron lengths within genes showed similar patterns within groups. he intron–exon organization and intron numbers of REM genes in the wheat genome were similar to those of rice, except for the genes TaREM5.1, TaREM6.3, and TaREM6.5 (Fig. 4B, Supplemental Table S1), suggesting an evolutionary con-servation of REM genes in monocots. Similar numbers of introns were also observed in A. thaliana (Supplemental Table S1, Fig. 4B), which may suggest the evolutionary conservation of REM genes in plants. he TaREM genes were strictly related to recent progenitors. TaREM1.2 to TaREM1.5 were more closely related to TuREM, which is the A-genome donor relative from Triticum urartu hu-manjan ex Gandilyan (Ling et al., 2013). Sequence analy-sis showed that these four REM genes have 99, 99, 96, and 98% identity with TuREM, respectively. he TaREM genes on the A and B genomes also had a closer identity to the allelic genes on the D genome. For example, TaREM5.1 on chromosome 6B was similar to the TaREM5.1 on chromosome 6D, whereas the TaREM6.3 on chromo-some 5A was similar to TaREM6.3 on chromochromo-some 5D (Supplemental Fig. S1). Marcussen et al. (2014) proposed that several rounds of hybridization may have produced T. aestivum. Additionally, phylogenomic analyses showed
Table 1. Continued.
Gene name Gene ID† Chromosome location† ORF Total deduced amino acid length Intron no. Exon no. pI¶ Mol wt
TaREM6.5 TraesCS4A02G238400.1 4AL 1050 349‡ 3 4 9.35 37,536.95
TraesCS4B02G076500.1 4BS 1065 354‡ 3 4 9.51 37,959.39
TraesCS4D02G075000.1 4DS 1062 353‡ 3 4 9.47 37,866.32
TaREM6.6 TraesCS2A02G464000.1 2AL 1581 526‡ 5 6 8.77 57,219.99
TraesCS2B02G485700.1 2BL 1587 528‡ 5 6 8.86 57,391.01
TraesCS2D02G464900.1 2DL 1590 529‡ 5 6 8.94 57,591.43
† Accession numbers (Gene ID) and chromosome locations have been taken from from Ensembl or NCBI. ‡ Complete protein.
§For TaREM0.12, neither the 6D nor 6B copies are annotated in ENSEMBL; the 6B and 6D copies may be pseudogenes. ¶ pI, isoelectric point; U, unknown chromosome; L, long arm; S, short arm; Mol wt, molecular weight.
that the D genome may be a product of homoploid hybrid speciation between the A and B genome ancestors 5 to 6 million yr ago. he retention of all REM genes in the
three genomes of T. aestivum may have enhanced the function of each REM group by adding extra copies.
Fig. 1. Conserved motif analysis of the remorin (REM) C-terminal sequences in wheat. (A) Multiple sequence alignment of wheat REM motif is shown. The homeologous A copy from all REM genes were used in the analysis, except for TaREM0.12, for which the D copy was used. The coiled-coil domain in the REM motif is boxed. The conserved amino acid and blocks of similar amino acid residues are shaded in black and gray, respectively. (B), Sequence representation LOGO derived from the multiple sequence alignment of the remorin C-motif. The x-axis repre-sents the conserved sequence. The y-axis is a scale that reflects the conservation rate of each amino acid across all proteins.
22
Fig. 2. Phylogenetic relationships between all remorin proteins from T. aestivum, O. sativa, and A.thaliana. The amino acids corresponding to the conserved C-motif from the three species were aligned by MUSCLE in Molecular Evolutionary Genetics Analysis version 6. A maximum likelihood tree (ML) was derived from this alignment via the LG + Gamma model and a bootstrap value of 500 replicates. In addition, four proteins from the Populus + Medicago [Group 2-specific remorins in Raffaele et al. (2007)] were included for comparison. The wheat remorins were grouped into six distinct groups and annotated with different colors. Genes belonging to the different groups are listed in Table 1.
Fig. 3. Chromosomal locations of remorin (TaREM) genes in the wheat genome. The distributions of the 58 remorin genes were determined according to the scaffold number and are shown in red. Chromosome 3 does not have any remorins and was excluded in this figure. The num-bers on the top indicate each chromosome number and the genome (A, B, or D). Positions are indicated in kb on chromosomes and bases on scaffolds. U, unknown chromosome.
22
Motifs and Subcellular Localization Analysis
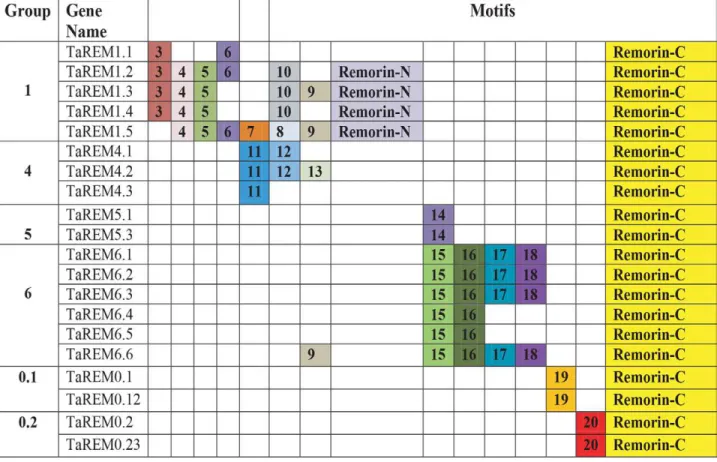
Motifs were identiied with the MEME program (http:// meme-suite.org/tools/meme, accessed 22 Mar. 2019) to study the diversity and conservation among the TaREMs. Twenty distinct motifs were identiied among the 20 TaREM proteins. he distribution of motifs in the difer-ent remorin groups, the protein motifs, and their consen-sus are shown in Fig. 5 and Supplemental Table S2. he size of the identiied motifs ranged from 10 to 107 amino acids (Supplemental Table S2). he closely related genes within each group in the phylogenetic tree shared com-mon motif sequences and positions (Fig. 2 and Fig. 5). In general, remorins have a conserved C-terminal domain, considered to be a signature of the protein; a predicted coiled-coil; and a variable N-terminal region. Motif analyses showed that the remorin C-domain (Motif 1) is uniformly present in all wheat remorin proteins, sug-gesting that they are evolutionarily conserved in plants. he remorin N-domain is about 64 amino acids (Motif 2) and was found only in Group 1 remorins. his group has both remorin N- and remorin C-domains, except for TaREM1.1, which is missing the remorin N-domain but still contains high proline content, like other members of Group 1. Exclusively, Group 4 members have similar numbers of proline in the N-terminal region. It has been reported that Group 1 remorins from dicots have a higher percentage of prolines in this region but the biological
signiicance of this remains unclear (Yue et al., 2014; Raf-faele et al., 2007). We found that Group 1 remorins have several motifs (3–10) in the N-terminal region. Group 4 was characterized by the presence of a serine rich sequence in the N-terminal region that contains one speciic motif (Motif 11) corresponding to the putative glycosylation site. Group 5 contains only one conserved motif in the N-terminal region and has a putative phosphorylation site (Motif 14). Group 6 has four conserved motifs (Motifs 15–18, corresponding to Collagen IV, a carboxyl-terminal non-collagenous (NC1) domain proile collagen; LDL-receptor class B repeat proile; a protein kinase C phos-phorylation site; and LIG_LIR_Gen_1, a canonical LIR motif that binds to Atg8 protein family members to medi-ate processes involved in autophagy) at the N-terminus, except TaREM6.4 and TaREM6.5, which contained only two motifs (15 and 16). Most of the closely related mem-bers in the phylogenetic tree had identical motif composi-tions, suggesting functional similarities among the REM proteins within the same group (Fig. 2, Fig 5, and Supple-mental Table S2). he motif distribution and organization showed that remorin proteins were conserved during evolution and the motif distribution in diferent groups of proteins could be the source of the functional diver-gence in remorin genes over time. he presence of variable N-terminal regions in remorin genes suggests diferent structures and functions (Marín and Ott, 2012).
Fig. 4. Gene structure of the remorin (REM) gene family in wheat. (A) The exon–intron structures were determined by comparing the coding sequences of TaREM genes and their corresponding genomic sequences. Exons, introns, and upstream or downstream untranslated regions are represented, respectively, by yellow rectangles, black lines, and blue rectangles. The scale bar on the bottom line indicates genes size in bp. The number at the left side represents the phylogenetic groups and their corresponding REM genes. (B) Comparison between the remorin exon numbers in wheat, rice, and A. thaliana. The analyses of exon–intron structures were performed with Gene Structure Display Server software (http://gsds.cbi.pku.edu.cn, accessed 22 Mar. 2019). –, no equivalent gene was present in the species.
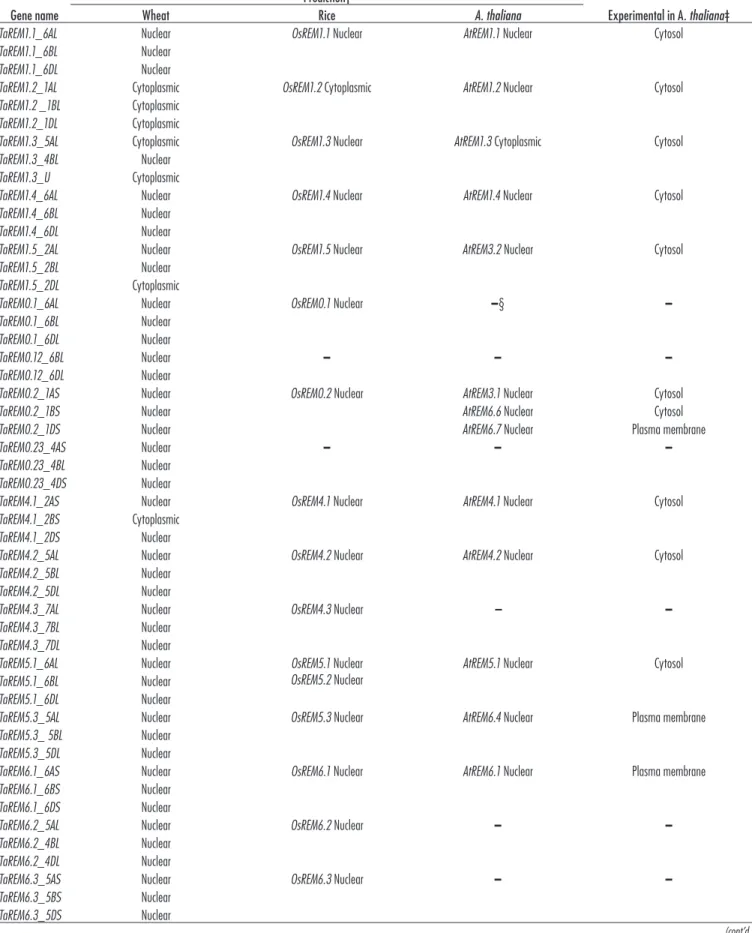
Subcellular localization of the TaREM proteins was predicted with the CELLO program. he putative TaREM protein subcellular localizations showed that most TaREMs were concentrated in the nucleus. However, a few REMs proteins (TaREM1.2, TaREM1.3, TaREM1.5D, and TaREM4.1B) were localized in the cytoplasm (Table 2). hese diferences may be related to the motif sequence and suggest that the subcellular localization of TaREMs is diverse and complex.
Bioinformatics Analysis of Putative TaREM Promoters
To elucidate the regulatory mechanisms of 20 TaREMs, the transcriptional response elements of their promoters were identiied from the regions upstream of the start site in the T. aestivum genome through use of the PlantCARE promoter databases. All the putative TaREM promot-ers possessed typical TATA and CAAT boxes (Table 3, Supplemental Table S3), which are the core elements in promoter and enhancer regions. he predicted regula-tory cis-elements include transcription binding sites and numerous elements related to stress, phytohormone, and light responses (Table 3). Light-responsive elements, which contain diferent core elements (Supplemental Table S3), represent most of the predicted elements. Every promoter possessed 10 to 20 types of light core elements, indicat-ing that light might diferentially regulate TaREMs. he presence of a light-responsive element was reported in a
soybean [Glycine max (L.) Merr.] remorin gene regulated under drought stress (Marcolino-Gomes et al., 2014). he 13 predicted hormone-responsive regulatory elements are associated with ABA (ABA-responsive element, CE1, CE3, and Motif IIb), ethylene (ERE), MeJA (a cis-acting regulatory element involved in MeJA-responsiveness; CGTCA and TGACG motifs), gibberellic acid (GARE motif, TATC-box, and P-box), auxin (AuxR-core, TGA-box, and TGA element), and salicylic acid (SA) (TCA-element) responses. he ABA-responsive cis-elements in REM gene promoters were also found in foxtail millet (Yue et al., 2014). Regulation of REM gene expression in response to hormone treatment including ABA, MeJA, auxin, and/or salicylic acid has been reported in difer-ent species (Checker and Khurana, 2013; Yue et al., 2014; Kong et al., 2016). he induction of MiREM and SiREM6 in response to exogenous ABA treatment in mulberry and foxtail millet, respectively, suggest that these two genes could be involved in abiotic stress tolerance through the ABA-dependent signal pathway (Checker and Khurana, 2013; Yue et al., 2014). he predicted TaREM promoters had many cis-elements related to endosperm expression, such as Skn-1 and GCN4; RY, which is a cis-acting regula-tory element involved in seed-speciic regulation; and the CCGTCC-box, which is a cis-acting regulatory element related to meristem speciic activation, as shown in Sup-plemental Table S3. he tissue speciicity of REM genes has
Fig. 5. Schematic diagram of the conserved motifs in 20 wheat remorin (REM) genes. The motifs were identified by Multiple Em for Motif Eluci-dation (MEME) software. Each colored number represents a motif. Yellow box: the remorin C-domain represents Motif number 1 and the remo-rin N-domain represents Motif 2. The other motifs are shown in different colors. The consensus sequences of the motifs identified by MEME and their function identified by the PROSITE and Eukaryotic Linear Motif resource tools are presented in Supplemental Table S2.
22
Table 2. Prediction of cell localization of wheat remorin proteins in comparison with rice and A. thaliana predictions and to the experimental location in A. thaliana.
Gene name
Prediction†
Experimental in A. thaliana‡
Wheat Rice A. thaliana
TaREM1.1_6AL Nuclear OsREM1.1 Nuclear AtREM1.1 Nuclear Cytosol
TaREM1.1_6BL Nuclear
TaREM1.1_6DL Nuclear
TaREM1.2_1AL Cytoplasmic OsREM1.2 Cytoplasmic AtREM1.2 Nuclear Cytosol
TaREM1.2 _1BL Cytoplasmic TaREM1.2_1DL Cytoplasmic
TaREM1.3_5AL Cytoplasmic OsREM1.3 Nuclear AtREM1.3 Cytoplasmic Cytosol
TaREM1.3_4BL Nuclear
TaREM1.3_U Cytoplasmic
TaREM1.4_6AL Nuclear OsREM1.4 Nuclear AtREM1.4 Nuclear Cytosol
TaREM1.4_6BL Nuclear
TaREM1.4_6DL Nuclear
TaREM1.5_2AL Nuclear OsREM1.5 Nuclear AtREM3.2 Nuclear Cytosol
TaREM1.5_2BL Nuclear
TaREM1.5_2DL Cytoplasmic
TaREM0.1_6AL Nuclear OsREM0.1 Nuclear –§ –
TaREM0.1_6BL Nuclear
TaREM0.1_6DL Nuclear
TaREM0.12_6BL Nuclear – – –
TaREM0.12_6DL Nuclear
TaREM0.2_1AS Nuclear OsREM0.2 Nuclear AtREM3.1 Nuclear Cytosol
TaREM0.2_1BS Nuclear AtREM6.6 Nuclear Cytosol
TaREM0.2_1DS Nuclear AtREM6.7 Nuclear Plasma membrane
TaREM0.23_4AS Nuclear – – –
TaREM0.23_4BL Nuclear TaREM0.23_4DS Nuclear
TaREM4.1_2AS Nuclear OsREM4.1 Nuclear AtREM4.1 Nuclear Cytosol
TaREM4.1_2BS Cytoplasmic
TaREM4.1_2DS Nuclear
TaREM4.2_5AL Nuclear OsREM4.2 Nuclear AtREM4.2 Nuclear Cytosol
TaREM4.2_5BL Nuclear
TaREM4.2_5DL Nuclear
TaREM4.3_7AL Nuclear OsREM4.3 Nuclear – –
TaREM4.3_7BL Nuclear
TaREM4.3_7DL Nuclear
TaREM5.1_6AL Nuclear OsREM5.1 Nuclear
OsREM5.2 Nuclear
AtREM5.1 Nuclear Cytosol
TaREM5.1_6BL Nuclear
TaREM5.1_6DL Nuclear
TaREM5.3_5AL Nuclear OsREM5.3 Nuclear AtREM6.4 Nuclear Plasma membrane
TaREM5.3_ 5BL Nuclear
TaREM5.3_5DL Nuclear
TaREM6.1_6AS Nuclear OsREM6.1 Nuclear AtREM6.1 Nuclear Plasma membrane
TaREM6.1_6BS Nuclear
TaREM6.1_6DS Nuclear
TaREM6.2_5AL Nuclear OsREM6.2 Nuclear – –
TaREM6.2_4BL Nuclear
TaREM6.2_4DL Nuclear
TaREM6.3_5AS Nuclear OsREM6.3 Nuclear – –
TaREM6.3_5BS Nuclear
TaREM6.3_5DS Nuclear
Table 2. Continued.
Gene name
Prediction†
Experimental in A. thaliana‡
Wheat Rice A. thaliana
TaREM6.4_2AL Nuclear OsREM6.4 Nuclear AtREM6.3 Nuclear Cytosol
TaREM6.4_2BL Nuclear
TaREM6.4_2DL Nuclear
TaREM6.5_4AL Nuclear OsREM6.5 Nuclear AtREM6.5 Nuclear Cytosol
TaREM6.5_4BS Nuclear
TaREM6.5_4DS Nuclear
TaREM6.6_2AL Nuclear OsREM6.6 Nuclear AtREM6.2 Nuclear Plasma membrane
TaREM6.6_2BL Nuclear
TaREM6.6_2DL Nuclear
† CELLO was used for the localization predictions (http://cello.life.nctu.edu.tw/, accessed 25 Mar. 2019). ‡ Experimental localization of the Arabidopsis remorin C-terminal anchor was done by Konrad et al. (2014). § U, gene is localized in an unknown chromosome; –, gene does not exist in the species.
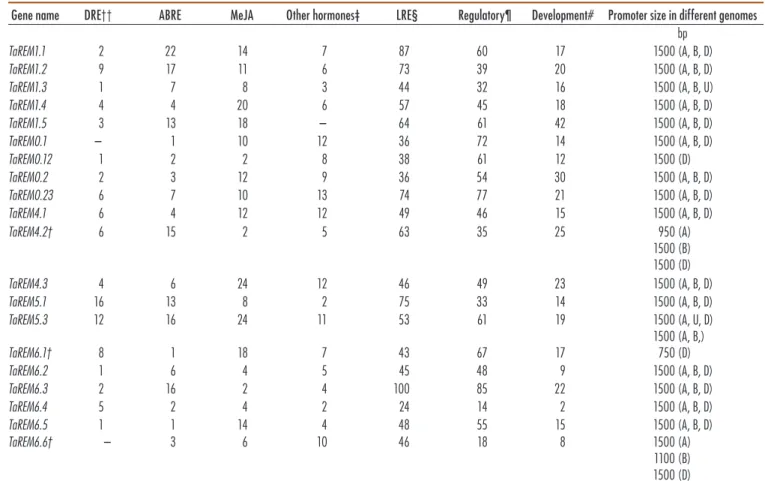
Table 3. In silico promoter analysis of remorin (TaREM) genes from the PlantCARE database program, showing numbers of stress-related cis-elements and regulatory and development cis-elements predicted in the regions 1500 bp upstream of TaREM genes. The cis-motifs identified in
TaREM candidate genes are given in relation to the transcription start site.
Gene name DRE†† ABRE MeJA Other hormones‡ LRE§ Regulatory¶ Development# Promoter size in different genomes bp TaREM1.1 2 22 14 7 87 60 17 1500 (A, B, D) TaREM1.2 9 17 11 6 73 39 20 1500 (A, B, D) TaREM1.3 1 7 8 3 44 32 16 1500 (A, B, U) TaREM1.4 4 4 20 6 57 45 18 1500 (A, B, D) TaREM1.5 3 13 18 – 64 61 42 1500 (A, B, D) TaREM0.1 – 1 10 12 36 72 14 1500 (A, B, D) TaREM0.12 1 2 2 8 38 61 12 1500 (D) TaREM0.2 2 3 12 9 36 54 30 1500 (A, B, D) TaREM0.23 6 7 10 13 74 77 21 1500 (A, B, D) TaREM4.1 6 4 12 12 49 46 15 1500 (A, B, D) TaREM4.2† 6 15 2 5 63 35 25 950 (A) 1500 (B) 1500 (D) TaREM4.3 4 6 24 12 46 49 23 1500 (A, B, D) TaREM5.1 16 13 8 2 75 33 14 1500 (A, B, D) TaREM5.3 12 16 24 11 53 61 19 1500 (A, U, D) TaREM6.1† 8 1 18 7 43 67 17 1500 (A, B,) 750 (D) TaREM6.2 1 6 4 5 45 48 9 1500 (A, B, D) TaREM6.3 2 16 2 4 100 85 22 1500 (A, B, D) TaREM6.4 5 2 4 2 24 14 2 1500 (A, B, D) TaREM6.5 1 1 14 4 48 55 15 1500 (A, B, D) TaREM6.6† – 3 6 10 46 18 8 1500 (A) 1100 (B) 1500 (D)
† Sequences less than 1500 bp were used for Copy A of TaREM4.2, Copy D of TaREM6.1, and Copy B for TaREM6.6 promoter sequences because these were less than 1500 bp. ‡ Other hormone-responsive elements include salicylic acid, gibberellin, ethylene, and auxin.
§ This includes 45 different light-responsive elements (LREs) like G-box, ACE, GAG, Box 4, Sp1, BoxI, Box II, Box III, the CAG motif, etc. For more information on LRE regulatory and development elements, see Supplemental Table S3.
¶ Regulatory elements include the AT-rich element, CAAT box, 3-AF3 binding site, 5UT Py-rich stretch, A-box and OBP-site. # Development elements include AC-I, AC-II, and H-Box.
22
been reported in many tissue localization studies (Li et al., 2013, Bariola et al., 2004; Yue et al., 2014; Kong et al., 2016). he presence of the tissue-speciic element in TaREM gene promoters reveals their potential role in plant devel-opment. Furthermore, putative TaREM promoters have diferent types of stress-responsive regulatory elements (abiotic and biotic), including LTRs, which is a cis-acting element involved in low-temperature responsiveness; ARE, which is a cis-acting regulatory element essential for anaerobic induction; HSE, which is a cis-acting ele-ment involved in heat stress responsiveness; MBS, which is a MYB binding site involved in drought-inducibility; TC-rich repeats, which are cis-acting elements involved in defense and stress responsiveness; and Box-W1, a fungal elicitor responsive element (Supplemental Table S3). Tis-sue-speciic and stress-related cis-elements in the promot-ers may be responsible for multiple functions of TaREMs through complex regulatory mechanisms.
In Silico Expression Profile of TaREM Genes in the Crowns of Two Wheat Genotypes Grown Under Autumn Field Conditions
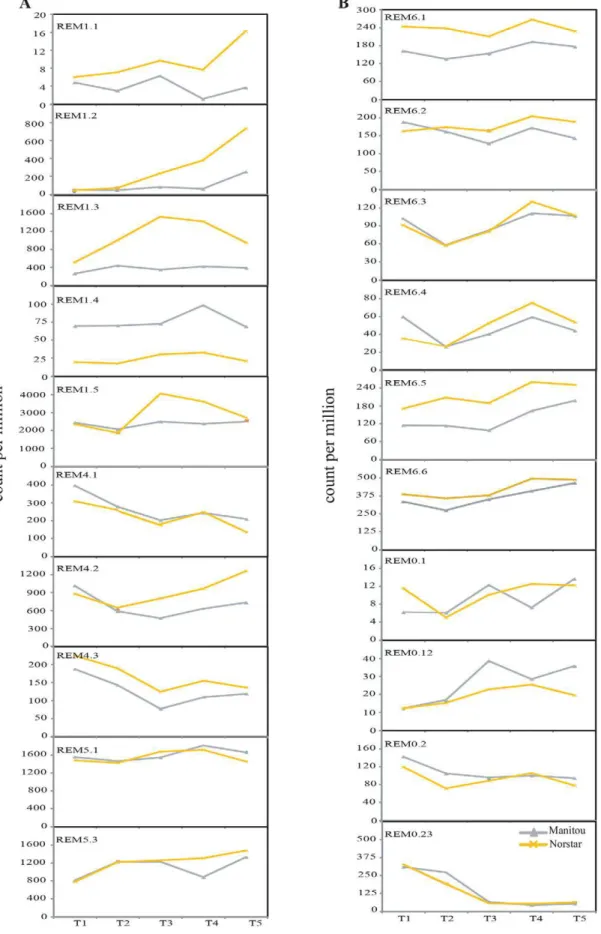
To understand the function of TaREM genes in response to cold acclimation and vernalization, we analyzed the transcriptome of developing crowns from ive time points for two genotypes grown under ield conditions from early autumn to winter in 2010 at Saskatoon, SK, Canada. he winter (Norstar) and spring (Manitou) wheat geno-types difered in vernalization requirements and freezing tolerance potential (Limin and Fowler, 2002; Li et al., 2018). he transcript abundance of 20 TaREM genes was determined from the RNA-Seq data as reads per million (Fig. 6A, B). Digital gene expression analysis revealed that wheat REM genes varied in their expression depend-ing on the genotype and on the exposure time to cold. TaREM genes were divided into three clusters on the basis of their regulation in response to cold: upregulated, downregulated, or constitutively expressed. he upregu-lated REM genes included the highly induced TaREM1.2 (30-fold) and the moderately induced TaREM1.3 (4-fold) and TaREM1.1 (2.5-fold). hese genes have the putative C-repeat (CRT)/dehydration-responsive element (DRE) or low-temperature-responsive elements in their promoter regions (Table 3). Interestingly, their expression was higher in the cold-tolerant Norstar than the less toler-ant Manitou, indicating their possible association with freezing tolerance and vernalization in the crown tissue. TaREM0.12 showed an inverse association in the less tolerant spring wheat Manitou. he downregulated REM genes included 10-fold repression of TaREM0.23 and two-fold repression of TaREM4.1 and TaREM4.3. he other REM genes did not reveal any up- or down regulation of more than twofold and were considered to be constitu-tively expressed. Another interesting observation was that some genes were expressed in the cold-tolerant Norstar at a higher level across all time points analyzed. Norstar had higher expression of TaREM1.1, TaREM1.3, TaREM4.3, TaREM6.1, TaREM6.5, and TaREM6.6, whereas the less
tolerant Manitou showed higher expression of TaREM1.4. he expression of these genes relects the genetic back-ground and could be considered positively or negatively associated with freezing tolerance and vernalization in the crown tissue. he expression levels of all the TaREM genes were also examined in the publicly available data of spring wheat transcriptomics from multiple RNA-Seq experiments with diferent tissues and abiotic or biotic stress conditions (Hruz et al., 2008). Unfortunately, there are no public data available for winter wheat for com-parison. he Genevestigator ID corresponding to the TaREM genes is shown in Supplemental Table S4. he RNA-Seq data in Supplemental Fig. S2 showed that some TaREM genes (TaREM4.1, TaREM 4.2, and TaREM 4.3) are responsive to cold treatment (Hruz et al., 2008), but others were not. As reported in many species, the REMs identiied in this study are also responsive to drought and heat treatment (Supplemental Fig.S2). hey were also expressed in diferent tissues and developmental stages (Supplemental Fig. S3A, B). his suggests that REM genes have diverse functions during abiotic stresses.
Expression Profiles of TaREM Genes During Cold Acclimation in a Controlled Environment
Quantitative Real-Time PCR was used to determine the expression levels of 20 TaREM genes in the aerial tissues of Norstar and Manitou and to compare the RNA-Seq data from the ield experiment with those of the con-trolled environment. he REM genes were classiied into three groups according to their expression patterns: upregulated, downregulated, or constitutively expressed (Fig. 7A, B). he irst group represents the genes that were upregulated in response to cold acclimation and corre-spond to TaREM1.1, TaREM1.2, TaREM4.1, TaREM4.2, TaREM4.3, TaREM6.3, TaREM6.4, TaREM0.1,
TaREM0.12, and TaREM0.23. Interestingly, all of the Group 4 remorins were strongly induced by cold. he highest increase in expression (sevenfold) was found in TaREM4.3, followed by TaREM4.2 (4.5-fold), ater 56 d of cold treatment, suggesting an association with late cold response. In contrast, expression of the other eight TaREMs peaked ater 7 d of cold treatment and then decreased toward the end of the treatment, suggesting an association with early responses to cold. he second group represents the downregulated genes and con-tained two genes from Group 1 (TaREM1.3 and TaREM 1.4) that were also associated with cold response. he third group contained eight constitutively expressed genes (TaREM0.2, TaREM1.5, TaREM5.1, TaREM5.3, TaREM6.1, TaREM6.2, TaREM6.5, and TaREM6.6) that were not signiicantly responsive to cold (Fig. 7A, B).
Regulation of REM genes under abiotic stress has been reported in several species. In mulberry, MiREM was the irst reported remorin gene involved in abiotic stress. he heterologous expression of MiREM in Arabidopsis improved drought and salinity tolerance during the germination and seedling stages (Checker and Khurana, 2013). In another study, SiREM6 from
Fig. 6. Digital gene expression profiles of remorin (TaREM) genes based on the transcriptome data from the field study of 2010. The expression profiles of 20 REMs, representing the combined counts of the three homeologous copies, were deduced from the Illumina RNA-Seq data of the winter wheat genotype Norstar and the spring wheat genotype Manitou sampled from early autumn to winter. (A) Genes in phylogenetic Groups 1, 4, and 5; (B) genes in phylogenetic Groups 6, 0.1, and 0.2. The y-axis represents counts per million REM genes. The gene expres-sion in this experiment represents the three copies combined; the means between the two biological replicates are presented. T1, T2, T3, T4, and T5 represent the five time points during autumn cold acclimation of crowns.
22
Fig. 7. Expression profiles of remorin (TaREM) genes in aerial tissues of winter (Norstar) and spring (Manitou) wheat during cold acclimation under experimental conditions via quantitative polymerase chain reaction (qPCR). Expression of REM genes was compared via qPCR between the control (CTR) and cold-acclimated (CA) plants after 22 h and 7, 21, 35, and 56 d, respectively. (A) Genes in phylogenetic Groups 1, 4, and 5; (B) genes in phylogenetic Groups 6, 0.1, and 0.2. The y-axis represents the relative expression levels of REM genes compared with
18S. Bars represent the mean values of two biological and technical replicates ± SD. The different lower-case letters represent statistically
foxtail millet increased by 5.2-fold under high salinity, fourfold in response to low temperatures, and 9.1-fold in resonse to ABA treatment. Overexpression of SiREM6 in A. thaliana enhanced tolerance to high salt stress during seed germination and seedling development stages (Yue et al., 2014). his gene has homology with TaREM1.5, which increased in expression by almost twofold ater 7 d of cold treatment (Fig. 7A). In a previous study, it was shown that several REMs in Group 1 respond to abiotic stress and ABA treatment (Checker and Khurana, 2013). Interestingly, most TaREMs contain the CRT/ DRE element in their promoter (Table 2), suggesting that TaREMs can be regulated by DRE-binding or CBF transcription factors in wheat. Byun et al. (2015) showed that DaCBF7 binds to the upstream region of an endogenous REM, which has a putative CRT/DRE. he overexpression of DaCBF7 in rice enhanced tolerance to cold stress through the upregulation of dehydrin, remorin, and several unknown or hypothetical genes (Os03g63870, Os11g34790, and Os10g22630). Moreover, all the induced TaREM genes were expressed to a signiicantly higher level in the winter cultivar in at least one time point compared with the spring cultivar suggesting their potential implication in freezing tolerance and a possible association with phenological development. However, additional work is needed to conirm their role. he pattern of gene expression revealed by quantitative PCR in aerial wheat tissues was like that detected in the crowns with the RNA-Seq data for some REM genes such as TaREM0.12, TaREM1.1, and TaREM1.2 (upregulated) and TaREM1.5, TaREM5.1, TaREM5.3, TaREM6.1, TaREM6.2, TaREM6.5, and TaREM6.6 (constitutively expressed). Interestingly, TaREM0.12 and TaREM1.1 are located on chromosome 6, which is known to harbor the most COR genes (Li et al., 2018). hese results support the possible role of TaREM0.12, TaREM1.1, and TaREM1.2 in a more generalized cold response. he diferences observed in other REM expression proiles between both studies could result from the type of tissues used (crowns vs. aerial tissues) and the diferent experimental conditions (ield conditions vs. controlled conditions). Several transcriptional studies of cold acclimation in wheat have shown that changes observed under controlled environments can be diferent from those in ield studies (Campoli et al., 2009; Greenup et al., 2011; Laudencia-Chingcuanco et al., 2011; Wang et al., 2014), as plants grown under ield conditions are exposed to more variable factors than those grown under controlled conditions.
Remorin Regulation under Hormone Treatment
Plant hormones, such as ABA and MeJA, are involved in regulating several biotic and abiotic processes (Mittler and Blumwald, 2015; Wasternack and Parthier, 1997). Most TaREM genes considered in this study were downregulated in response to ABA treatment (Fig. 8A, B). hirteen out of the 20 TaREM genes were repressed to diferent degrees, whereas the remaining genes showed no change (TaREM4.3 and TaREM6.4) or were upregulated (TaREM1.1,
TaREM1.2, TaREM1.5, TaREM4.2, and TaREM0.23) under ABA treatment (Fig. 8A, B). he upregulated genes TaREM1.2 and TaREM1.5 exhibited a high level of tran-script abundance, with 15- and 3.5-fold increases, respec-tively. he REM genes from Groups 5 and 6 (TaREM5.1, TaREM5.3, TaREM6.1, TaREM 6.5, and TaREM6.6) were highly repressed by 50- to 400-fold. he other genes (TaREM0.1, TaREM0.12, TaREM0.2, TaREM1.3, TaREM1.4, TaREM4.1, TaREM6.2, and TaREM6.3) were moderately repressed (2- to 21-fold changes) ater ABA treatment (Fig. 8A, B). hese results indicate that 16 TaREM genes responded in an ABA-dependent manner and may play a role in ABA signaling. REM was also upregulated in response to exogenous ABA in rice, suggesting that REM is involved in the ABA signal transduction pathway (Lin et al., 2002). In A. thaliana, REMs are induced through the binding of transcription factors to speciic cis-elements in both the ABA-dependent and ABA-independent path-ways (Rafaele et al., 2007). hese results demonstrate that TaREM1.1 and TaREM1.2 are responsive to cold as well as to exogenous ABA treatment. In contrast, TaREM0.23 and TaREM4.3 are regulated in response to cold exposure but not to ABA treatment, suggesting that ABA-dependent and independent pathways may regulate REM expression in response to cold acclimation.
In addition to ABA, REM genes are regulated in response to several hormones including SA, MeJA, and brassinosteroid (Gui et al., 2016; Kong et al., 2016). Recently, Kong et al. (2016) showed that StREMa4 expression levels were regulated by SA, MeJA, and ABA, indicating that StREMa4, and perhaps other REMs, are part of a complex regulatory network afecting plant host interactions with pathogens. his gene has the strongest homology with wheat REM genes from Group 1. he OsREM4.1 gene was induced by an ABA signal through the transcriptional activator OsbZIP23 and plays a role in modulating brassinosteroid signaling (Gui et al., 2016). Jasmonate positively regulates plant responses to freezing stress through a critical upstream signal of the inducer of CBF expression-CBF/ DRE-binding pathway to regulate freezing tolerance in A. thaliana (Hu et al., 2013). In our study, MeJA treatment induced the expression of TaREM1.2, TaREM1.5, TaREM4.2, and TaREM0.23 genes (Fig. 8A, B). he expression of TaREM1.1, TaREM1.4, TaREM4.3, and TaREM6.4 showed no signiicant changes ater MeJA treatment (Fig. 8A, B). As in the ABA treatment, the expression of TaREM5.1, TaREM5.3, TaREM6.1, TaREM6.5, and TaREM6.6 was severely repressed (55- to 111-fold changes). TaREM0.1, TaREM0.12, TaREM0.2, TaREM1.3, TaREM4.1, TaREM6.2, and TaREM6.3 were moderately repressed in response to MeJA treatment (Fig. 8A, B). hese results suggest that the 16 diferentially expressed genes may play a role in jasmonic acid signaling. All REM genes identiied in A. thaliana were mostly involved in hormone and biotic or abiotic stress responses (Rafaele et al., 2007). Accumulation of REM in plants has oten been associated with defense signaling molecules (Wu et
22
Fig. 8. Expression profiles of remorin (TaREM) genes in winter wheat (Norstar) in response to methyl jasmonate (MeJA) and ABA treatment via quantitative polymerase chain reaction. Expression of REM genes was compared between control (CTR) and plants treated with MeJA and ABA after 4 and 24 h. (A) Genes in phylogenetic Groups 1, 4, and 5; (B) genes in phylogenetic Groups 6, 0.1, and 0.2. The y-axis represents the relative expression levels of remorin genes compared with 18S. Bars represent the mean values of two biological and technical replicates ± SD. The different lower-case letters represent statistically significant differences between samples (P < 0.05 by Tukey’s test).
al., 2006; Anderson et al., 2004; Chen and Charles-An, 2006). Interestingly, in our study, the quantitative PCR expression analyses revealed that the transcripts of TaREM1.2 and TaREM4.2 accumulated on exposure to low temperature, ABA, and MeJA. his suggests that both ABA and MeJA may mediate their expression during cold acclimation.
TaREM Gene Expression in Different Tissues
Expression of REM genes is known to be tissue-dependent (Rafaele et al., 2007). herefore, to gain insight into the tissue preference of TaREMs during cold acclimation in wheat, we examined the expression proiles of all REM genes in four organs (leaves, stems, crowns, and roots) by qRT-PCR. All 20 TaREM genes were expressed in the tested tissues; the expression patterns revealed spatial variation in the expression of TaREM genes in diferent organs (Fig. 9A, B). Some TaREMs are expressed prefer-entially in a speciic tissue and this includes TaREM1.2 in leaves, TaREM6.3 in stems, and TaREM1.1, TaREM1.3, TaREM1.4, TaREM4.2, TaREM4.3, and TaREM0.23 in roots. TaREM gene expression was markedly less in leaves during cold acclimation. Seven TaREM genes (TaREM5.1, TaREM5.3, TaREM6.1, TaREM6.2, TaREM6.5, TaREM6.6, and TaREM0.1) displayed signiicantly lower expression in leaves; otherwise, they did not express a pronounced preference in any other tissue. TaREM genes showed diferential expression in various tissues, as reported in other plants (Rafaele et al., 2007; Yue et al., 2014). he expression of six TaREMs was positively associated with preferential root expression but seven TaREMs showed a substantial loss of expression in leaves during cold accli-mation. he higher expression level in roots indicates a possible role in root development during cold stress or may relect the higher susceptibility of underground tissues to biotic stress under these conditions. he lower expression of TaREMs in leaves may stem from the reduced growth or developmental activity of the mature leaf tissue compared with stems or crowns in cereals. In tomato, foxtail millet, and A. thaliana (Group 1b genes), several members of the REM family were expressed in the vascular system (Bari-ola et al., 2004; Yue et al., 2014). In foxtail millet seedlings, SiREM6 was expressed in diferent tissues (roots, stems, leaves, and inlorescences) in the early stage of vascular development (Yue et al., 2014). In P. deltoides, PdREM was expressed in diferent tissues like leaf buds, and immature and mature phloem, indicating the possible function of PdREM in stem development and phloem formation (Li et al., 2013). In rice, the REM gene GSD1 was localized at the plasma membrane and plasmodesmata of phloem companion cells and afected grain set by regulating the transport of photoassimilates (Gui et al., 2015). According to the analysis of putative TaREM promoters, the TaREM gene family harbors diferent numbers and types of cis-ele-ments involved in responses to abiotic and biotic stresses, low temperatures, ABA, and MeJA. Additionally, TaREM genes showed tissue-speciic responses during cold accli-mation. Together, these observations help to explain
the complex response of TaREMs to abiotic stresses and hormonal treatments. hese results indicate that TaREM genes have several functional roles in response to hormone and cold treatment.
CONCLUSIONS
In this study, we evaluated the potential functional importance of REM gene family members in wheat. Twenty nonredundant REM genes were identiied and phylogenetically clustered into six distinct subfamilies. Phylogenetic analysis showed that TaREMs and other monocot REMs (rice) are homologous, suggesting a prob-able functional similarity among them. Analysis of intron length, position, and splicing suggested that introns were highly conserved within the same subfamily. he response of wheat REM genes to low temperatures, ABA, and MeJA indicated that the action of several genes was speciic to low temperatures, whereas others responded to low temperatures, ABA, and MeJA. his suggests that some genes are regulated by cold through hormonal sig-naling pathways. Cis-element analyses of putative REM promoters revealed the presence of cis-motifs speciic to cold response, other abiotic stresses, hormone regulation, tissue speciicity, and development, indicating that the expression of the REM genes was modulated, in part, by the regulatory elements in their promoters. he expres-sion proiles of the 20 wheat REM genes in leaves, stems, crowns, and roots showed that they were expressed in all tissues, with higher expression in roots. Compari-sons between autumn ield and controlled environments showed common expression for some TaREM genes but not in others. he contradictions between the two experi-ments may be caused by the type of tissues used and the diferent experimental conditions. he expression of REM genes at diferent wheat developmental stages and in dif-ferent tissues and their association with cold acclimation and hormonal responses suggest a potential role during wheat development. Understanding the function of each gene during the wheat life cycle may help us to select for varieties that tolerate higher biotic and abiotic stresses.
Supplemental Information
Supplemental File S1. he remorin sequences used in the present study.
Supplemental Table S1. Wheat, rice, and A. thaliana intron–exon number.
Supplemental Table S2. Identiicaton of consensus sequence of TaREM by MEME and their function by Prosite and Eukaryotic Linear Motif resource sotware.
Supplemental Table S3. he cis-acting regulatory DNA elements of 20 TaREM promoters.
Supplemental Table S4. Remorin Genevestigator ID. Supplemental Table S5. he primers sequences used in the present study for qRT-PCR.
Supplemental Fig. S1. Phylogenetic relationships among T. aestivum remorin proteins (from three genomes: A, B, and D).
22
Fig. 9. Expression profiles analysis of remorin (TaREM) genes in different tissues of winter wheat (Norstar) during cold acclimation using quantitative polymerase chain reaction. The relative expression of REM genes was compared among roots, crowns, stems, and leaves from plants after 1 and 8 d of cold acclimation (1dCA, 8dCA). (A) Genes in phylogenetic Groups 1, 4, and 5; (B) genes in phylogenetic groups 6, 0.1, and 0.2. The
y-axis represents the relative expression levels of REM genes compared with 18S. Bars represent the mean values of two biological and technical