HAL Id: hal-01787872
https://hal.archives-ouvertes.fr/hal-01787872
Submitted on 7 May 2018
HAL is a multi-disciplinary open access
archive for the deposit and dissemination of
sci-entific research documents, whether they are
pub-lished or not. The documents may come from
teaching and research institutions in France or
abroad, or from public or private research centers.
L’archive ouverte pluridisciplinaire HAL, est
destinée au dépôt et à la diffusion de documents
scientifiques de niveau recherche, publiés ou non,
émanant des établissements d’enseignement et de
recherche français ou étrangers, des laboratoires
publics ou privés.
David Birnbaum, Pascal Finetti, Alexia Lopresti, Marine Gilabert, Flora
Poizat, Jean-Luc Raoul, Jean-Robert Delpero, Vincent Moutardier, Daniel
Birnbaum, Emilie Mamessier, et al.
To cite this version:
David Birnbaum, Pascal Finetti, Alexia Lopresti, Marine Gilabert, Flora Poizat, et al.. A 25-gene
classifier predicts overall survival in resectable pancreatic cancer. BMC Medicine, BioMed Central,
2017, 15 (1), �10.1186/s12916-017-0936-z�. �hal-01787872�
R E S E A R C H A R T I C L E
Open Access
A 25-gene classifier predicts overall survival
in resectable pancreatic cancer
David J. Birnbaum
1,2,3, Pascal Finetti
1, Alexia Lopresti
1, Marine Gilabert
4, Flora Poizat
5, Jean-Luc Raoul
4,
Jean-Robert Delpero
3,6, Vincent Moutardier
2,3, Daniel Birnbaum
1, Emilie Mamessier
1†and François Bertucci
1,3,4,7*†Abstract
Background: Pancreatic carcinoma is one of the most lethal human cancers. In patients with resectable tumors, surgery followed by adjuvant chemotherapy is the only curative treatment. However, the 5-year survival is 20%. Because of a strong metastatic propensity, neoadjuvant chemotherapy is being tested in randomized clinical trials. In this context, improving the selection of patients for immediate surgery or neoadjuvant chemotherapy is crucial, and high-throughput molecular analyses may help; the present study aims to address this.
Methods: Clinicopathological and gene expression data of 695 pancreatic carcinoma samples were collected from nine datasets and supervised analysis was applied to search for a gene expression signature predictive for overall survival (OS) in the 601 informative operated patients. The signature was identified in a learning set of patients and tested for its robustness in a large independent validation set.
Results: Supervised analysis identified 1400 genes differentially expressed between two selected patient groups in the learning set, namely 17 long-term survivors (LTS;≥ 36 months after surgery) and 22 short-term survivors (STS; dead of disease between 2 and 6 months after surgery). From these, a 25-gene prognostic classifier was developed, which identified two classes (“STS-like” and “LTS-like”) in the independent validation set (n = 562), with a 25% (95% CI 18–33) and 48% (95% CI 42–54) 2-year OS (P = 4.33 × 10⁻⁹), respectively. Importantly, the prognostic value of this classifier was independent from both clinicopathological prognostic features and molecular subtypes in multivariate analysis, and existed in each of the nine datasets separately. The generation of 100,000 random gene signatures by a resampling scheme showed the non-random nature of our prognostic classifier.
Conclusion: This study, the largest prognostic study of gene expression profiles in pancreatic carcinoma, reports a 25-gene signature associated with post-operative OS independently of classical factors and molecular subtypes. This classifier may help select patients with resectable disease for either immediate surgery (the LTS-like class) or
neoadjuvant chemotherapy (the STS-like class). Its assessment in the current prospective trials of adjuvant and neoadjuvant chemotherapy trials is warranted, as well as the functional analysis of the classifier genes, which may provide new therapeutic targets.
Keywords: Expression profiling, Pancreatic cancer, Prognosis, Survival
* Correspondence:bertuccif@ipc.unicancer.fr
†Equal contributors 1
Département d’Oncologie Moléculaire, Centre de Recherche en Cancérologie de Marseille, Inserm UMR1068, CNRS UMR725, Aix-Marseille Université, Marseille, France
3Faculté de Médecine, Aix-Marseille Université, Marseille, France
Full list of author information is available at the end of the article
© The Author(s). 2017 Open Access This article is distributed under the terms of the Creative Commons Attribution 4.0 International License (http://creativecommons.org/licenses/by/4.0/), which permits unrestricted use, distribution, and reproduction in any medium, provided you give appropriate credit to the original author(s) and the source, provide a link to the Creative Commons license, and indicate if changes were made. The Creative Commons Public Domain Dedication waiver (http://creativecommons.org/publicdomain/zero/1.0/) applies to the data made available in this article, unless otherwise stated.
Background
With a mortality rate close to the incidence rate (331,000 deaths worldwide for 338,000 new cases in 2012 [1]), pancreatic carcinoma is one of the most lethal human cancers. Advances in systemic chemotherapy and radiotherapy provided limited improvement in survival, and the 5-year overall survival (OS) remains close to 5%. Only 50% of newly diagnosed patients have a non-metastatic disease with either a resectable or borderline resectable tumor (20%) or an unresectable locally-advanced tumor (30%) [2]. In patients with a resectable tumor, complete surgical removal followed by adjuvant chemotherapy is the only curative treatment. However, most of the patients display distant relapse; the median OS remains 23 months on average, and the 5-year survival is 20%. The mortality of surgery has decreased during the last 30 years, but its morbidity remains at approximately 50% [3].
The high rates of patients with stage IV and experien-cing distant relapses after surgery in non-metastatic stages along with preclinical data suggest that metastatic spread may precede local tumor formation [4]. This has led to the emerging consensus that pancreatic cancer is a systemic disease already at diagnosis. More effective systemic therapies should confer an increased likelihood of cure after resection. Neoadjuvant chemotherapy, standardly used for borderline resectable and unresect-able locally advanced diseases [2], is being tested in resectable tumors with several objectives [5], including early treatment of occult micrometastases, avoidance of unnecessary and morbid resection for rapidly metasta-sizing tumors, improvement of the likelihood of margin-negative resection, and better chemotherapy delivery than in adjuvant settings when surgical complications may delay or worsen chemotherapy tolerability. Other advantages include the ability to assess tumor response and to search for biological predictors for pathological response, which is associated with survival [6, 7]. Neoadjuvant chemotherapy provided interesting results in resectable pancreatic cancer in a few institutional prospective phase II studies [8–10], and randomized phase II/III studies are ongoing [2]. How-ever, this approach faces potential hurdles such as a possible missed opportunity for curative surgery and the absence of surgical staging. In this context, improving our ability to select patients for either immediate surgery or neoadjuvant chemotherapy is crucial, and represents an area of high need and intense research [2].
The current prognostic factors are clinicopathological, notably based on the American Joint Committee on Cancer (AJCC) tumor, node and metastasis staging, and the criteria used for immediate surgery are technical (mainly based on the vascular involvement assessment), clinical (e.g., based on performance status), and biological (e.g., based on CA19-9 value). However, the criteria’s
ability to consistently predict a patient’s outcome is lim-ited, with substantial heterogeneity within the so-defined prognostic classes [11]. Actually, no prognostic or predict-ive biomarker has yet been established for pancreatic cancer. High-throughput molecular analyses revealed the extensive heterogeneity of cancers, and notably pancreatic cancer. Key molecular alterations have been identified, such as KRAS, TP53, SMAD4, CDKN2A, and ARID1A mutations and GATA6 amplification [12, 13], but they re-main without clinical application to date. Several studies of gene expression profiling have also been reported [14], mainly focused on the comparison of cancer versus nor-mal pancreatic tissues. A few prognostic gene expression signatures have been developed [15–24], in general from small sample series and without validation in independent sets, or with validation in limited tumor sets. Biologic-ally relevant molecular subtypes have been identified [16, 25, 26], and associated with OS [27]. However, identifying molecular predictors to aid in patient care remains necessary.
Here, we collected data of 695 pancreatic carcinoma samples from gene expression datasets, and searched for a gene expression signature predictive for post-operative OS.
Methods
Gene expression datasets
We retrospectively collected clinicopathological and gene ex-pression data of clinical pancreatic carcinoma samples from nine publicly available datasets [15, 16, 20, 21, 23, 25, 28–30] from the National Center for Biotechnology Informa-tion/Genbank Gene Expression Omnibus, ArrayEx-press, European Genome-phenome Archive, and The Cancer Genome Atlas (TCGA) databases (Additional file 1: Table S1). Samples had been profiled using whole-genome DNA microarrays (Affymetrix or Agilent) and RNA-Seq (Illumina). The complete dataset contained 695 samples, including 601 operated primary cancer samples with available survival data. The study was approved by our institutional board.
Gene expression data analysis
Data analysis required pre-analytic processing. First, we normalized each DNA microarray-based dataset separ-ately, by using quantile normalization for the available processed Agilent data, and Robust Multichip Average [31] with the non-parametric quantile algorithm for the raw Affymetrix data. Normalization was performed in R using Bioconductor and associated packages. Then, we mapped hybridization probes across the different techno-logical platforms. We used SOURCE [32] and NCBI EntrezGene [33] to retrieve and update the Agilent anno-tations, and NetAffx Annotation files [34] for the Affyme-trix annotations. The probes were then mapped according to their EntrezGeneID. When multiple probes represented
the same GeneID, we retained the one with the highest variance in a particular dataset. For the TCGA, Bailey’s and Kirby’s data, we used the available normalized RNA-Seq data that we log2-transformed.
We defined the molecular subtypes of all pancreatic cancer samples in each dataset separately as defined in the original publications, i.e., the three Collisson’s subtypes [16] were classical, quasi-mesenchymal, and exocrine-like, the two Moffitt’s epithelial subtypes [26] were basal-like and classical, and the four Bailey’s subtypes [25] were squamous, pancreatic progenitor, immunogenic, and aberrantly differentiated endocrine exocrine (ADEX). To identify a prognostic expression signature, we applied a supervised analysis using learning and validation sets. The learning set was a subset (n = 39) of the Bailey’s and TCGA RNA-Seq datasets that included samples from pa-tients with survival of at least 36 months after surgery (long-term survivors (LTS); n = 17) and from patients dead of disease between 2 and 6 months after surgery (short-term survivors (STS); n = 22). The 562 other samples with available survival data from the other datasets were gath-ered and used as an independent validation set. Samples of the learning set were pooled before supervised analysis by using COMBAT (empirical Bayes), included in the inSilicoMerging R/Bioconductor package, as a batch effects removal method. The final merged set included 15,291 genes in log2-transformed data. The accuracy of normalization was controlled by principal component analysis (Additional file 2: Figure S1). The supervised analysis compared the expression profiles of 15,291 genes between the 22 STS samples and the 17 LTS samples using a moderated t-test with empirical Bayes statistic included in the Limma R packages. False discovery rate was applied to correct for the multiple testing hypothesis and significant genes were defined by the following thresholds: P < 5%, false discovery rate < 25%, and fold change superior to |2x|. Ontology analysis of the resulting 1400-gene list was based on the gene ontology (GO) biological processes of the Database for Annotation, Visualization and Integrated Discovery (DAVID) [35]. We then developed a prognostic classifier while minimizing the number of retained genes. Starting from the resulting 1400-gene list, we used logistic regression analysis with Least Absolute Shrinkage and Selection Operator [36] (LASSO), which is a selection method that handles high-dimensional regression variables with no prior feature se-lection step by shrinking all regression coefficients toward zero, and thus forcing many regression variables to be exactly zero. The penalty regularization parameterλ was chosen via the cross-validation routine cv.glmnet before running the main algorithm implemented in the R pack-age glmnet version 1.9-8, with an n-fold equal to 10. Theλ value was finalized by using the lambda.min, which is the value of lambda giving minimum mean cross-validated
error (lambda.min was 0.0153). The resulting classifier allowed the definition of two classes of samples, namely the predicted STS-like class and the predicted LTS-like class. Its robustness was assessed in the independent validation set (n = 562) by classifying each sample in each dataset separately as STS-like or LTS-like. Since a few studies have indicated that many gene signatures were random noise signatures [37, 38], we evaluated whether our prognostic 25-gene signature was not inferior to ran-dom signatures. A resampling scheme was used to gener-ate 100,000 random 25-gene signatures within the 1400 genes differentially expressed identified by supervised ana-lysis in the learning set. Each random signature was then applied to the validation set to determine its significance level in prognostic terms for OS. We then measured the proportion of random signatures with a P value inferior to the P value from our 25-gene signature.
Statistical analysis
Associations between tumor groups and clinicopatholog-ical features were analyzed using the t-test or the Fisher’s exact test when appropriate. Overall survival (OS) was calculated from the date of diagnosis to the date of death from pancreatic cancer. Follow-up was measured from the date of diagnosis to the date of last news for living patients. Survivals were calculated using the Kaplan– Meier method and were compared with the log-rank test. Uni- and multivariate survival analyses were performed using Cox regression analysis (Wald test). Variables tested in univariate analyses included patient age at time of diagnosis (>60 vs.≤ 60 years), sex (male vs. female), AJCC clinical stage (2, 3, and 4 vs. 1), pathological features including pathological type (others vs. ductal), tumor size (pT2, T3, and pT4 vs. T1), lymph node status (positive vs. negative), grade (2, 3, and 4 vs. 1), our 25-gene classification (STS-like vs. LTS-like), and the different mo-lecular subtype classifications. Variables with a P value lower than 0.05 were tested in multivariate analysis. All statistical tests were two-sided at the 5% level of signifi-cance. Statistical analysis was performed using the survival package (version 2.30) in the R software (version 2.15.2) [39]. We followed the reporting REcommendations for tumor MARKer prognostic studies (REMARK criteria) [40]. A Sweave report describing the analysis of gene expression data and the associated statistical analysis is available as Additional file 3 (Supplementary Text).
Results
Patient population
We collected nine retrospective/prospective public
whole-genome mRNA expression datasets of 695
pancreatic samples, and focused our analysis on the 601 cancer samples from patients operated from the outset and with available survival. As shown in Table 1, the
majority of patients were aged 60 years or older, and 54% were male. Most cases (96%) were AJCC stage 1 or 2, ductal type (98%), and grade 2 (55%). All but one case had been treated by front-line surgery, and the majority of tumors were pT2 (16%) or pT3 (77%), and pN-positive (69%). All Bailey’s, Moffitt’s, and Collison’s molecular sub-types were represented. A total of 354 patients died. The median OS was 20 months (range, 1–156), and the 2-year OS was 40% (95% CI 36–45).
Identification of a prognostic expression signature We searched for a gene signature associated with OS. Supervised analysis was performed in a learning set of 39 samples selected to represent the two opposite groups of patients, including 17 LTS and 22 STS. Analysis identified 1400 genes differentially expressed between the two groups (Additional file 4: Table S2). All associated GO biological processes are shown in Additional file 5: Table S3, and the top 40 processes are shown in Table 2. The robustness of those genes was tested by testing their ability to classify the LTS and STS samples from the other independent datasets. Out of the 67 samples classified, 49 (76%) were accurately classi-fied, suggesting strong robustness (P = 7.68 × 10⁻⁵, Fisher’s exact test).
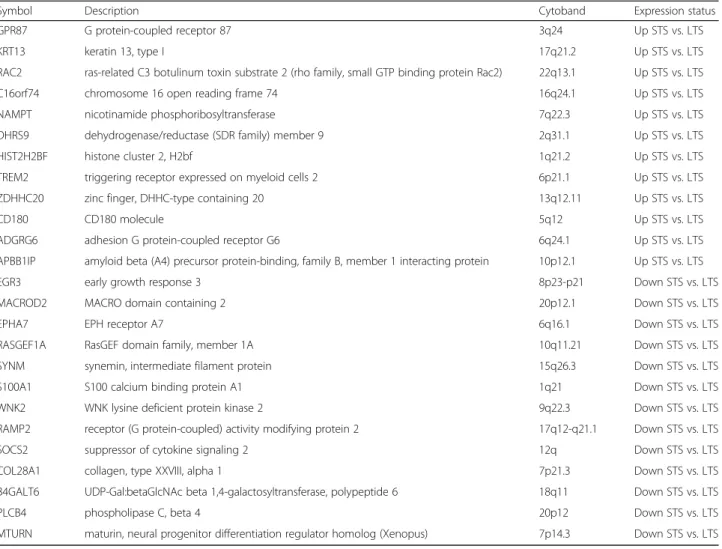
To render this signature more easily applicable in clinics, we built a multigene classifier from the 1400-gene list. Logistic regression analysis retained 25 1400-genes (Table 3), including 12 and 13 genes respectively upregu-lated and downreguupregu-lated in the STS samples. As expected, the classifier based on these 25 genes sorted with 100% accuracy those 39 patients into two classes, with STS-like including all STS patients and LTS-like including all LTS patients.
We assessed the gene overlap between our 25-gene signature and the three molecular subtype classifiers [16, 25, 26] and five other signatures recently pub-lished that displayed robust and independent prognos-tic value [15, 17, 20, 22, 30]. As shown in Additional file 6: Figure S2, there was no overlap with the five signatures, and the overlap with the molecular subtype classifiers was very low (0 gene with Collisson, 1 with Moffitt stroma, 2 with Moffitt tumor, and 3 with Bailey). Validation of the 25-gene classifier and clinicopathological associations
We tested the 25-gene prognostic classifier in the inde-pendent validation set of 562 patients whose clinicopatho-logical characteristics were close to those of the learning set (Additional file 7: Table S4) and with a 2-year OS of 39% (95% CI 35–44; Fig. 1a). The classifier sorted the 562 patients into two classes, STS-like (n = 216; 38%) and LTS-like (n = 346; 62%), with a 2-year OS of 25% (95% CI 18–33) and 48% (95% CI 42–54), respectively Table 1 Patient and tumor clinicopathological characteristics of
601 samples
Characteristics All (n = 601)
Age at diagnosis, years
≤ 60 118 (32%) > 60 246 (68%) Sex Female 170 (46%) Male 197 (54%) AJCC Stage 1 62 (12%) 2 431 (84%) 3 10 (2%) 4 12 (2%) Pathological type Ductal 537 (98%) Othera 11 (2%) Pathological grade 1 33 (12%) 2 154 (55%) 3 91 (32%) 4 2 (1%)
Pathological tumor size (pT)
pT1 18 (5%)
pT2 62 (16%)
pT3 302 (77%)
pT4 11 (3%)
Pathological lymph node status (pN)
Negative 141 (31%) Positive 310 (69%) Collisson subtypes Classical 234 (39%) Exocrine-like 211 (35%) Quasi-mesenchymal 156 (26%)
Moffitt subtypes,‘type’
Basal-like 232 (39%) Classical 369 (61%) Bailey subtypes ADEX 140 (23%) Immunogenic 104 (17%) Pancreatic progenitor 142 (24%) Squamous 215 (36%) Deceased 354 (59%) 2-year OS (95% CI) 40% (36–45)
Median OS, months (range) 20 (1–156.4)
aOther: 8 neuroendocrine tumors, 2 acinar cell carcinomas, 1 intraductal
tubulopapillary neoplasm
ADEX aberrantly differentiated endocrine exocrine, AJCC American Joint Committee on Cancer, CI confidence interval, OS overall survival
(P = 4.33 × 10⁻⁹, log-rank test; Fig. 1b), thus confirm-ing its prognostic value. The respective median OS were 15 months (range, 1–104) and 23 months (range, 1–156).
Interestingly, in each of the nine datasets separately, the 2-year OS was shorter in the STS-like class than in the LTS-like class, and the difference was or tended to be significant Table 2 Top 40 gene ontology (GO) biological processes associated with the 1400 genes differentially expressed between the short-term survivor (STS) and long-term survivor (LTS) samples of the learning set
GO:BP TermsID GO:BP Terms N P value Status STS vs. LTS
GO:0030198 Extracellular matrix organization 70 9.15 × 10⁻²⁶ Up
GO:0007155 Cell adhesion 75 2.46 × 10⁻²² Up
GO:0022617 Extracellular matrix disassembly 35 2.70 × 10⁻¹⁸ Up
GO:0008544 Epidermis development 25 1.04 × 10⁻¹⁷ Up
GO:0030574 Collagen catabolic process 26 2.78 × 10⁻¹⁷ Up
GO:0006955 Immune response 50 1.44 × 10⁻¹⁶ Up
GO:0006954 Inflammatory response 52 2.34 × 10⁻¹⁶ Up
GO:0030199 Collagen fibril organization 19 6.76 × 10⁻¹⁶ Up
GO:0018149 Peptide cross-linking 10 1.23 × 10⁻¹⁰ Up
GO:0006935 Chemotaxis 22 2.34 × 10⁻¹⁰ Up
GO:0010951 Negative regulation of endopeptidase activity 23 6.65 × 10⁻¹⁰ Up
GO:0030216 Keratinocyte differentiation 14 3.24 × 10⁻⁹ Up
GO:0010466 Negative regulation of peptidase activity 8 1.47 × 10⁻⁸ Up
GO:0001501 Skeletal system development 22 2.51 × 10⁻⁸ Up
GO:0007160 Cell-matrix adhesion 19 1.30 × 10⁻⁷ Up
GO:0000278 Mitotic cell cycle 50 1.71 × 10⁻⁷ Up
GO:0008283 Cell proliferation 42 1.86 × 10⁻⁷ Up
GO:0031124 Mrna 3-end processing 600 2.19 × 10⁻⁷ Up
GO:0008284 Positive regulation of cell proliferation 45 3.26 × 10⁻⁷ Up
GO:0001525 Angiogenesis 32 3.31 × 10⁻⁷ Up
GO:0019228 Neuronal action potential 6 1.26 × 10⁻⁶ Down
GO:0007409 Axonogenesis 12 1.13 × 10⁻⁶ Down
GO:0007628 Adult walking behavior 7 1.09 × 10⁻⁶ Down
GO:0007212 Dopamine receptor signaling pathway 5 7.83 × 10⁻⁷ Down
GO:0006906 Vesicle fusion 10 4.63 × 10⁻⁷ Down
GO:0030073 Insulin secretion 9 5.27 × 10⁻⁸ Down
GO:0007274 Neuromuscular synaptic transmission 6 5.20 × 10⁻⁸ Down
GO:0007399 Nervous system development 27 1.44 × 10⁻⁸ Down
GO:0014047 Glutamate secretion 9 5.89 × 10⁻⁹ Down
GO:0007626 Locomotory behavior 15 4.46 × 10⁻⁹ Down
GO:0086010 Membrane depolarization during action potential 8 1.71 × 10⁻⁹ Down
GO:0031018 Endocrine pancreas development 12 1.16 × 10⁻⁹ Down
GO:0017158 Regulation of calcium ion-dependent exocytosis 10 9.94 × 10⁻¹⁰ Down
GO:0006112 Energy reserve metabolic process 20 4.05 × 10⁻¹¹ Down
GO:0017157 Regulation of exocytosis 13 1.60 × 10⁻¹¹ Down
GO:0006813 Potassium ion transport 15 3.94 × 10⁻¹² Down
GO:0071805 Potassium ion transmembrane transport 17 1.97 × 10⁻¹³ Down
GO:0016079 Synaptic vesicle exocytosis 17 4.00 × 10⁻¹⁵ Down
GO:0007269 Neurotransmitter secretion 19 7.04 × 10⁻¹⁶ Down
(Additional file 8: Figure S3). To assess the likelihood of our 25-gene signature as a non-random signature, we gen-erated by a resampling scheme 100,000 random gene sig-natures from the list of 1400 genes differentially expressed and tested their prognostic value in the validation set.
None of the random signatures was more significant than the data-derived 25-gene signature, suggesting that the latter represented an optimal prognostic combination.
We searched for associations between the 25-gene signature-based classification and the clinicopathological Table 3 List of 25 genes included in our prognostic classifier
Symbol Description Cytoband Expression status
GPR87 G protein-coupled receptor 87 3q24 Up STS vs. LTS
KRT13 keratin 13, type I 17q21.2 Up STS vs. LTS
RAC2 ras-related C3 botulinum toxin substrate 2 (rho family, small GTP binding protein Rac2) 22q13.1 Up STS vs. LTS
C16orf74 chromosome 16 open reading frame 74 16q24.1 Up STS vs. LTS
NAMPT nicotinamide phosphoribosyltransferase 7q22.3 Up STS vs. LTS
DHRS9 dehydrogenase/reductase (SDR family) member 9 2q31.1 Up STS vs. LTS
HIST2H2BF histone cluster 2, H2bf 1q21.2 Up STS vs. LTS
TREM2 triggering receptor expressed on myeloid cells 2 6p21.1 Up STS vs. LTS
ZDHHC20 zinc finger, DHHC-type containing 20 13q12.11 Up STS vs. LTS
CD180 CD180 molecule 5q12 Up STS vs. LTS
ADGRG6 adhesion G protein-coupled receptor G6 6q24.1 Up STS vs. LTS
APBB1IP amyloid beta (A4) precursor protein-binding, family B, member 1 interacting protein 10p12.1 Up STS vs. LTS
EGR3 early growth response 3 8p23-p21 Down STS vs. LTS
MACROD2 MACRO domain containing 2 20p12.1 Down STS vs. LTS
EPHA7 EPH receptor A7 6q16.1 Down STS vs. LTS
RASGEF1A RasGEF domain family, member 1A 10q11.21 Down STS vs. LTS
SYNM synemin, intermediate filament protein 15q26.3 Down STS vs. LTS
S100A1 S100 calcium binding protein A1 1q21 Down STS vs. LTS
WNK2 WNK lysine deficient protein kinase 2 9q22.3 Down STS vs. LTS
RAMP2 receptor (G protein-coupled) activity modifying protein 2 17q12-q21.1 Down STS vs. LTS
SOCS2 suppressor of cytokine signaling 2 12q Down STS vs. LTS
COL28A1 collagen, type XXVIII, alpha 1 7p21.3 Down STS vs. LTS
B4GALT6 UDP-Gal:betaGlcNAc beta 1,4-galactosyltransferase, polypeptide 6 18q11 Down STS vs. LTS
PLCB4 phospholipase C, beta 4 20p12 Down STS vs. LTS
MTURN maturin, neural progenitor differentiation regulator homolog (Xenopus) 7p14.3 Down STS vs. LTS
a
b
0 10 20 30 40 50 60 0.0 0.2 0.4 0.6 0.8 1.0Months after diagnosis
Overall
survival 39% (95%CI, 35-44)2-Year OS
0 10 20 30 40 50 60 0.0 0.2 0.4 0.6 0.8 1.0
Months after diagnosis
Overall survival LTS-like (N=346) STS-like (N=216) p=4.33E-09
Fig. 1 Overall survival (OS) in the validation set according to our prognostic 25-gene classifier. Kaplan–Meier OS curves in all patients (a) and in all patients according to our prognostic classifier (STS-like and LTS-like classes) (b). TheP values of the log-rank test are indicated
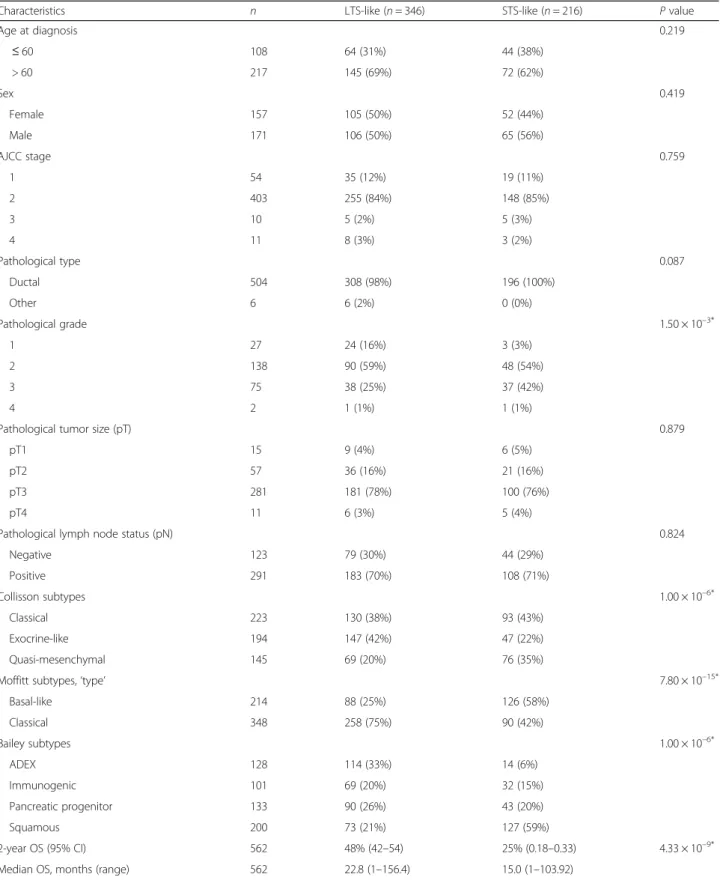
variables of samples. As shown in Table 4, no association was found with patient age and sex, AJCC stage, patho-logical type, tumor size, and lymph node status. By con-trast, there were more grade 3 tumors (P = 1.50 × 10⁻³) in the STS-like class, and more aggressive molecular sub-types (Baileys’ squamous, Collison’ quasi-mesenchymal, and Moffitt’s basal-like; P < 0.05).
Uni- and multivariate prognostic analyses
We compared the prognostic value of our 25-gene clas-sifier with that of other clinicopathological variables in the validation set. In univariate analysis (Table 5), three variables were associated with OS (Wald test), namely the AJCC clinical stage (P = 4.71 × 10⁻³), the patho-logical pN status (P = 1.24 × 10⁻⁴), and our 25-gene classifier (P = 7.47 × 10⁻⁹). The hazard ratio (HR) for death was 1.93 (95% CI 1.55–2.42) in the STS-like vs. LTS-like classes. In multivariate analysis, only our classi-fier (P = 6.33 × 10⁻⁷) and the pN status (P = 2.95 × 10⁻²) remained significant, suggesting an independent prognos-tic value. The stratification of patients according to both the classifier and the AJCC stage identified classes with different 2-year OS (Additional file 9: Figure S4). For example, in patients with stage 1 tumor, the 2-year OS was 42% in the STS-like class (42%) and 73% in the LTS-like class (P = 6.74 × 10⁻³, log-rank test). Stage 2 patients were similarly subdivided into STS- and
LTS-like with a 21% and 46% 2-year OS (P = 4.37 × 10⁻⁷,
log-rank test), respectively.
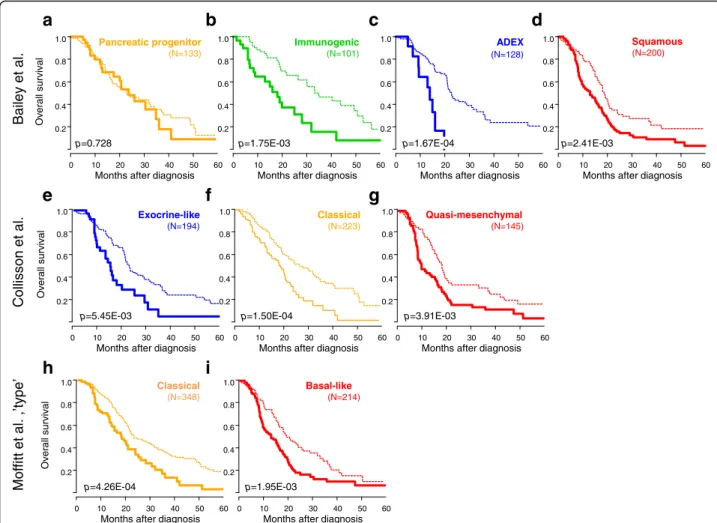
Given the association between the molecular subtypes and the 25-gene classifier, we compared their respective prognostic performance. In univariate analysis, the three molecular subtype classifiers confirmed their prognostic value in this large sample set (Additional file 10: Figure S5). However, in multivariate analysis including the four multi-gene classifiers, only our 25-multi-gene classifier remained signifi-cant (P = 6.33 × 10⁻⁶, Wald test, Table 5) with a HR of 1.77 (95% CI 1.38–2.26). As shown in Fig. 2, it affected the clinical outcome of all molecular subtypes of all three classifications, except the Bailey’s progenitor subtype.
Discussion
Pancreatic carcinoma is a heterogeneous disease with high metastatic propensity and poor prognosis. In pa-tients with resectable disease, the development of effect-ive systemic therapies is crucial. During the last decades, several retrospective studies [41] and a few prospective phase II studies [8–10] have suggested the potential benefit of neoadjuvant chemotherapy, and large random-ized phase II/III trials are ongoing. In this context, a major challenge is to improve the imperfect current prognostic factors to aid in therapeutic decision-making, notably regarding the decision for immediate surgery followed by chemotherapy or neoadjuvant chemotherapy
followed by surgery. Here, we have analyzed whole-genome expression profiles of 601 pancreatic carcinoma samples from operated patients, and identified a robust 25-gene classifier associated with post-operative OS independently of classical prognostic factors and mo-lecular subtypes. To our knowledge, this study is by far the largest prognostic study of gene expression profiles in pancreatic carcinoma.
Gene expression profiling remains today the most promising and successful high-throughput molecular ap-proach to identify new prognostic tools in early-stage cancers. Multigene signatures are already marketed, such as Oncotype™ in breast cancer or Coloprint™ in colon cancer, yet no similar signature is available in pancreatic carcinoma. The paucity of tumor specimens available for analysis explains the relatively small number of samples profiled in previous prognostic studies, with 102 samples in the largest one [20] to use supervised analysis, and 328 in the Australian ICGC study [25], which identified prognostic molecular subtypes by unsupervised analysis. We overcame the problem by pooling nine public datasets, representing a total of 601 operated primary cancers with available follow-up, and allowing the use of a learning set and a validation set in the supervised ana-lysis. Our series displayed classical clinicopathological characteristics and poor prognosis with a 40% 2-year OS. The learning set, which included only 39 samples, was remarkably small compared with the validation set; this might have reduced our ability to capture the best genes for the classifier. However, it was carefully designed to contain two groups with distinct aggressive-ness, namely a LTS group after surgery and a STS group, and to contain samples profiled using the same technol-ogy (RNA-Seq). Such design likely explains the large number of genes (1400) differentially expressed between the two patient groups despite the correction for the multiple testing hypothesis, and the robustness of our final signature in the validation set. A similar design had been used previously [20] by comparing primary tumors from metastatic versus non-metastatic patients. The size of our series allowed testing of the classifier in a large independent validation set of 562 samples with multi-variate analysis and increased statistical power. For com-parison, the other prognostic expression signatures published to date in pancreatic cancer [15–24] were de-fined in learning sets including 6–70 clinical samples, then tested in validation sets including 67–246 samples, with inconstant multivariate analysis.
We first identified 1400 genes differentially expressed between the STS and LTS samples. From this gene list, a 25-gene classifier was developed, identifying two classes, namely STS-like and LTS-like. The prognostic value was verified in the independent validation set, in which the two classes, STS-like (38% of samples) and LTS-like
Table 4 Associations of our prognostic classification with clinicopathological features (validation set)
Characteristics n LTS-like (n = 346) STS-like (n = 216) P value
Age at diagnosis 0.219 ≤ 60 108 64 (31%) 44 (38%) > 60 217 145 (69%) 72 (62%) Sex 0.419 Female 157 105 (50%) 52 (44%) Male 171 106 (50%) 65 (56%) AJCC stage 0.759 1 54 35 (12%) 19 (11%) 2 403 255 (84%) 148 (85%) 3 10 5 (2%) 5 (3%) 4 11 8 (3%) 3 (2%) Pathological type 0.087 Ductal 504 308 (98%) 196 (100%) Other 6 6 (2%) 0 (0%) Pathological grade 1.50 × 10–3* 1 27 24 (16%) 3 (3%) 2 138 90 (59%) 48 (54%) 3 75 38 (25%) 37 (42%) 4 2 1 (1%) 1 (1%)
Pathological tumor size (pT) 0.879
pT1 15 9 (4%) 6 (5%)
pT2 57 36 (16%) 21 (16%)
pT3 281 181 (78%) 100 (76%)
pT4 11 6 (3%) 5 (4%)
Pathological lymph node status (pN) 0.824
Negative 123 79 (30%) 44 (29%) Positive 291 183 (70%) 108 (71%) Collisson subtypes 1.00 × 10⁻⁶* Classical 223 130 (38%) 93 (43%) Exocrine-like 194 147 (42%) 47 (22%) Quasi-mesenchymal 145 69 (20%) 76 (35%)
Moffitt subtypes,‘type’ 7.80 × 10⁻¹⁵*
Basal-like 214 88 (25%) 126 (58%) Classical 348 258 (75%) 90 (42%) Bailey subtypes 1.00 × 10⁻⁶* ADEX 128 114 (33%) 14 (6%) Immunogenic 101 69 (20%) 32 (15%) Pancreatic progenitor 133 90 (26%) 43 (20%) Squamous 200 73 (21%) 127 (59%) 2-year OS (95% CI) 562 48% (42–54) 25% (0.18–0.33) 4.33 × 10⁻⁹*
Median OS, months (range) 562 22.8 (1–156.4) 15.0 (1–103.92)
ADEX aberrantly differentiated endocrine exocrine, CI confidence interval, LTS long-term survivors, STS short-term survivors, OS overall survival *Statistically significant
Table 5 Uni-and multivariate Cox regression analyses for overall survival (validation set) Charact eristic s Univariate Mu ltivariate Multivariate N HR (95% CI) P value N HR (95% CI) P valu e N HR (95% CI) P valu e Age at dia gnosis >60 vs. ≤ 60 325 1.22 (0.88 –1.70) 0.23 4 Sex Male vs. fem ale 328 1.08 (0.80 –1.45) 0.63 3 AJCC Stage 2 vs. 1 478 2.01 (1.32 –3.07) 4.71 × 10 – 3* 408 1.57 (0.88 –2. 82) 0.128 3 vs. 1 3.11 (1.33 –7.23) 408 2.21 (0.82 –5. 97) 0.119 4 vs. 1 2.85 (1.16 –7.05) 408 1.44 (0.19 –10 .97) 0.723 Patho logical type Other vs. ductal 510 0.36 (0.09 –1.45) 0.15 1 Patho logical grade 2 vs. 1 242 1.52 (0.65 – 3.55) 0.18 5 3 vs. 1 2.15 (0.91 – 5.11) 4 vs. 1 2.66 (0.53 –13.3) Patho logical tumor size (pT) 2 vs. 1 364 1.49 (0.62 –3.59) 0.13 1 3 vs. 1 1.95 (0.86 –4.42) 4 vs. 1 2.93 (1.01 –8.48) Patho logical lymp h node statu s (pN) 1 vs. 0 414 1.83 (1.34 –2.48) 1.24 × 10 – 4* 408 1.50 (1.04 –2. 16) 2.95 × 10 – 2* Colliss on subtypes Exocri ne-like vs. cl assical 562 1.00 (0.77 –1.29) 2.32 × 10 – 3* 562 0. 94 (0.6 6– 1.34) 0. 732 Quasi-m esench ymal vs. classical 1.52 (1.17 –1.99) 562 1. 15 (0.8 3– 1.59) 0. 395 Moffit t subtypes, ‘type ’ Classical vs. bas al-like 562 0.64 (0.51 –0.80) 6.29 × 10 – 5* 562 1. 00 (0.7 2– 1.38) 0. 994 Baile y subtypes Immu nogeni c vs. ADEX 562 0.81 (0.57 –1.17) 8.98 × 10 – 6* 562 0. 68 (0.4 3– 1.06) 0. 090 Pancre atic proge nitor vs. ADEX 0.97 (0.70 –1.35) 562 0. 79 (0.5 1– 1.23) 0. 302 Squam ous vs. ADEX 1.64 (1.22 –2.19) 562 1. 09 (0.6 8– 1.74) 0. 731 25-gen e class ifier STS-like vs. LTS-l ike 562 1.93 (1.55 –2.42) 7.47 × 10 – 9* 408 2.04 (1.54 –2. 70) 6.33 × 10 – 7* 562 1. 77 (1.3 8– 2.26) 6. 33 × 10 – 6* ADEX aberrantly differentiated endocrine exocrine, CI confidence interval, HR hazard ration, LTS long-term survivors, STS short-term survivors *Statistically significant
(62%), showed a different 2-year OS (25% in the STS-like and 48% in the LTS-STS-like). Interestingly, and by con-trast to the other published studies in the field, this prognostic value existed in each of the nine datasets considered separately. As expected, the other variables significant in univariate analysis included the AJCC stage and the pathological lymph node status. The patho-logical type (other vs. ductal) was not significant (HR 0.36 with P = 0.151) because of the small percentage (1%) of “other” types. Interestingly, all six “other” type samples were classified in the LTS-like class, in agree-ment with the better prognosis of neuroendocrine tu-mors. Importantly, the OS analysis was not modified when limited to the 504 ductal samples with a 27% 2-year OS in the STS-like and 48% in the LTS-like. Our 25-gene classifier displayed an independent prognostic value. Interestingly, it outperformed the molecular sub-types in multivariate analysis and identified patients with shorter and longer survival in all subtypes but one,
highlighting substantial heterogeneity in each of them. None of the 100,000 25-gene signatures randomly gener-ated by a resampling scheme was more significant than the data-derived 25-gene signature, suggesting that this latter represented a non-random optimal prognostic combination.
Ontology analysis of the 25 genes revealed interesting pathways, such as pathways related to the metastatic process (extracellular matrix organization and disassem-bly, cell and cell-matrix adhesion), local inflammation (immune and inflammatory responses, chemotaxis), and cell proliferation (mitotic cell cycle, positive regulation
of proliferation) associated with the “poor-prognosis
genes”. Pathways associated with the “good-prognosis
genes” included those related to pancreas metabolism
(endocrine pancreas development, energy reserve meta-bolic process, insulin secretion) or synaptic connections (synaptic transmission and vesicle exocytosis, membrane depolarization during action potential). Whether the 25
a
b
c
d
ADEX (N=128) Immunogenic (N=101) Pancreatic progenitor (N=133) Squamous (N=200) 0 10 20 30 40 50 60 0.2 0.4 0.6 0.8 1.0Months after diagnosis
0 10 20 30 40 50 60 0.2 0.4 0.6 0.8 1.0
Months after diagnosis
0 10 20 30 40 50 60 0.2 0.4 0.6 0.8 1.0
Months after diagnosis
0 10 20 30 40 50 60 0.2 0.4 0.6 0.8 1.0
Months after diagnosis
Ov
erall
survival
p=0.728 p=1.75E-03 p=1.67E-04 p=2.41E-03
Quasi-mesenchymal (N=145) Classical (N=223) Exocrine-like (N=194) 0 10 20 30 40 50 60 0.2 0.4 0.6 0.8 1.0
Months after diagnosis
0 10 20 30 40 50 60 0.2 0.4 0.6 0.8 1.0
Months after diagnosis
0 10 20 30 40 50 60 0.2 0.4 0.6 0.8 1.0
Months after diagnosis
Overall
s
urvival
p=5.45E-03 p=1.50E-04 p=3.91E-03
e
f
g
Basal-like (N=214) Classical (N=348) 0 10 20 30 40 50 60 0.2 0.4 0.6 0.8 1.0Months after diagnosis
0 10 20 30 40 50 60 0.2 0.4 0.6 0.8 1.0
Months after diagnosis
Overall s urviv al p=4.26E-04 p=1.95E-03
h
i
.l a t e y eli a B n o s sill o C .l a t e tti ff o M ’ e p yt’ , .l a t eFig. 2 Overall survival (OS) in the validation set according to our prognostic 25-gene classifier and the molecular subtypes. Kaplan–Meier OS curves according to our prognostic classifier (STS-like and LTS-like classes) and the molecular subtypes defined by Bailey (a pancreatic progenitor; b immunogenic; c ADEX; d squamous), Collison (e exocrine-like; f classical; g quasi-mesenchymal), and Moffitt (h classical; i basal-like). TheP values (log-rank test) for the comparison between the two classes within each molecular subtype are indicated
classifier genes are causative of the phenotype in a bio-logical sense or reflect another associated phenomenon remain to be explored. However, it was interesting to find some genes already reported as associated with cancer biology and/or to the clinical outcome of cancer patients. Among the genes upregulated in STS, GPR87, RAC2, NAMPT, C16orf74, TREM2, and CD180 are
in-volved in NF-KB-mediated cell signaling, and KRT13,
RAC2, C16orf74, ADGRG6, and APBB1IP in epithelial– mesenchymal transition. These two pathways are fre-quently affected in pancreatic ductal adenocarcinoma (PDAC) [42, 43]. Activation of the NF-KB signaling path-way plays an important role in the development and progression of disease and impacts the epithelial–mesen-chymal transition, chemoresistance, migration, and inva-sion of pancreatic cancer cells [42, 44–46]. The NF-KB activation pathway picked by our signature might not necessarily be related to tumor cells themselves. Stromal cells can modulate their activation status through NF-KB, based on the signals collected from their environ-ment. TREM2 and CD180 are negative regulators of the Toll-like receptor pathway [47], a family of receptors that recognize damage-associated molecule patterns, whose increased serum levels have been associated with cancer [48]. Inhibition of Toll-like receptors results in impaired immediate host defensive responses and anti-tumor response mounting. TREM2 and CD180 are also part of the conventional markers used to describe “alter-natively” activated M2 macrophages. M2 macrophages promote angiogenesis, tissue remodeling and repair, thus facilitating tumor progression and invasion, and their presence is correlated with poor prognosis in several cancers, including PDAC [49, 50]. Identifying molecules
that modulate some specific “activation nodes” of the
wide NF-KB signaling pathway could be interesting for pancreatic cancer therapy. Two other genes related to
NF-KB activation are GPR87 and NAMPT, and represent
potential therapeutic targets. GPR87 is overexpressed in various cancers, including pancreatic cancer cells and tissues, and its overexpression correlates with shorter OS [51]. GPR87 enhances pancreatic cancer aggressive-ness by activating the NF-KB signaling pathway, and plays a role in tumor cell survival [52, 53] and the regu-lation of TP53 [54]. Antagonists of GPR87 are in devel-opment [53]. NAMPT is one of the two enzymes regulating the NAD+ salvage pathway, a vital pathway allowing pancreatic cancer cells to maintain their metab-olism, notably in hypoxic conditions [55]. NAMPT is also involved in tumor angiogenesis [56, 57]. Thus, tar-geting NAMPT may not only disturb the salvage path-way on which pancreatic tumor cells heavily rely, but
may also “normalize” blood vessels in the tumor, a
phenomenon that will improve the delivery and efficacy of anticancer treatments and relieve immunosuppression
[58, 59]. Several NAMPT inhibitors are currently in development in oncology [60]. For example, FK866, a non-competitive highly specific inhibitor of NAMPT, shows potent anti-tumor activity both in vitro and in vivo [61] on pancreatic cancer samples overexpressing NAMPT mRNA. Among the other genes of our signa-ture upregulated in STS samples are C16orf74 and KRT13, which are associated with poor OS in pancreatic [62] and prostate [63] cancers.
Thirteen genes of our signature were downregulated in STS samples. Three of them, EGR3, EPHA7, and MACROD2, play a role in peripheral nervous system biology, which may have a role in PDAC aggressiveness [64]. We previously reported that the MACROD2 locus at chromosome 20p12.1 may be a cancer-specific fragile site often affected in PDAC [65]. Four genes (EPHA7, SOCS2, SYNM, WNK2) are tumor suppressor genes whose hypermethylation is a common mechanism of downregulation. WNK2 is a serine-threonine kinase in-volved in the regulation of electrolyte homeostasis, cell survival, and proliferation. Its downregulation occurs early in PDAC oncogenesis [66]. SOCS2 is an important regula-tor of the JAK-STAT pathway [67]. SYNM is a type IV intermediate filament involved in the modulation of cell adhesion and motility; in breast cancer, SYNM methylation is associated with shorter recurrence-free survival [68].
Conclusions
We have identified a 25-gene classifier associated with post-operative OS independently of classical prognostic factors and molecular subtypes. The strength of our study lies in the size of the series, the robustness of the classifier in a large and multicentric validation set and in each dataset separately, its independent prognostic value, its non-random nature, and the biological relevance of the included genes. The small number of genes should facilitate the clinical application of the classifier by using other transcriptional tests applicable to formaldehyde-fixed paraffin-embedded samples such as qRT-PCR, RNA-scope™ or Nanostring™ technologies. Limitations include the retrospective nature of our series and associated biases. Despite the very high P values, the HR for death was relatively low, around 2, in both uni- and multivariate analyses, and therefore of uncertain clinical value. How-ever, we think that the testing of our signature in the current prospective trials of adjuvant and neoadjuvant chemotherapy trials is warranted, and should be tested not only as a two-tiered classifier, but also as a continu-ous score. Indeed, a continucontinu-ous score based on the ex-pression of 25 genes showed significant prognostic value (data not shown) in univariate analysis (HR for death of 2.84 (95% CI 2.06–3.91), P = 1.96 × 10⁻¹⁰) and in multivariate analysis (HR for death of 3.25 (95% CI 2.11–4.99), P = 7.42 × 10⁻⁸). If validated, our signature
could help select patients with resectable disease for either immediate surgery (for the predicted LTS-like patients) or neoadjuvant chemotherapy (for the pre-dicted STS-like patients), which ultimately should affect outcome and impact quality of life. Of course, the clin-ical utility of this approach will have to be prospectively demonstrated prior to any use in clinical routine. Neo-adjuvant chemotherapy, currently mainly based on ana-tomical considerations, might also be indicated, and its benefits maximized, on the basis of the expression profile of aggressiveness, regardless of resectability. Finally, some of the classifier genes, or the pathways in which they are involved, may represent therapeutic targets. Therefore, functional studies to assess this are warranted.
Additional files
Additional file 1: Table S1. List of pancreatic cancer datasets included in our analysis. List of pancreatic cancer datasets included in our analysis. (XLS 28 kb)
Additional file 2: Figure S1. Principal component analysis (PCA) of pancreatic carcinoma samples of the learning set before and after normalization. PCA was applied to the 279 TCGA and ICGC samples and the 685 Bailey’s classifier genes. Before normalization (A), samples are grouped in the 2D scatter plot representation according to their origin dataset (left), and not according to their Bailey’s molecular subtype type (right), whereas after normalization (B), all samples are grouped according to their molecular subtype (right), and not according to their origin dataset (left), suggesting that the inter-set technical differences have been removed by normalization. In A and B, each colour represents a set (left) and each colour represents a molecular subtype (right).
(PPTX 595 kb)
Additional file 3: Supplementary Text. Sweave report. Sweave report describing the different steps of gene expression data analysis and associated statistics. (PDF 1013 kb)
Additional file 4: Table S2. List of 1400 genes differentially expressed between the short-term survivor (STS) samples and long-term survivor (LTS) samples of the learning set. List of 1400 genes differentially expressed between the STS and LTS samples of the learning set. (XLS 382 kb)
Additional file 5: Table S3. Ontology analysis of the 1400 genes differentially expressed between the short-term survivor (STS) and long-term survivor (LTS) samples of the learning set. Ontology analysis of the 1400 genes differentially expressed between the STS and LTS samples of the learning set. (XLS 3728 kb)
Additional file 6: Figure S2. Gene overlap between our 25-gene signature and other prognostic signatures. Venn diagram showing the overlap in genes between our signature and three prognostic signatures (A, Wang’s 28-gene signature, Haider’s 36-gene signature, and Chen’s 15-gene signature; the Stratford’s 6-gene and the Kirby’s 19-gene signatures are not shown because they display no gene common with the other four signatures), and between our signature and the four molecular subtype classifiers (B, Bailey’s 859-gene classifier, Collisson’s 62-gene classifier, Moffitt’s tumor 50-gene classifier, and Moffitt’s stroma 48-gene classifier). (PPTX 131 kb)
Additional file 7: Table S4. Patients and tumor clinicopathological characteristics of the learning and validation sets. (XLS 31 kb) Additional file 8: Figure S3. Overall survival (OS) in each set of the pooled validation set according to our prognostic 25-gene classifier. Kaplan–Meier OS curves in all patients according to our prognostic classifier (STS-like and LTS-like classes). The dashed vertical line represents the 2-year OS. TheP values of the log-rank test are indicated. (PPTX 142 kb)
Additional file 9: Figure S4. Overall survival (OS) in the validation set according to our prognostic 25-gene classifier and the American Joint Committee on Cancer (AJCC) Tumor, Node and Metastasis stage. Kaplan–Meier OS curves according to our prognostic classifier (STS-like and LTS-like classes) in patients with AJCC stage 1 (a) and AJCC stage 2 (b). TheP values of the log-rank test are indicated. (PPTX 78 kb) Additional file 10: Figure S5. Overall survival (OS) in the validation set according to the molecular subtypes. Kaplan–Meier OS curves according to the molecular subtypes defined by Bailey (a), Collison (b), and Moffitt (c). TheP values of the log-rank test are indicated. (PPTX 103 kb)
Abbreviations
ADEX:aberrantly differentiated endocrine exocrine; AJCC: American Joint Committee on Cancer; GO: gene ontology; HR: hazard ratio; LTS: long-term survivor; OS: overall survival; PDAC: pancreatic ductal adenocarcinoma; STS: short-term survivor; TCGA: The Cancer Genome Atlas
Acknowledgments Not applicable. Funding
Our work was supported by Institut Paoli-Calmettes, Institut National de la Santé et de la Recherche Médicale, Institut National du Cancer, and Site de Recherche Intégrée sur le Cancer Marseille (INCa-DGOS-Inserm 6038 grant). None of them had any role in the design of the study and collection, analysis, and interpretation of data and in writing the manuscript. Availability of data and materials
All expression and clinicopathological data analyzed in the present study are available in the GEO, ArrayExpress, EGA, and TCGA databases, as indicated in Additional file 1: Table S1.
Authors’ contributions
DJB was involved in the conception and design of study, analysis and interpretation of data, and drafting of the manuscript. PF was involved in the acquisition, analysis and interpretation of all data. AL, MG, FP, JLR, JRD, and VM were involved in the analysis and interpretation of all data. DB was involved in the analysis and interpretation of data. EM and FB were involved in the conception and design of study, analysis and interpretation of data, and draft of the manuscript. All authors read critically and approved the final manuscript. Ethics approval and consent to participate
All nine studies pooled had been previously published with the appropriate ethics approval and consent. The study was approved by our institutional board (Comité d’Orientation Stratégique IPC 2016-034).
Consent for publication Not applicable. Competing interests
The authors declare that they have no conflict of interest.
Publisher’s Note
Springer Nature remains neutral with regard to jurisdictional claims in published maps and institutional affiliations.
Author details
1Département d’Oncologie Moléculaire, Centre de Recherche en
Cancérologie de Marseille, Inserm UMR1068, CNRS UMR725, Aix-Marseille Université, Marseille, France.2Département de Chirurgie Générale et Viscérale, AP-HM, Marseille, France.3Faculté de Médecine, Aix-Marseille
Université, Marseille, France.4Département d’Oncologie Médicale, Institut
Paoli-Calmettes, Marseille, France.5Département d’Anatomopathologie,
Institut Paoli-Calmettes, Marseille, France.6Département d’Oncologie Chirurgicale, Institut Paoli-Calmettes, Marseille, France.7Département
d’Oncologie Moléculaire, Institut Paoli-Calmettes, 232 Bd. Ste-Marguerite, 13009 Marseille, France.
Received: 12 June 2017 Accepted: 23 August 2017
References
1. Ferlay J, Soerjomataram I, Dikshit R, Eser S, Mathers C, Rebelo M, et al. Cancer incidence and mortality worldwide: sources, methods and major patterns in GLOBOCAN 2012. Int J Cancer. 2015;136:E359–86. 2. Coveler AL, Herman JM, Simeone DM, Chiorean EG. Localized Pancreatic
Cancer: Multidisciplinary Management. Am Soc Clin Oncol Educ Book. 2016;35:e217–26.
3. Lewis R, Drebin JA, Callery MP, Fraker D, Kent TS, Gates J, et al. A contemporary analysis of survival for resected pancreatic ductal adenocarcinoma. HPB (Oxford). 2013;15:49–60.
4. Rhim AD, Mirek ET, Aiello NM, Maitra A, Bailey JM, McAllister F, et al. EMT and dissemination precede pancreatic tumor formation. Cell. 2012;148:349–61. 5. Silvestris N, Brunetti O, Vasile E, Cellini F, Cataldo I, Pusceddu V, et al.
Multimodal treatment of resectable pancreatic ductal adenocarcinoma. Crit Rev Oncol Hematol. 2017;111:152–65.
6. Lee SM, Katz MH, Liu L, Sundar M, Wang H, Varadhachary GR, et al. Validation of a proposed tumor regression grading scheme for pancreatic ductal adenocarcinoma after neoadjuvant therapy as a prognostic indicator for survival. Am J Surg Pathol. 2016;40:1653–60.
7. Mellon EA, Jin WH, Frakes JM, Centeno BA, Strom TJ, Springett GM, et al. Predictors and survival for pathologic tumor response grade in borderline resectable and locally advanced pancreatic cancer treated with induction chemotherapy and neoadjuvant stereotactic body radiotherapy. Acta Oncol. 2017;56:391–97.
8. Evans DB, Varadhachary GR, Crane CH, Sun CC, Lee JE, Pisters PW, et al. Preoperative gemcitabine-based chemoradiation for patients with resectable adenocarcinoma of the pancreatic head. J Clin Oncol. 2008;26:3496–502. 9. Varadhachary GR, Wolff RA, Crane CH, Sun CC, Lee JE, Pisters PW, et al. Preoperative gemcitabine and cisplatin followed by gemcitabine-based chemoradiation for resectable adenocarcinoma of the pancreatic head. J Clin Oncol. 2008;26:3487–95.
10. O'Reilly EM, Perelshteyn A, Jarnagin WR, Schattner M, Gerdes H, Capanu M, et al. A single-arm, nonrandomized phase II trial of neoadjuvant gemcitabine and oxaliplatin in patients with resectable pancreas adenocarcinoma. Ann Surg. 2014;260:142–8.
11. Brennan MF, Kattan MW, Klimstra D, Conlon K. Prognostic nomogram for patients undergoing resection for adenocarcinoma of the pancreas. Ann Surg. 2004;240:293–8.
12. Kwei KA, Bashyam MD, Kao J, Ratheesh R, Reddy EC, Kim YH, et al. Genomic profiling identifies GATA6 as a candidate oncogene amplified in pancreatobiliary cancer. PLoS Genet. 2008;4:e1000081.
13. Waddell N, Pajic M, Patch AM, Chang DK, Kassahn KS, Bailey P, et al. Whole genomes redefine the mutational landscape of pancreatic cancer. Nature. 2015;518:495–501.
14. Yeh JJ. Prognostic signature for pancreatic cancer: are we close? Future Oncol. 2009;5:313–21.
15. Chen DT, Davis-Yadley AH, Huang PY, Husain K, Centeno BA, Permuth-Wey J, et al. Prognostic fifteen-gene signature for early stage pancreatic ductal adenocarcinoma. PLoS One. 2015;10:e0133562.
16. Collisson EA, Sadanandam A, Olson P, Gibb WJ, Truitt M, Gu S, et al. Subtypes of pancreatic ductal adenocarcinoma and their differing responses to therapy. Nat Med. 2011;17:500–3.
17. Haider S, Wang J, Nagano A, Desai A, Arumugam P, Dumartin L, et al. A multi-gene signature predicts outcome in patients with pancreatic ductal adenocarcinoma. Genome Med. 2014;6:105.
18. Newhook TE, Blais EM, Lindberg JM, Adair SJ, Xin W, Lee JK, et al. A thirteen-gene expression signature predicts survival of patients with pancreatic cancer and identifies new genes of interest. PLoS One. 2014;9:e105631.
19. Sergeant G, van Eijsden R, Roskams T, Van Duppen V, Topal B. Pancreatic cancer circulating tumour cells express a cell motility gene signature that predicts survival after surgery. BMC Cancer. 2012;12:527.
20. Stratford JK, Bentrem DJ, Anderson JM, Fan C, Volmar KA, Marron JS, et al. A six-gene signature predicts survival of patients with localized pancreatic ductal adenocarcinoma. PLoS Med. 2010;7:e1000307.
21. Van den Broeck A, Vankelecom H, Van Delm W, Gremeaux L, Wouters J, Allemeersch J, et al. Human pancreatic cancer contains a side population expressing cancer stem cell-associated and prognostic genes. PLoS One. 2013;8:e73968.
22. Wang WY, Hsu CC, Wang TY, Li CR, Hou YC, Chu JM, et al. A gene expression signature of epithelial tubulogenesis and a role for ASPM in pancreatic tumor progression. Gastroenterology. 2013;145:1110–20. 23. Zhang G, Schetter A, He P, Funamizu N, Gaedcke J, Ghadimi BM, et al. DPEP1
inhibits tumor cell invasiveness, enhances chemosensitivity and predicts clinical outcome in pancreatic ductal adenocarcinoma. PLoS One. 2012;7:e31507. 24. Donahue TR, Tran LM, Hill R, Li Y, Kovochich A, Calvopina JH, et al.
Integrative survival-based molecular profiling of human pancreatic cancer. Clin Cancer Res. 2012;18:1352–63.
25. Bailey P, Chang DK, Nones K, Johns AL, Patch AM, Gingras MC, et al. Genomic analyses identify molecular subtypes of pancreatic cancer. Nature. 2016;531:47–52.
26. Moffitt RA, Marayati R, Flate EL, Volmar KE, Loeza SG, Hoadley KA, et al. Virtual microdissection identifies distinct tumor- and stroma-specific subtypes of pancreatic ductal adenocarcinoma. Nat Genet. 2015;47:1168–78. 27. Bertucci FBD, Finetti P, Gilabert M, Poizat F, Raoul JL, Birnbaum D,
Mamessier E. Prognostic value of molecular subtypes in pancreatic cancer. Pancreas. 2017;46:e29.
28. Winter C, Kristiansen G, Kersting S, Roy J, Aust D, Knosel T, et al. Google goes cancer: improving outcome prediction for cancer patients by network-based ranking of marker genes. PLoS Comput Biol. 2012;8:e1002511. 29. Zhang G, He P, Tan H, Budhu A, Gaedcke J, Ghadimi BM, et al. Integration of
metabolomics and transcriptomics revealed a fatty acid network exerting growth inhibitory effects in human pancreatic cancer. Clin Cancer Res. 2013;19:4983–93. 30. Kirby MK, Ramaker RC, Gertz J, Davis NS, Johnston BE, Oliver PG, et al. RNA sequencing of pancreatic adenocarcinoma tumors yields novel expression patterns associated with long-term survival and reveals a role for ANGPTL4. Mol Oncol. 2016;10:1169–82.
31. Irizarry RA, Hobbs B, Collin F, Beazer-Barclay YD, Antonellis KJ, Scherf U, et al. Exploration, normalization, and summaries of high density oligonucleotide array probe level data. Biostatistics. 2003;4:249–64.
32. SOURCE. The Stanford Online Universal Resource for Clones and ESTs. http://smd.stanford.edu/cgi-bin/source/sourceSearch. Accessed 8 Mar 2009. 33. NCBI Entrez Gene. National Center for Biotechnology Information. http://
www.ncbi.nlm.nih.gov/gene/. Accessed 6 Feb 2009.
34. NetAffx Annalysis Center. http://www.affymetrix.com/analysis/index.affx. Accessed 1 Dec 2012.
35. DAVID. Database for Annotation, Visualization and Integrated Discovery. http://david.abcc.ncifcrf.gov/. Accessed 22 Feb 2015.
36. Tibshirani R. The lasso method for variable selection in the Cox model. Stat Med. 1997;16:385–95.
37. Venet D, Dumont JE, Detours V. Most random gene expression signatures are significantly associated with breast cancer outcome. PLoS Comput Biol. 2011;7:e1002240.
38. Boutros PC, Lau SK, Pintilie M, Liu N, Shepherd FA, Der SD, et al. Prognostic gene signatures for non-small-cell lung cancer. Proc Natl Acad Sci U S A. 2009;106:2824–8.
39. R software. The Comprehensive R Archive Network. http://www.cran.r-project.org/. Accessed 26 Oct 2012.
40. McShane LM, Altman DG, Sauerbrei W, Taube SE, Gion M, Clark GM. REporting recommendations for tumor MARKer prognostic studies (REMARK). Nat Clin Pract Urol. 2005;2:416–22.
41. Artinyan A, Anaya DA, McKenzie S, Ellenhorn JD, Kim J. Neoadjuvant therapy is associated with improved survival in resectable pancreatic
adenocarcinoma. Cancer. 2011;117:2044–9.
42. Arlt A, Gehrz A, Muerkoster S, Vorndamm J, Kruse ML, Folsch UR, et al. Role of NF-kappaB and Akt/PI3K in the resistance of pancreatic carcinoma cell lines against gemcitabine-induced cell death. Oncogene. 2003;22:3243–51. 43. Weichert W, Boehm M, Gekeler V, Bahra M, Langrehr J, Neuhaus P, et al.
High expression of RelA/p65 is associated with activation of nuclear factor-kappaB-dependent signaling in pancreatic cancer and marks a patient population with poor prognosis. Br J Cancer. 2007;97:523–30. 44. Maier HJ, Schmidt-Strassburger U, Huber MA, Wiedemann EM, Beug H,
Wirth T. NF-kappaB promotes epithelial-mesenchymal transition, migration and invasion of pancreatic carcinoma cells. Cancer Lett. 2010;295:214–28. 45. Xiong HQ, Abbruzzese JL, Lin E, Wang L, Zheng L, Xie K. NF-kappaB activity
blockade impairs the angiogenic potential of human pancreatic cancer cells. Int J Cancer. 2004;108:181–8.
46. Fujioka S, Sclabas GM, Schmidt C, Frederick WA, Dong QG, Abbruzzese JL, et al. Function of nuclear factor kappaB in pancreatic cancer metastasis. Clin Cancer Res. 2003;9:346–54.
47. Zhong L, Chen XF, Zhang ZL, Wang Z, Shi XZ, Xu K, et al. DAP12 stabilizes the C-terminal fragment of the triggering receptor expressed on myeloid cells-2 (TREM2) and protects against LPS-induced pro-inflammatory response. J Biol Chem. 2015;290:15866–77.
48. Krysko O, Love Aaes T, Bachert C, Vandenabeele P, Krysko DV. Many faces of DAMPs in cancer therapy. Cell Death Dis. 2013;4:e631.
49. Lewis CE, Pollard JW. Distinct role of macrophages in different tumor microenvironments. Cancer Res. 2006;66:605–12.
50. Hu H, Hang JJ, Han T, Zhuo M, Jiao F, Wang LW. The M2 phenotype of tumor-associated macrophages in the stroma confers a poor prognosis in pancreatic cancer. Tumour Biol. 2016;37:8657–64.
51. Wang L, Zhou W, Zhong Y, Huo Y, Fan P, Zhan S, et al. Overexpression of G protein-coupled receptor GPR87 promotes pancreatic cancer aggressiveness and activates NF-kappaB signaling pathway. Mol Cancer. 2017;16:61. 52. Glatt S, Halbauer D, Heindl S, Wernitznig A, Kozina D, Su KC, et al. hGPR87
contributes to viability of human tumor cells. Int J Cancer. 2008;122:2008–16. 53. Zhang Y, Scoumanne A, Chen X. G Protein-coupled receptor 87: a
promising opportunity for cancer drug discovery. Mol Cell Pharmacol. 2010;2:111–16.
54. Zhang Y, Qian Y, Lu W, Chen X. The G protein-coupled receptor 87 is necessary for p53-dependent cell survival in response to genotoxic stress. Cancer Res. 2009;69:6049–56.
55. Sharif T, Ahn DG, Liu RZ, Pringle E, Martell E, Dai C, et al. The NAD(+) salvage pathway modulates cancer cell viability via p73. Cell Death Differ. 2016;23:669–80.
56. Bi TQ, Che XM. Nampt/PBEF/visfatin and cancer. Cancer Biol Ther. 2010;10:119–25.
57. Wang B, Hasan MK, Alvarado E, Yuan H, Wu H, Chen WY. NAMPT overexpression in prostate cancer and its contribution to tumor cell survival and stress response. Oncogene. 2011;30:907–21.
58. Huang Y, Goel S, Duda DG, Fukumura D, Jain RK. Vascular normalization as an emerging strategy to enhance cancer immunotherapy. Cancer Res. 2013;73:2943–8.
59. Jain RK. Antiangiogenesis strategies revisited: from starving tumors to alleviating hypoxia. Cancer Cell. 2014;26:605–22.
60. Chen H, Wang S, Zhang H, Nice EC, Huang C. Nicotinamide phosphoribosyltransferase (Nampt) in carcinogenesis: new clinical opportunities. Expert Rev Anticancer Ther. 2016;16:827–38.
61. Olesen UH, Christensen MK, Bjorkling F, Jaattela M, Jensen PB, Sehested M, et al. Anticancer agent CHS-828 inhibits cellular synthesis of NAD. Biochem Biophys Res Commun. 2008;367:799–804.
62. Nakamura T, Katagiri T, Sato S, Kushibiki T, Hontani K, Tsuchikawa T, et al. Overexpression of C16orf74 is involved in aggressive pancreatic cancers. Oncotarget. 2017;8:50460–75.
63. Li Q, Yin L, Jones LW, Chu GC, Wu JB, Huang JM, et al. Keratin 13 expression reprograms bone and brain metastases of human prostate cancer cells. Oncotarget. 2016;7:84645–57.
64. Biankin AV, Waddell N, Kassahn KS, Gingras MC, Muthuswamy LB, Johns AL, et al. Pancreatic cancer genomes reveal aberrations in axon guidance pathway genes. Nature. 2012;491:399–405.
65. Birnbaum DJ, Adelaide J, Mamessier E, Finetti P, Lagarde A, Monges G, et al. Genome profiling of pancreatic adenocarcinoma. Genes Chromosomes Cancer. 2011;50:456–65.
66. Dutruel C, Bergmann F, Rooman I, Zucknick M, Weichenhan D, Geiselhart L, et al. Early epigenetic downregulation of WNK2 kinase during pancreatic ductal adenocarcinoma development. Oncogene. 2014;33:3401–10. 67. Das R, Gregory PA, Fernandes RC, Denis I, Wang Q, Townley SL, et al.
MicroRNA-194 promotes prostate cancer metastasis by inhibiting SOCS2. Cancer Res. 2017;77:1021–34.
68. Noetzel E, Rose M, Sevinc E, Hilgers RD, Hartmann A, Naami A, et al. Intermediate filament dynamics and breast cancer: aberrant promoter methylation of the Synemin gene is associated with early tumor relapse. Oncogene. 2010;29:4814–25.
• We accept pre-submission inquiries
• Our selector tool helps you to find the most relevant journal • We provide round the clock customer support
• Convenient online submission • Thorough peer review
• Inclusion in PubMed and all major indexing services • Maximum visibility for your research
Submit your manuscript at www.biomedcentral.com/submit