HAL Id: hal-01316846
https://hal.archives-ouvertes.fr/hal-01316846
Submitted on 17 May 2016
HAL is a multi-disciplinary open access
archive for the deposit and dissemination of
sci-entific research documents, whether they are
pub-lished or not. The documents may come from
teaching and research institutions in France or
abroad, or from public or private research centers.
L’archive ouverte pluridisciplinaire HAL, est
destinée au dépôt et à la diffusion de documents
scientifiques de niveau recherche, publiés ou non,
émanant des établissements d’enseignement et de
recherche français ou étrangers, des laboratoires
publics ou privés.
Predicting disordered speech comprehensibility from
Goodness of Pronunciation scores
Lionel Fontan, Thomas Pellegrini, Júlia Olcoz, Alberto Abad
To cite this version:
Lionel Fontan, Thomas Pellegrini, Júlia Olcoz, Alberto Abad. Predicting disordered speech
compre-hensibility from Goodness of Pronunciation scores. Workshop on Speech and Language Processing
for Assistive Technologies (SLPAT 2015) satellite workshop of Interspeech 2015, Sep 2015, Dresden,
Germany. pp. 1-5. �hal-01316846�
Open Archive TOULOUSE Archive Ouverte (OATAO)
OATAO is an open access repository that collects the work of Toulouse researchers and
makes it freely available over the web where possible.
This is an author-deposited version published in :
http://oatao.univ-toulouse.fr/
Eprints ID : 15437
The contribution was presented at :
http://www.slpat.org/slpat2015/
To cite this version :
Fontan, Lionel and Pellegrini, Thomas and Olcoz, Júlia and
Abad, Alberto Predicting disordered speech comprehensibility from Goodness of
Pronunciation scores. (2015) In: Workshop on Speech and Language Processing for
Assistive Technologies (SLPAT 2015) satellite workshop of Interspeech 2015, 11
September 2015 - 11 September 2015 (Dresden, Germany).
Any correspondence concerning this service should be sent to the repository
administrator:
[email protected]
Predicting disordered speech comprehensibility from Goodness of
Pronunciation scores
Lionel Fontan
1, Thomas Pellegrini
1, Julia Olcoz
2, Alberto Abad
3,4 1Universit´e de Toulouse; UPS; IRIT; Toulouse, France
2
ViVoLAB - Voice Input Voice Output Laboratory; I3A; Universidad de Zaragoza, Zaragoza, Spain
3
L2F - Spoken Language Systems Laboratory; INESC-ID; Lisbon, Portugal
4
IST - Intituto Superior T´ecnico, Universidade de Lisboa, Portugal
{lionel.fontan, thomas.pellegrini}@irit.fr, [email protected], [email protected]
Abstract
Speech production assessment in disordered speech relies on tests such as intelligibility and/or comprehensibility tests. These tests are subjective and time-consuming for both the pa-tients and the practitioners. In this paper, we report on the use of automatically-derived pronunciation scores to predict compre-hensibility ratings, on a pilot development corpus comprised of 120 utterances recorded by 12 speakers with distinct patholo-gies. We found high correlation values (0.81) between Good-ness Of Pronunciation (GOP) scores and comprehensibility rat-ings. We compare the use of a baseline implementation of the GOP algorithm with a variant called forced-GOP, which showed better results. A linear regression model allowed to predict comprehensibility scores with a 20.9% relative error, compared to the reference scores given by two expert judges. A correla-tion value of 0.74 was obtained between both the manual and the predicted scores. Most of the prediction errors concern the speakers who have the most extreme ratings (the lowest or the largest values), showing that the predicted score range was glob-ally more limited than the one of the manual scores due to the simplicity of the model.
Index Terms: pronunciation assessment, Goodness of
Pronun-ciation, disordered speech, comprehensibility
1. Introduction
The assessment of speech production abilities in motor speech disorders relies almost exclusively on subjective tests such as intelligibility tests. These tests have two main disadvantages. They are very time-consuming and often imply subjective judg-ments: speakers read lists of words or sentences while one or several judge(s) evaluate their production. Within this frame-work automatic methods for speakers evaluation appear as prac-tical alternatives. Recent advances in Automatic Speech Recog-nition (ASR) – especially in the field of Computer-Assisted Language Learning (CALL) – have contributed to develop tech-niques that may be of great interest for this purpose.
ASR techniques developed for the assessment of foreign language learners’ pronunciation skills focused both on the seg-mental and the suprasegseg-mental levels, giving birth to two re-search fields respectively called individual error detection and
overall pronunciation assessment [1]. For individual error
de-tection (i.e., automatic dede-tection of mispronounced phones), two kinds of methods are used:
• methods based on the comparison of target phone models and learners’ phone models (e.g. nonnativeness [2] or
scores derived from classification methods such as linear discriminant analysis and alike [3]);
• methods independent of the learner’s native language, such as raw recognition scores [4], or Goodness of Pro-nunciation scores (GOP [5, 6]).
Since the latter methods do not rely on any assumption con-cerning the errors possibly made by the speakers, their rele-vance may not be limited to the field of CALL. For example, GOP scores can be calculated to get an idea on how confident the ASR system is about each phone identity. In a previous research work [7], GOP scores were compared to perceptual analysis results in order to detect mispronounced phonemes in individuals with unilateral facial palsy (UFP). The algorithm was found to be effective: it detected 49.6% of mispronunci-ations (CR rate) and 84.6% of correct pronuncimispronunci-ations. In [8] a preliminary test was conducted in order to study the relation-ship between mean GOP scores at sentence-level and subjective comprehensibility. Results were encouraging as highly signifi-cant correlations were observed, with absolute Pearson’s coef-ficients ranging from .68 to .79.
However, several questions remain concerning this last study. First, only the baseline implementation of the GOP al-gorithm was used. Recent alal-gorithm refinements for CALL applications suggest that the accuracy of GOP results can be greatly improved, as in Forced-aligned GOP measurements (F-GOP [9]). Moreover, the ability of (F-GOP scores to predict com-prehensibility judgments or measures was not assessed since the number of speakers was too limited. As a consequence the aim of the present work is twofold: 1) comparing the efficiency of GOP vs. F-GOP scores when dealing with disordered speech and 2) extending the number of speakers so as to test the ability of GOP measures to actually predict comprehensibility.
2. GOP algorithms
The purpose of the GOP algorithm is to automatically provide pronunciation scores at segmental level, that is one score per phone realization. The larger the score, the larger the differ-ence between a phone realization and the corresponding phone model. In other words, large scores indicate potential mispro-nunciations. In this work, we used two different implementa-tions: the original “baseline” one [5, 6], and a variant called Forced-aligned GOP (F-GOP) [9].
The baseline algorithm can be decomposed into three steps: 1) forced phone alignment phase, 2) free phone recognition phase and 3) score computation as the difference between the
Table 1: Mean GOP values, reaction time and comprehensibility scores for 6 speakers. AP: Patients suffering from structural
(anatomic) disorders, NP: Patients suffering from neurological disorders
Speaker Mean GOP value Mean F-GOP value Mean Reaction Time Mean comprehensibility
to oral commands (s) score
AP1 1.60 (0.56) 0.81 (0.36) 4.11 (0.77) 5.65 (0.45) NP1 2.32 (0.66) 1.11 (0.38) 4.63 (1.08) 5.30 (0.40) NP2 2.54 (0.48) 1.42 (0.77) 5.54 (1.17) 4.70 (0.40) AP2 2.86 (0.71) 1.99 (0.58) 5.50 (1.20) 4.05 (0.45) AP3 3.67 (0.46) 2.50 (0.68) 7.51 (1.15) 4.25 (0.35) AP4 4.15 (0.67) 4.01 (1.18) 9.64 (2.56) 1.65 (0.25)
log-likelihoods of the two preceding phases for each forced-aligned phone. The forced alignment phase is intended to pro-vide the ASR system with the orthographic transcription of the input sentence along with a pronunciation lexicon. It consists of forcing the system to align the speech signal with an expected phone sequence. On the contrary, free phone recognition de-termines the most likely phone sequence matching the audio input without constraint (free phone loop recognition). GOP scores typically range from zero (perfect match) to values up to 10. Higher values often indicate that the aligning step failed for some reason and scores are meaningless in this case. In or-der to decide whether a phone was mispronounced (“rejected”) or not (“accepted”), phone-dependent thresholds can be deter-mined on a development set. In this work, our goal was not to detect individual mispronunciations but rather to compute av-erage GOP scores per utterance in order to correlate them with comprehensibility scores given by human judges at utterance-level.
The forced-aligned GOP version is exactly the same as the baseline one with the only difference that the phone boundaries found during forced alignment constrain the free phone recog-nition phase. For each aligned phone, a single phone is rec-ognized. In [9], better correlations between GOP and manual scores were found with F-GOP than with baseline GOP in the context of a CALL experiment. Indeed, F-GOP removes the is-sues of comparing a single aligned phone with potentially sev-eral phones recognized within the same time interval.
3. Main objective and methodology
This study aims at verifying the ability of GOP measures to pre-dict disordered speech comprehensibility. To this end, 12 patho-logical speakers were recorded. In a first experiment, these recordings were split in two subsets, each consisting of the sen-tences (imperative commands) recorded by 6 speakers: a devel-opment corpus and a test corpus (section 4). Reference compre-hensibility scores, presented in section 5, were obtained a) by asking 24 listeners to react to the sentences using software cre-ated for this purpose and b) by asking two trained speech pathol-ogists to evaluate each sentence comprehensibility on a 7-points rating scale. Automatic measures found in GOP experiments (section 6) are compared so as to establish a predictive model of speakers’ comprehensibility. This model is finally used to predict speech pathologists’ comprehensibility judgments in 6 other patients (section 7). Since data from 6 speakers consti-tute a very small dataset with 60 utterances only, we also report prediction results in a cross-validation setup.
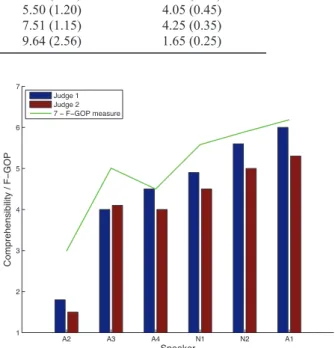
A2 A3 A4 N1 N2 A1 1 2 3 4 5 6 7 Speaker C o mp re h e n si b ili ty / F −G O P Judge 1 Judge 2 7 − F−GOP measure
Figure 1: Comprehensibility judgments as a function of mean
F-GOP scores. For a better clarity, F-GOP scores have been scaled following the equation: y = 7− F GOP .
4. Corpus description
Speech stimuli were recorded from three female and nine male patients. Patients were aged from 33 to 70 years old (mean = 55). Four patients suffered from speaking issues due to neurological disorders (spasmodic dysphonia, parkin-sonian dysarthria (2) and Huntington’s disease) and eight tients had troubles related to anatomic disorders: seven pa-tients suffered from sequelae consecutive to oropharyngeal can-cer surgery (among which two total laryngectomees) and one patient had dysphonia. The 12 patients were divided into two groups, both consisting in two patients suffering from neurolog-ical speech disorders and four patients suffering from anatomic speech disorders.
Each patient recorded 10 oral commands (sentences) among a hundred different ones, asking to move entities (ani-mals or objects), such as “Mettez l’ours `a gauche du kangourou” (Move the bear to the left of the kangaroo), or “Mettez le lion sous la banane” (Move the lion below the banana). All the com-mands had the same syntactic form.
0 1 2 3 4 5 6 0 1 2 3 4 5 6 7
Mean F−GOP score
Mean comprehensibility judgement 0 1 2 3 4 5 6 3 4 5 6 7 8 9 10 11 12
Mean F−GOP score
Mean reaction time (s)
Figure 2: Left: Mean sentence comprehensibility as a function of F-GOP scores. Ratings range from 1 (very difficult to understand) to
7 (very easy to understand). The red line is regression fit of equation y =−.92 ∗ F-GOP + 6.09, Right: Mean reaction times to oral
commands as a function of F-GOP. The red line represents the regression fit of equation y = 1.33∗ F-GOP + 3.51,
5. Comprehensibility measures
5.1. Subjective judgments of speech comprehensibility
Two speech pathologists judged each sentence on a 7-points comprehensibility scale, ranging from 1 – very hard to
under-stand up to 7 – very easy to underunder-stand. Both speech
patholo-gists had more than 10 years of experience in listening and eval-uating disordered speech. A Kendall tau-b rank correlation was computed so as to check the inter-rater agreement; a highly sig-nificant and strong correlation between the two rater scores was found (t = .73; p < .001). Finally, mean subjective compre-hensibility scores were calculated for each sentence by taking into account the two speech pathologists’ grades.
5.2. Behavioral scores: reaction times to oral commands
Behavioral scores were collected for the 60 sentences form-ing the development corpus. For this purpose 24 listeners re-sponded to the oral commands on a software created for record-ing their answers and reaction times [10]. For each command six images were displayed on a screen and listeners were asked to move the target image as demanded. As soon as the listener selected an image in order to move it, reaction time (RT) was collected. Keeping as an example the sentence asking to move the bear to the left of the kangaroo, RT was the time elapsed be-tween the beginning of sentence play and the time at which the listener clicked on the image representing a bear. Only cases in which the listeners selected the right target image were consid-ered. Listeners had a mean age of 32.5 years old (SD = 13.4) and benefited from various years of experience in listening to disordered speech (mean = 7.8; SD = 11.4). However, these two variables were found to have a comparable strength and opposite influence on RT [11]; consequently RT have not been weighted as a function of listeners’ age and years of experience with disordered speech. Only mean RT for each sentence was taken into account.
Table 2: Pearson correlation coefficients between automatic
scores and comprehensibility measures
Variables Correlation
GOP * Comprehensibility ratings -.684∗∗
F-GOP * Comprehensibility ratings -.808∗∗
GOP * Reaction times .786∗∗
F-GOP * Reaction times .844∗∗
∗∗Correlation is significant at the .001 level (2-tailed)
6. Relationship between GOP scores and
speakers’ comprehensibility
This section is solely concerned with data issued from the de-velopment corpus. Results concerning the prediction of com-prehensibility scores from the test corpus will be presented in section 7.
6.1. ASR system setup
This work was carried out with HTK [12]. The acoustic models are three-state left-to-right HMMs with 32 Gaussian mixture components trained on the ESTER corpus [13]. As they have been found to be more suitable for CALL applications [14], context-independent acoustic models (39 monophones) were used.
6.2. Results
6.2.1. Mean scores
Table 1 presents mean and standard deviations of GOP and F-GOP values as well as mean comprehensibility scores for each speaker of the development corpus. Mean RT tend to increase with mean GOP and F-GOP scores, whereas mean comprehen-sibility appears to decrease as a function of GOP and F-GOP. This suggests that the highest GOP and F-GOP scores are asso-ciated with the least comprehensible speakers, and vice versa.
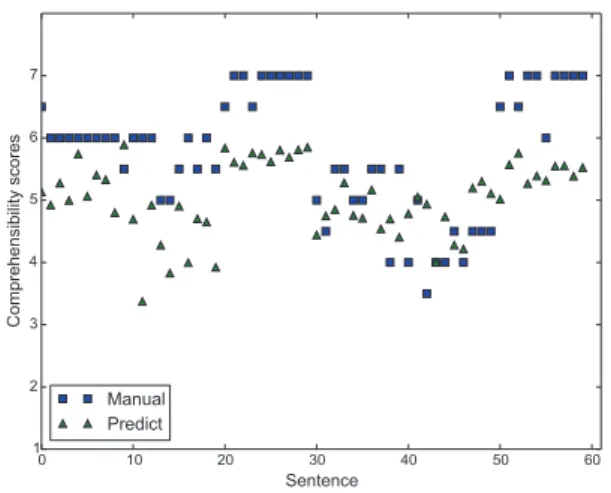
0 10 20 30 40 50 60 Sentence 1 2 3 4 5 6 7 Co mp reh en sib ilit y sco res Manual Predict
Figure 3: Manual and predicted comprehensibility scores for
each sentence of the test group (6 speakers). Each speaker recorded 10 sentences, so sentences from 0 to 9 on the X-axis correspond to speaker A5, from 10 to 19 to speaker A6.
6.2.2. Correlation between GOP scores and comprehensibility judgments
Pearson product-moment correlation calculations were com-puted to study the relationship between GOP/F-GOP scores and comprehensibility measures. Results show a weaker correlation
with GOP scores (r = −.684; p < .001) than with F-GOP
scores (r =−.808; p < .001). Both correlations are negative,
showing that comprehensibility judgments tend to increase as GOP scores decrease. To illustrate this, comprehensibility and mean F-GOP scores are represented in Figure 1. The correla-tion plot for all the sentences’ F-GOP scores is shown on the left-hand side part of Figure 2.
6.2.3. Correlation between GOP scores and reaction times
For both GOP and F-GOP scores, Pearson product-moment cor-relation calculations indicate a strong and highly significant re-lationship with reaction times to oral commands. A stronger correlation is found with F-GOP scores (r = .844; p < .001) than with GOP scores (r = .786; p < .001). The correlation plot for F-GOP scores is shown on the right-hand side part of figure 2. All correlation coefficients found for GOP scores and F-GOP scores are presented in table 2.
7. Prediction of speakers’
comprehensibility
As F-GOP are strongly correlated to the patients’ comprehensi-bility scores, a second part of the present work focused on the ability of F-GOP scores to predict speakers’ comprehensibility.
7.1. Separate test set
To this end, a first experiment consisted in estimating compre-hensibility ratings for 6 ”test” patients, different from the ones for which we reported results so far, with the help of the linear regression model previously described in Section 6.2.2. Pre-dicted scores were compared to the mean comprehensibility
rat-A2 A3 A4 N1 N2 A1 N3 A5 A6 A7 N4 A8 Speaker
0
1
2
3
4
5
6
7
Ave
rag
e C
omp
reh
en
sib
ilit
y Sco
res
Manual PredictFigure 4: Mean manual and predicted scores for all the 12
speakers, obtained in the LOSO-CV setup.
ings given by the two speech pathologists. In figure 3, manual and predicted comprehensibility scores are illustrated per sen-tence. Even if manual and predicted comprehensibility scores seem to follow the same tendencies (r = .59) predicted scores appear to be globally lower than manual scores, with a 16.3 % relative mean difference between both scores. This is mainly due to the fact that the 60 utterances were not sufficient to esti-mate a model.
7.2. LOSO-CV setup
In order to obtain sounder results, we repeated the experiment in a Leave-One-Speaker-Out Cross-Validation (LOSO-CV) fash-ion that allows to use more data to estimate the regressfash-ion pa-rameters. It corresponds to using data from 11 speakers (110 ut-terances) for the estimation of the regression parameters (slope
and intercept), and to make predictions for the 12thspeaker that
was left out. This process is repeated for each of the 12 speak-ers. A global Pearson correlation value of r = .74 was ob-tained, a much larger value than the preceding one. The rela-tive mean difference is higher, though, with a value of 20.9 %. This is probably due to the fact that we make predictions for 12 speakers, twice as many speakers as in the preceding setup. Figure 4 shows a comparison of manual and predicted com-prehensibility scores for all the 12 speakers. It shows that the dynamic range of the regression model is too limited: small and large scores are not predicted as accurately as medium scores.
8. Conclusions
The first noticeable result from this study is that a strong and highly significant relationship was found between GOP-derived scores and comprehensibility measures in the particular case of disordered speech. More precisely, the strongest correla-tions were found with F-GOP measures [9], which presented better results than conventional GOP scores [5]. This observa-tion tends to present F-GOP scores as more closely related to speech production performance, as it was also observed in [9] and [14] in the application domain from which these two algo-rithms originate – namely Computer-Assisted Language Learn-ing (CALL).
for studying the ability of F-GOP scores to predict disordered speech comprehensibility, which was done in the second part of this work. In a first score prediction experiment, data from 6 speakers (60 utterances) were used to estimate a simple linear regression model, and 60 comprehensibility automatic scores were predicted with this model on the remaining utterances from the 6 left-out speakers. A relative mean error of 16.3% was found, together with a low correlation value of 0.59, when comparing the automatic and the manual scores. These results were not conclusive mainly because of the small size of the subset used to estimate the regression parameters. The same prediction experiment but in a cross-validation setup was more satisfying since a 0.79 correlation value was obtained. Never-theless, the range of the automatic scores still was too small to correctly predict scores from speakers with low and large com-prehensibility ratings.
As a response to these observations, future work will be devoted to the enlargement of the pathological speech data, by collecting speech representative of a wide variety of speech dis-orders. More complex regression models, such as Bayesian models, will be interesting to test. Such models allow to in-troduce a priori information that may help in handling potential differences in model fits that may be seen for different groups of pathological speakers. Adding features characterizing supra-segmental aspects such as speech rate and pitch range, for in-stance, will also be worth testing.
9. Acknowledgments
The authors would like to acknowledge the Voice and Degluti-tion Unit (UVD) of the Hospital Larrey at Toulouse, with spe-cial regards to Virginie Woisard, Julie Bordenave and Astrid Ros, who participated in collecting the pathological speech data used in this study.
10. References
[1] M. Eskenazi, “An overview of spoken language technology for education,” Speech Communication, vol. 51, no. 10, pp. 832–844, 2009.
[2] G. Kawai and K. Hirose, “A method for measuring the intelligi-bility and nonnativeness of phone quality in foreign language pro-nunciation training,” in Proc. Internat. Conf. on Spoken Language
Processing – ICSLP-1998, 1998, pp. 1823–1826.
[3] H. Strik, K. P. Truong, F. de Wet, and C. Cucchiarini, “Comparing classifiers for pronunciation error detection.” in Proc. Interspeech
2007, 2007, pp. 1837–1840.
[4] B. Sevenster, G. d. Krom, and G. Bloothooft, “Evaluation and training of second-language learners’ pronunciation using phoneme-based HMMs,” in Proc. STiLL, Marholmen, 1998, pp. 91–94.
[5] S. Witt, “Use of Speech Recognition in Computer-Assisted Lan-guage Learning,” PhD Thesis, University of Cambridge, Dept. of Engineering, 1999.
[6] S. Witt and S. Young, “Phone-level Pronunciation Scoring and Assessment for Interactive Language Learning,” vol. 30, pp. 95– 108, 2000.
[7] T. Pellegrini, L. Fontan, J. Mauclair, J. Farinas, and M. Robert, “The goodness of pronunciation algorithm applied to disordered speech,” in Proc. Interspeech 2014, 2014, pp. 1463–1467. [8] T. Pellegrini, L. Fontan, J. Mauclair, J. Farinas, C. Alazard-Guiu,
M. Robert, and P. Gatignol, “Automatic assessment of speech ca-pability loss in disordered speech,” ACM Transactions on
Acces-sible Computing, vol. 6:3, May 2015.
[9] D. Luo, Y. Qiao, N. Minematsu, Y. Yamauchi, and K. Hirose, “Analysis and Utilization of MLLR Speaker Adaptation Tech-nique for Learners Pronunciation Evaluation,” in Proc.
Inter-speech 2009, 2009, pp. 608–611.
[10] L. Fontan, P. Gaillard, and V. Woisard, “Comprendre et agir : les tests pragmatiques de comprhension de la parole et elokanz,” in La
voix et la parole perturbes, R. Sock, B. Vaxelaire, and C. Fauth,
Eds. Mons: CIPA, 2013, pp. 131–144.
[11] L. Fontan, “De la mesure de l’intelligibilit´e `a l’´evaluation de la compr´ehension de la parole pathologique en situation de commu-nication,” PhD thesis, Universit´e de Toulouse, 2012.
[12] S. Young and S. Young, “The HTK Hidden Markov Model Toolkit: Design and Philosophy,” Entropic Cambridge Research
Laboratory, Ltd, vol. 2, pp. 2–44, 1994.
[13] S. Galliano, E. Geoffrois, D. Mostefa, K. Choukri, J.-F. Bonastre, and G. Gravier, “The ESTER phase II evaluation campaign for the rich transcription of French broadcast news,” in Proc. Interspeech
2005, 2005, pp. 1149–1152.
[14] T. Kawahara and N. Minematsu, Tutorial on CALL Systems at