ALTERNATIVE ELECTRIC GENERATION IMPACT SIMULATOR -Final Summary Report
James Gruhi, David Coate, Edmund Schweppe Energy Laboratory Report No. MIT-EL 81-044
ALTERNATIVE ELECTRIC CENERATI: IT:2ACT SIMULATOR -FINAL SUIIMARY REPORT
by
James Gruhl, David Coate, Edmund Schweppe MIT Energy Laboratory
Massachusetts Institute of Technology Cambridge, Massachusetts 02139
Sponsored By
Northeast Utilities.Service Corporation New England Electric System
Under the
M.I.T. Energy Laboratory Electric Utility Program Energy Laboratory Report MIT-EL 81-044
NOTICE AND ACKNOWLEDGEMENTS
This report was prepared at the MIT Energy Laboratory, Cambridge, Mass., as a summary account of the work performed on prediction of air pollution standards and strategies for meeting those standards. This research was sponsored by Northeast Utilities Service Corporation, under the principal direction of Denning Powell and with the
assistance of William Renfro, and was sponsored by New England Electric System, under the initial direction of Bradley Schrader, and later Jack Walsh. The use or sponosrship of this program has begun in different related areas at E.P.A., E.P.R.I., and, in a major new effort, at D.O.E. This research was conducted as part of the M.I.T. Electric Power Program,
William Hinkle, program manager.
None of these organizations nor any person acting on behalf of
these organizations: (a) makes any warranty or representation, express or implied, with respect to the accuracy, completeness, or usefulness of the information contained in this report, or that the use of any information , apparatus, method, or process disclosed in this report may not infringe privately owned rights; or (b) assumes any liabilities with respect to the use of, or for damages resulting from the use of, any information, apparatus, method, or process disclosed in this report. Mentions of products or policies do not necessarily imply endorsements of those products or policies by any of these organizations.
ABSTRACT
This report is a short summary of three related research tasks that were conducted during the project "Alternative Electric Generation
Impact Simulator." The first of these tasks combines several different types of investigations aimed at exploring the potential for, and
significance of, uncertainty in the energy technology assessment process. A survey and discussion is presented of technology assessments,
primarily from a methodological viewpoint. A general ideal methodology is developed and the potentials for incorporating uncertainties are described. There is particular emphasis on the impacts of assumptions and potential methods for incorporating concepts of uncertainty.
The implementation of an ideal assessment methodology resulted in the second task involving the coding of a simulator that should be viewed as a framework for assembling and manipulating information about the economics, emissions, ambient concentrations, and potential health impacts of different types and configurations of electric power generating facilities. The framework is probabilistic, and thus results in several measures of the range of various consequences, in other words a graphic display of the quality of the various
predictions. The simulator is structured so that it is easy to improve the sophistication of certain manipulations, or to replace generic data, or update or add new data. The latest version of the simulator is available from the authors and can be operated in batch or interactive modes.
standards over the next thirty years. This was required in order to have benchmarks against which to compare the performance of facilities which are simulated in the task 2 simulator. This third task required the development of a standards prediction methodology
through a modified Delphi-style survey of a large set of consultants. In the face ofaneverending battle to gather current data and update the computer codes, the material described in this report is of general interest. The annotated computer codes are available separately.
TABLE OF CONTENTS rage
Notice and Acknowledgements ... . 2
Abstract ... ... * * * * * . 3
Table of Contents . ... .* . * * * . * 5
1. Introduction ... . . . . . .. ... 6
2. Uncertainties in Energy Technology Assessments . ... . 7
2.1 Historical Perspective . ... . . . . . 9
2.2 Alternative Methodologies ... . . . 10
2.3 The Role of Uncertainty . . . . . . . . . . . . . . . 15
2.4 Assessment Methodologies and General Assumptions . . . .. 16
2.5 Imbedded Assumptions . . . . . . .. . . . . * * . 24
2.6 Review of Assessments and Conclusions . . . . ... . 27
3. AEGIS Simulation Model. . . . . . . . . . . . . . . . . . . . . . 30
3.1 Summary of Capabilities . ... .... 30
3.2 Input/Output Procedures . . . . . . . . . . . . . . . . . . 42
3.3 Status of AEGIS Modules . . . . . . . . . . . .. . . . 43
3.4 AEGIS Examples . . . . . . . . . . .. . . . . . . . . 58
4. Prediction of Future Ambient Air Quality Standards . . . ... 67
4.1 Ambient Regulations . . ... .. 72
4.2 Changing Air Pollution Standards . . . . . . . . . . . . . 73
4.3 Criteria Pollutants . ... * ... 79
4.4 Other Pollutant Regulation Issues . . . . . . . . . . . . . 89
5. References and Bibliography . ... . 94
1. INTRODUCTION
This project has involved a relatively small scale effort to conduct basic research followed by applied research in the area of air pollution control strategies and air pollution standards. Two
undergraduates and two graduate students participated in a major way in this project. In addition to the expertise collected by these students, this project allowed Energy Lab personnel to gather
experience in this energy/environment field, and several government and industry sponsored projects have resulted. Thus the output of this project consists of basic and applied research results, manpower training and developmental funds.
The performance period of this project has included a
first phase conducted for one year from 1977 to 1978 and a second
phase of a year ending in 1980. The work, however, has continued because the model in task 2 is constantly being modified and augmented and
there is, of course, a persistent struggle to try to catch up with current data. In the face of this neverending battle it was decided that this report should contain the information of general interest that could be extracted from the work on the three tasks. Section 2 thus contains the general information excerpted from (Coate, 1980) on uncertainties in energy technology assessments. Section 3
contains general information about the AEGIS simulation model, excerpted from (Gruhl, Nov. 1978) and updated with brief descriptions of the
later features added to the model. Section 4 excerpts information from (Gruhl, Sep. 1978) about the prediction of future ambient air quality standards.
2. UNCERTAINTIES IN ENERGY TECHNOLOGY ASSESSMENTS
In this study, "technology forecasting" will be included in the term "techno logy assessment."
Definition:
Technology assessment is the process of taking a
purposeful look at the consequences of technological change. It includes the primary cost/benefit balance of short-term, localized marketplace economies, but particularly goes beyond
these to 'identify affected parties and unanticipated impacts in as broad and long-range fashion as possible. It is neutral and objective, seeking to enrich the information for management
decisions. Both "good" and "bad" side effects are investigated since a missed opportunity for benefit may be detrimental to society just as in an unexpected hazard (Carpenter, 1973, p.
41).
Energy technology assessments are generally conducted using assumptions, methodologies, and data that can considerably bias the results. "Moreover, unless and until Technology Assessment is seen in a broader social and philosophic framework, it is bound to be a one-sided apologia for the prowess of existing technology. Genuine Technology Assessment must be essentially critical, not apologetic, with regard to technology" (Skolimowski, 1976, p. 421). Skolimowski says that
technology assessments are done by technicians while paying lip service to "social aspects." He adds that "methodology takes precedence over values and we gently ride on the high horse of quantitative techniques toward the instrumental paradise" (ibid., p. 424). This point, that the assessing of a system should be done by those outside of the system to remain unbiased, is difficult to achieve in practice because those with expertise about technologies will naturally have invested considerable personal resources in those technologies and thus will tend to have
optimistic biases.
It is clear that either faulty assumptions, methodologies, or data can propound error. "Methodology expresses (and traces the implications of) core assumption reflecting the forecaster's fundamental outlook. Sophisticated methodology cannot save a forecast based on faulty core
assumption" (Ascher, 1979, p. 149). William Ascher stresses the importance of-the assumptions ccmpared with methodology: "The development of greater methodological sophistication has not
significantly improved forecast accuracy. The (often [greater than] linear) deterioration of accuracy with lengthening of forecast time horizons proceeds regardless of method" (ibid., p. 149). However, the complexity and large data requirements for a methodology are not
inherent in the methodology. "It is the real-world situation and not the methodological analysis which presents the complex interrelationship and the necessity of a large data pool. No model nor methodology can greatly simplify a complex situation without losing some validity" (Bareano, 1972, p. 189).
It is instructive to compare technology assessments conducted by institutions with the differing special interests of those
institutions. A university study done from a national point of view would likely have a different goal orientation than a corporation or private interest (Humes, 1974, p. 145). Also, assessments may be undertaken to gain support for a favorite project or decision already reached. "Thus it is important to know not just how a forecast was made, but why it was done as well, in evaluating its worth" (Kiefer,
1973, p. 140). These considerations are the motivation for this study, which includes a systematic investigation to determine the areas and extent of biases in energy technology assessments. Both methodological
and data biases are evaluated, primarily through the use of equally defendable or superior alternative methodologies or data.
2.1 Historical Perspective
It is interesting to look at past technology assessments in order to see what not to do. History provides us with many examples of
technological innovations that were total failures simply because of incomplete technology assessments. Many of these past technology
assessments "...have been undertaken in response to a specific problem created by the introduction of new technology into society, rather than
in anticipation of innovation... Assessment in the past has often been on a trial-and-error, hit-or-miss basis, with little perspective beyond short-term hazards, opportunities, and alternatives. It has viewed the future narrowly--if at all--as no more than an extension of the
immediate past" (Kiefer. 1973, p. 137). Looking back 75 years, experts might have predicted that a gasoline-powered machine would replace the
horse-drawn vehicle. But it is unlikely if they could have anticipated that the automobile would be directly responsible for one out of every
seven jobs, that it would kill 60,000 U.S. citizens each year, and that it would cause significant impacts on public health via the emission of harmful air pollutants (Jones, 1973, p. 143).
Clearly, we are idealistic and naive if we suppose every nuance of a future technology can be predicted. "To use a historical example, it is
doubtful that, given the time and manpower..., we* could have predicted the contribution the elevator would make to traffic congestion in cities
(assuming continued reliance on individual transit). It is these highly indirect impacts which are, of course, the hardest to foresee and which sometimes have the most far-reaching effects upon the society. They usually become evident only after prolonged experience with the
technology..." (Humes, 1974, p. 156).
No technique of assessment can really envision the flashes of innovation or the unpredictable discoveries which lead to great technological change. The occurrence of technological breakthrough really cannot be predicted. For example, an aircraft industry
researcher of the 1940s would have predicted the maximum air speed of a prop plane based on the theoretical limit being the speed of sound. He
could not take into account the advent of the jet engine.
Another great deterrent to technology assessment is technological dependence upon sociopolitical influences. "The fundamental difficulty
in foretelling social and political change--or of even divising meaningful social indicators for measuring such changes
statistically--remains a serious obstacle not only for technological forecasting but for technology assessment as well" (Kiefer, 1973, pp.
139-140). Value systems of society and political authorities are hard to define, and even harder to describe how they will change with time.
2.2 Alternative Methodologies
There are numerous methodologies for technology assessment. Some may work better than others but still depend heavily on the core
assumptions. The Delphi technique "...is designed to apply the 10
collective expertise and intuition of a panel of anonymous experts by developing a consensus through several steps of systematic questioning and polling about future events. The polling process is carefully organized so as to minimize the biases that might otherwise arise from
interacting personalities or other psychological influences within the expert panel" (ibid., p. 138). Delphi techniques work best when
historic data are unavailable, sociopolitical considerations are needed, or qualitative or subjective information is necessary.
Other methodologies including parameter-fitting, curve-fitting, and structural-fitting are used when the appropriate data are available. A refinement of curve-fitting is the envelope curve technique (Kiefer, 1973, p. 138). A general curve is superimposed to a number of specific curves. For example, the maximum speed of transportation could be forecasted by superimposing a curve onto specific historical data of various modes of transportation. Curve-fitting is based on the
assumption that there are predictable trends in the manner in which "...the technology that will be put in use tomorrow is foreshadowed by the science of today or is a direct outgrowth of current technological
knowledge" (ibid., p. 138).
Other techniques include the jury system, market system,
cost-benefit analysis, and adversarial processes. The adversarial process facilitates the articulation of all relevant facts both pro and con. Unfortunately, this and other assessment methodologies, are
particularly susceptible to the biases in the situation where the
proponents of a technology have an advantage over the opponents because of organizational and financial resources. This is when technology
assessment becomes "...slanted in a subtle and often an explicit way in favor of the assumptions underlying the technological civilization, of which it is supposed to be an assessment" (Skolimowski, 1976, p. 422).
Figure 1-1 shows a generic seven-step methodology laid out by MITRE (Jones, 1973, p. 148). This scheme illustrates how assumptions are built into a methodology. Usually, the assumptions are not quite as evident.
Weighting schemes are frequently used in technology asessments, probably because of their easy implementation and easy interpretation. For example, one methodology computes a score for a technology and allows comparisons of technologies by comparing scores (Humes, 1974, p. 152). The weights are assigned by a panel of "experts" and thus the scheme is essentially subjective. "Even with detailed printed
instructions, examples and close supervision, it is impossible to enforce consistency of interpretation and scale on a group of diverse
individuals on the first round of assessments" (ibid., p. 154). There is nothing wrong with this type of subjective assessment, except that the highly quantitiative methodology sometimes presents the appearance of greater objectivity than is warranted.
An intuitive, hence subjective, method is scenario writing: "A scenario attempts to describe, in ,systematic but hypothetical and largely qualitative terms, the future sequence of events that would
appear logically to evolve, step by step through cause-and-effect relationships, from any given set of conditions or recognized trends. Enphasis is placed on those critical decision points from which
DEFINE THE ASSESSMENT TASK
Discuss relevant issues and any major problems Establish scope (breadth and depth) of inquiry Develop project ground rules
STEP 2 DESCRIBE RELEVANT TECHNOLOGIES
Describe major technology being assessed
Describe other technologies supporting the major technology
Describe technologies competitive to the major and supporting technologies
STEP 3 DEVELOP STATE-OF-SOCIETY ASSUMPTIONS
Identify and describe major nontechnological factors influencing the application of the relevant
technologies
STEP 4 IDENTIFY IMPACT AREAS
Ascertain those societal characteristics that will be most influenced by the application of the
assessed technology
STEP 5 MAKE PRELIMINARY IMPACT ANALYSIS
Trace and integrate the process by which the assessed technology makes its societal influence felt
STEP 6 IDENTIFY POSSIBLE ACTION OPTIONS
Develop and analyze various programs for obtaining maximum public advantage from the assessed technologies
STEP 7 COMPLETE IMPACT ANALYSIS
Analyze the degree to which each action option would alter the specific societal impacts of the
assessed technology discussed in Step 5
Figure 2-1 Various Stages in the Process of Technology Assessment
interactions between events and their environment. A single set of assumed initial circumstances can generate an entire family of related scenarios (or alternatively futures), any one of which may be plausible"
(Kiefer, 1973, p. 138).
"Normative" forecasting starts with some future need "...and
attempts to work backwards in time toward present capabilities so as to define the technological pathways and means by which a goal might be
reached and to identify the technological barriers which must be overcome in the process. The aim is less to prophesy than to "invent" the future, with the focus not on that which might happen but on that which should happen" (Kiefer, 1973, p. 139). It is clear that such an analysis can be highly subjective and rests on such assumptions as unchanging social values.
The role of methodology in technology assessment should be as a thinking and decision making tool. Assumptions and qualitative aspects
inherent in the methodologies should be viewed as flaws and pointed out clearly. If the public is going to take technology assessment
seriously, especially in the controversial area of energy, current methodologies and reporting techniques will have to change.
"Forecasters frequently seem more enthralled with the entertaining tasks of model building, manipulating and massaging series of data, and
imposing some'sort of formal stylized structure on the seemingly random process of scientific discovery and technological innovation than they are with the more mundane chore of explaining to the wrld outside what their studies and speculations are all about or how they might find
practical application. Increasingly sophisticated and complex
methodology may appear designed, as a result, less to make forecasting more reliable and rational than to conceal its shortcomings and veil its relevance to the world at large" (Kiefer, 1973, p. 140).
2.3 The Role of Uncertainty
Uncertainties in technology assessments become very important when comparing different energy technologies. Many uncertainties are beyond the scope of a technical assessment, for example, those uncertainties that result from national priorities shifting substantially over short
intervals. Such a shift within our recent experience is the fast-rising concern over energy issues, at the expense of a rapid deemphasis of the space program.
There are, fortunately, many uncertainties that are amenable to treatment within current technology frameworks. Where the accuracy of forecasts often deteriorates linearly with time, one can set rough confidence intervals. Also, much can be done to use data that is as current as possible. Using outdated data propounds error
unnecessarily. But there is "...uncertainty as to whether recent data actually represent a new pattern that negates the old assumption"
(Ascher, 1979, p. 152).
Probably the greatest uncertainty in technology assessment, and the hardest one to reduce, is due to sociopolitical factors. The nuclear power industry is a good example of this. "The greater uncertainty in forecasting technological developments requiring political decisions and
large-scale programs indicates the importance of improving
sociopolitical analysis. The social indicators and scenario approaches are two means for achieving this improvement" (Ascher, 1979, p. 149)
William Ascher lists three types of uncertainties in technology assessment in order of increasing uncertainty (Ascher, 1979, p. 153):
I. Smal.lest disperson: Technological areas in which advancement
depends on engineering refinements and the disaggregated market diffusion of such innovations.
II.
Less certainty: For predictions of advancement in large-scale programs, the political aspect adds an additional degree of uncertainty to that already surrounding the technical
feasibility of the programs. III.
Most uncertainty: innovations requiring basic scientific breakthroughs.
2.4 Assessment Methodologies amd G4eral Assumptions
In technology assessment the methodologies and the assumptions are usually so intertwined that it is not possible to discuss them
separately. Since the methodology can be viewed as the framework of the assessment, as well as the vehicle of the principal assumptions, the alternative methodologies will be treated first.
It is an extremely difficult task to try and characterize the range of all possible energy technology assessments. Part of this difficulty
is due to the scattering of the methodologies into apparently every possible analytic direction. The rest of the difficulty stems from the
lack of any real formalism to the modeling science. As an attempt is made here to develop some of this formalism. Figure 2-2 illustrates a
desirable qualities in an energy technology assessment. One possible starting point for the discussion of methodologies comes from the
natural origin for all modeling activities: a definition of objectives. "It is difficult to to make a simple statement of the purpose of
integrated assessment; there is a hierarchy of objectives, and the order will change with time and will contain hitherto unknown dimensions. Broadly speaking, there is a need for the timely development of relevant
knowledge and its diffusion to a broad audience -- but especially to the general public, regulators, scientists, and engineers" (Gruhl, 1979). The research and academic communities for generally responded to these
needs by identifying complex energy technology assessment methodologies, with few actual applications.
Modeling undertaken in an application-oriented, integrative context (i.e., the synthesis and integration of current
knowledge) has a better chance of facilitating decision making than modeling undertaken as basic research. This is not to belittle the role of basic scientific research, but to suggest that modeling must be undertaken with different and perhaps more pragmatic objectives (SCOPE, 1976).
From an examination of the literature it appears that another natural starting point in the investigation of a technology assessment comes from the data used to characterize the Performance Measures of the Technologies, as shown near the center of Figure 2-2. There are two types of assumptions that pervade the choice of these performance
measures. First is the Value System used by the assessor/modeler. Few authors of the assessment literature have reorganized the inherent bias in the types of performance informations that are collected about the technologies. The principal focus of the capabilities of a model is
Performance Measures
^f 1^4-
Calibration (Historical Fit, Judgmental)
-Static (constant)
-Trend (function)
-Uncertainty (function with
uncertainty or family of
curves)
Energy System Context
-geographical resolution -temporal resolution
S(static, lyr, 20yr)
-informational resolution
Figure 2-2 General Methodological Framework for Energy Technology Assessments
Decision Rules -Simulator (no decision) -Optimizer Deterministic Probabilistic -Judgmental Delphi -Decision Tree -V Non-Energy System (parameters or models) -Economics -Environmental -Social __ __ tI
I
fixed at the point when data is collected about the technologies. The academic and professional backgrounds of modelers also bias the modeling procedure at this stage, due primarily to familiarities with sources and techniques for handling certain types of data. It would be instructive for modelers to begin their modeling activities by stepping back and
taking a global perspective to their assessment problem, and documenting the motives for including or excluding data of certain types such as data types listed in Table 2-1.
The second assumption of great importance to the performance characterization is the extent to which the performance measures are coupled to energy system requirements. The most simplistic technology assessments just provide evaluations of performance that are not in the context of the specific needs of the energy system. Whether the
technology is to be added to some local area, or to be added massively nationwide, it can be the most dominant part of the assessment to evaluate the manner with which that technology can both respond to the peculiarities of the other energy supply sources. Recognizing this need, several modelers have provided coupling of the performance
measures and the energy system, again as shown in Figure 2-2. Of lesser importance, fran the standpoint of energy technologies, is the extent of coupling of the non-energy system to both the energy system and the performance measures (e.g., might there be rate-constraints on the availabilities of certain materials or manpower). The method, format, and data used for the construction and calibration (also shown in Figure 2-2) of the performance measures, energy system model, and non-energy
Table 2-1
SOME OF THE VARIOUS DISCIPLINES
THAT HAVE BEEN ASSOCIATED WITH ENERGY RESEARCH (Gruhi, 1979) Economics Policy Analysis Decision Analysis Operations Research Management Law Institutional Analysis Energy Planning Energy Engineering Analytic Chemistry Seismology Mining Transportation Atmospheric Dispersion Hydro logy Waste Management Land Management Ecology Environmental Management Health Studies Psychology Sociology Demography Urban Studies
system model, provides another key difference between various energy technology assessments. The concept of uncertainty could generally introduce itself at this calibration stage, being represented by probabilistic characterization of inputs and parameters in the assessment models.
For some reason the Decision Rules portion of Figure 2- 2has
presented the principal preoccupation of technology assessors. Perhaps it is because it is usually the non-engineers that conduct assessments and the Decision Rules segment represents the primary part of the
assessment that does not deal with engineering problems. Table 2-2 (Gruhl, 1979) shows many of the modeling technologies currently
available and it can be seen that any of these can probably be used to capture the essence of the decision rules.
Again as shown in Figure 2- Z the Value System, or the manner of measuring desirability, of the modeler will impose itself strongly on the selection of the Decision Rules. Even for models that do not include decision logic, there are value systems implicit in the types and displays of outputs. Some value systems that have been used in energy/environmental models include:
o Bureaucratic (exhaustive) display, o Noninferior sets,
o Multiattribute decisions,
o Infinite value or uncompromised protection, o Cost-benefit or economic optimum, and
Table 2-2
Methodologies Available for Representing the Decision Rules for a Technology Assessment
Static Optimization o Linear Programming o Nonlinear Programming
o Integer and Mixed-Integer Programming o Gradient Searches Dynamic Optimization o Dynamic Programming o Dynamic Parametrics o Optimal Control o Stochastic Optimization o Algorithmics Simulation o Descriptive, Prescriptive o Holistic, Causal, Normative o Continuous, Discrete
o Stochastic Representation o Parametric Analysis
o Allocation and Equilibriun o Input/Output
o Econometric, Trend Analysis o Regression o Organizational Modeling o Interpretive Structural Nonmodeling o Judgment Eristics o Expert Opinions o Hedonic o Decision Analysis o Individual Behavior
o Bidding and Simulation Games o Cross-Impact and DELPHI
In addition, each of these systems can be operated with or without explicit quantifications of the risks involved in the decision-making process. The obvious problem with value systems is that impacts not predicted by the model will carry no weight in the model's decisions. Extremely important issues such as stability of the establishment, survival of the private electric power sector, or intergenerational equity therefore generally are not considered in models because
vulnerability to foreign disruptions, infrastructure problems,
intervenor effects, and public perceptions of problems are not included in model outputs.
Despite the obvious importance and uncertainty inherent in the Value Systemn, we found no models that offered alternative system nor discussed the biases of the system presented. In an assessment it would seem to be very important to be able to separate the "value judgments" from the methodology. An assessment technique will not be useful if the user cannot use his own value system or clearly see the author's.
L. Thiriet urges the use of caution when dealing with quantified sybjective judgments: "We feel that one's first concern should be to make the method used acceptable both to the authorities and to the
public. (We think the influence of the public should probably only increase in the future). One should therefore avoid resorting to too hermetic a language, using a too complicated system of notations,
aggregation, evaluation of probabilities. This would save one from the temptation of believing in the rationality of choices in the field of
of non-rationalizable elements. Moreover, the results of such a sophisticated study would not convince the public" (Thiriet, 1974, p. 230). L. Thiriet prefers a study that "...avoids all quantitative value indicators which would risk letting the reader in a hurry believe in a rational and scientific estimation. It should, on the other hand,
suggest options judged preferable to others by arguing -- one might also say by pleading -- in a sufficiently detailed manner to allow the
authorities to make their decision by the light of a clearly expounded document" (Thiriet, 1974, p. 233).
2.5 Imbedded Assumptions
Ascher points out the importance of assumptions: "It must be
recognized that behind any forecast, regardless of the sophistication of methodology, are irreducible core assumptions representing the
forecaster's basic outlook on the context within which the specific trend develops. These core assumptions are not derivable from
methodology; on the contrary, methods are basically the vehicles, or accounting devices, for determining the consequences or implications of core assumptions that were originally chosen more-or-less independently of (and prior to the method)" (Ascher, 1979, p. 150).
Ascher states that forecast accuracy is dependent on the core assumptions and the methodology is obvious or secondary when the
assumptions are valid. A methodology cannot redeem a forecast based on faculty core assumptions. One source of faculty assumptions is due to the specialization of most forecasters. Obsolete assunptions are
the broad context of the assessment. This is why a panel of experts can be so effective for interdisciplinary technology assessments.
"Since the choice of methodology, which largely determines the cost of the study, is not as crucial to forecast accuracy as is the
appropriate choice of core assumptions, recent inexpensive studies are likely to be more accurate than older, elaborate expensive studies.
...multiple-expert-opinion forecasts, which require very little time or money, do quite well in terms of accuracy because they reflect the most
up-to-date consensus on core assumptions. When the choice is between fewer expensive studies and more numerous, up-to-date expensive studies, these considerations call for the latter (Ascher, 1979, p. 152). More
emphasis should be placed on establishing core assumptions and testing their validity.
In most energy technology modeling a deterministic approach is used. This study contends that there are often unacceptable and
unnecessary assumptions involved in such an approach. A probabilistic approach would be inherently less biased and the appropriateness and difficulties of its use will be discussed. In addition, in the use of
nonlinear models, deterministic approaches may have significant errors even with respect to expected values. When the inherent risk aversion in the energy decision process is also factored in, it should be clear that deterministic approaches must be very crude or inappropriate.
Another caution in using probabilities in technology assessments is "Maintaining uniformity and consistency of interpretation...; it is the great weakness of methods based on quantified subjective judgments" (Humes, 1974, p. 152).
A major advantage of a probabilistic scheme would be in dealing with a complex model with many inputs. For example, it seems clear that
decisions based on multiplying probabilities (assuming independence of parameters) would be inherently less biased than decisions based on a complex document stating all the relevant issues. It would have to be made clear how the probabilities were arrived at and any uncertainty in
independence of parameters would need to be discussed. Another advantage of a probabilistic scheme is the ability to quantify
uncertainty. Thus uncertainties could be traced through the model, and proper attention could be focused on parameters needing most reduction
in uncertainty for decision making and RaD planning.
Energy decisions are inherently risk aversive due to the inelastic demand for energy and the long time lags associated with increasing
supply. However, most technology assessments use deterministic
approaches which lead to the use of an expected value in fuel pricing, supply, etc. But the use of an expected value is at best only
appropriate in a risk neutral analysis. Thus, for energy analysis, a probabilistic approach would be much more appropriate due to the
availability within such an approach of the capabilities for incorporating inherent risk aversion.
Another imbedded assumption in most technology assessments is the level of detail or resolution at the decision points of the model. This resolution is of three types:
(1) geographic (2) temporal, and (3) informational.
The first two types of resolution are quite obvious. It may be less obvious that models may work at two or more levels of resolution, performing computations at one level of resolution, then aggregating those results to yield outputs or information for decisions at broader
levels of aggregation. Informational resolution is the final type of detail that will be mentioned. Aside from the disciplines that are included in a model's methodology, the model builder is faced with myriad decisions and implications concerning the types of information that are carried in model components and linkages. Unfortunately, three of the principal criteria used for the selection of information to be
incorporated are: 1) availability of data, 2) computational burden, and 3) the degree of amenability of this information to the chosen modeling methodology. Ideally the criterion for selection should be the
information's relative importance to the policy applications of interest. 2.6 Review of Assessments and Conclusions
In this study, a systematic investigation was made of energy technology assessments to evaluate their effectiveness. Most of the assessments studied contained significant flaws in assumptions, methodolo-gies, and/or data bases. In addition to assumptions usually being hidden
in the methodology, most technology assessments were biased in some way because of special interests. Such a biased approach is not "wrong", it is just inappropriate not to have the assumptions and interests of the assessor pointed out clearly so that the biases can be separated from the assessment. Even though probabilistic assessments have potential problems in implementation and interpretation, their use in a complex
analysis seems more appropriate than the use of a deterministic approach. Meteorological factors must be considered to address specific
power plant siting problems. A technology assessment that applies national average meteorological characteristics to a specific site will most likely be biased against the fossil-fueled technologies. A much more accurate analysis would result by capturing the characteristics of
the specific meteorological conditions at specific sites.
Atmospheric transport and dispersion modeling used in technology assessments are generally very inaccurate. It seems clear, from the studies reviewed, that the simplifying assumptions used make the pollutant concentration estimates too crudely. What is needed is an uncertainty bound rather than a specific value. In that way, models using dispersion results (e.g. health models), would be much more useable in the po.licy'environment. It is difficult to have confidence in health model results, for example, when the dispersion model used is known to be inaccurate but does not give uncertainty bounds.
Popul.ating densities and locations must also be carefully charac-terized to properly address specific power plant siting problems.
An ideal specific siting analysis would include specific meteorological, and specific population data as well as including an uncertainty bound on the dispersion modeling results. In large scale technology assessments where it would be inappropriate to model all available sites, it would seem to be important to have several categories of generic sites for use
in the analyses.
Current health modeling contains many more uncertainties than any other portion of the technology assessment process. However, health
model results are used for policy decisions, many times with little
knowledge of the uncertainty. Of the 255 health impact articles surveyed the majority showed that there was no impact on health from community air pollution levels. Furthermore, some of the articles showed
bene-ficial effects of air pollution. Most of the 30 models available in that literature showed severe data and statistical problems. It seems apparent that the health impacts that have been used in past technology assessments can at best be construed as slight hints of what might
possibly be the worst case health impacts. At worst these estimates are misleading and their use is counterproductive in the assessment process.
It seems clear that adequate measures of the uncertainties in these models would be extremely important for conveying the levels of speculation
associated with any numbers that are turned over to the policy decision process.
R&D priorities should be set up in such a way so as to reduce the uncertainty in energy technology assessments. Obviously, where the greatest uncertainty lies and where this uncertainty crosses over into critical decision areas, is where the most urgent research is needed. Probabilistic methodologies can be implemented to provide precisely the necessary probabilistic information that is necessary for developing priorities on R&D funding strategies. Here again it would appear that the information about uncertainty is more important than the expected values.
3. AEGIS SIMULATION MODEL
This simulator should be viewed as a framework for assembling and manipulating information about the economics, emissions, ambient
concentrations, and potential health impacts of different types and configurations of electric power generating facilities. The framework is probabilistic, and thus results in several measures of the range of various consequences, in other words, a graphic display of the quality of the various predictons.
Ths Aegis model, apart from the other areas of research on this
project, is a relatively small scale effort, receiving about 800 man-hours of funding. Much of this time has been spent on the encoding of the
simulator, with some student and researcher time focused on the collection of data. This section ofthe summary report is intended to give a
summary of the structure and structural issues related to the model. Additional detail and data within the model's framework are frequently changed and thus are left described in the annotated listing of the computer code. The latest version is available upon request, and although this version will change, it is hoped that the structural
issues related in this section will remain valid through the future series of revised model versions.
3.1 Summary of Capabilities
This document contains discussions about a computerized tool for predicting the economics, resource uses, emissions, ambient concentration, and health impact levels from combinations of:
1) fuel types and sources, 2) pretreatment equipment 3) generation equipment 4) abatement equipment
5) site types for different dispersive potentials, 6) site types for different population densities, and 7) available health effects models.
The framework of this mechanism has been the principal focus of this portion of the project, although a number of existing government and
industry sources have been searched for data relevant to this mechanism. Some of the structural issues addressed have included:
1) types of components that should explicitly be incorporated, 2) mechanisms for modular addition or updating of data,
3) generic pieces of information that could easily be used for testing and simple exercises,
4) specific air p(llutants that should be collected within the simulator,
5) the treatment and display of probabilistic information and models, and finally
6) means for evaluating the validity of complex computerized models.
The majority of this part of the project was spent on the structural
issues previously listed. The data base, thus, is the weakest portion of this project, and any uses of the simulator should be carefully
augmented with a study of the adequacy of the underlying data. Fortunately, it is not difficult to update the data base in any of the sections of
the simulaitor.
First, it is important to understand the basic structure of the model. All of the quantities collected or manipulated within the model correspond
to actual physical flows. Figurea-Ishows some of these flows that take place in the standard use of the model. There are two principal advantages
Constituents of Fuels
fuels, probabilistic -- .. fuel characteristics
Probabilistic , Pretreatment1
performance -
-models - -- - fuel characteristics
Probabilistic .-- -~ Combustion i performance
models and costs emission characterization
Probabilistic
C
Abatementperformance
-models and costs emission characterization
Deterministic . Atmospheric
-models Dispersion and
models Transformation ambient characterization Deterministic --- Population s Density inputs . . exposure characterizations Deterministic Environmental models Impacts impact characterization
of such a "physically significant" framework, namely:
1) all of the data requirements correspond to real measurements that can be made, and
2) the structure is simple enough to allow for a quantification of the profile of the uncertainty associated with any of the flows or eventual outputs.
It is not immediately obvious what types of internal variables must be collected to ensure the appropriate performances of the various options, and this has been an area of considerable effort in tnre setup of the
framework of the current model version.
Although there is considerable unevenness in the qualities of the different data, Table 3-1 to 3-5 are a listing of the modules which
are in place in the current version of the simulator.
The question of accuracy, or validity, is paramount in the minds of informed users of any large computerized models. An extensive undertaking into the area of model validity has been conducted as part of this project. The conclusion was that the ideal situation would be to quantitatively display the validity of all outputs as a normal course of the report generating phase. This has been accomplished in this project, and may be a unique and important aspect of this project.
In closing this subsection it is important to list briefly some of the obvious limitations in the use of this model as well as some
of the potential application areas:
Model Limitations
1. No background pollutant concentrations (nonlinear health models are not accurately usable)
2. Not a design tool - designs are fixed at attractive options
3. Not a financial model
4. Air quality projections are sinplistic, as in screening models 5. Correlations not immediately evident - e.g. capital costs
Table 3-1 Fuel Module Options
D0101 Free Fuel and Geothermal
D0102 National Average Bituminous Coal D0103 Midwestern Penn Bituminous Coal D0104 Pittsburgh Seam Bituminous Coal D0105 West Virginia Bituminous Coal D0106 Eastern Ohio Bituminous Coal D0107 Eastern Kentucky Bituminous Coal
DO108 Western Kentucky Bituminous Coal D0109 Illinois No. 6 Bituminous Coal
D0110 Southern West Indiana Bituminous 3Coal D0111 Mississippi-Oklahoma-Texas Lignite D0112 Western Colorado Coal
D0113 Wyoming Subbituminous Coal D0114 Western Dakotas Lignite
D0115 East Central Montana Coal
D0116 Narragansett Anthracite Coal DOll7 Nuclear Fuels
D0118 Domestic Light Turbine Oil D0119 Average Domestic Residual Oil D0120 Venezualan Residual Fuel Oil D0121 Shale Oil
D0122 Natural Gas
D0123 Solid Waste Municipal
D0124 Solid Waste Forest Residual
D0125 Solid Waste Agricultural Residual D0126 Biomass Plantation Fuel
D0127 Vacant
D0128 Vacant D0129 Vacant
Table
3-4
Combustor/Generator Module OptionsD0301 Coal Direct Conventional Combustion D0302 Fluidized Bed Atmospheric Standard D0303 Fluidized Bed Atmospheric Low Pollution D0304 Fluidized Bed Pressurized Standard D0305 Fluidized Bed Pressurized Low Pollution D0306 NHD Open Cycle
D0307 IID Closed Cycle
D0308 Coal-Oil Slurry Combustion D0309 Combined Cycle Coal No. 1
D0310 Combined Cycle Coal No. 2 D0311 Combined Cycle Coal & Low BTU
D0312 Combined Cycle Coal Oil D0313 Combined Pyrolysis Coal D0314 Fuel Cell Phosphoric Acid
D0315 Fuel Cell Molten Carbonate D0316 Oil Direct Fired Combustion D0317 Gas Turbine Conventional D0318 Gas Direct Fired Boiler
D0319 Light Water Reactor Pressurized D0320 Light Water Reactor Boiling
D0321 High Temperature Gas Reactor D0322 Liquid Metal Fast Breeder Reactor D0323 D T Tokamak Fusion Reactor
D0324 Waste-Coal Mixture Direct Combustion D0325 Waste or Residue Direct Combustion
D0326 Hydroelectric
D0327 Low Head Hydroelectric
D0328 Wind Two Blade Device
D0329 Wind Verticle Axis
D0330. Solar Thermal Central Open D0331 Solar Thermal Closed Hybrid
D0332 Solar Photovoltaic Silicon D0333 Solar Photovoltaic Cadmium
D0334
Geothermal Hot WaterD0335 Geothermal Two Stage Flash D0336 Geothermal Multi-Stage Flash
D0337 Geothermal Steam Flash Hybrid
D0338 Ocean Thermal Submerged D0339 Ocean Thermal Ship D0340 Ocean Thermal Spar
D0341 Wave Power
D0342 Tidal Power
D0343 Vacant D0344 Vacant
Table 3-3 Miscellaneous Modules
D(2 PPETIPEATNENT MODULE
D0201 NONE
D0202 PIIYS COAL CLEAN 3 BENEFI
D0203 PHIYS COAL CLEAN 4 BENEFI D0204 SOLVENT REFINED COAL D0205 COAL LIQUEFA ION FUEL D0206 OIL DESUIJFUPIZATION D0207 VACANT
104 AIfiI'rIVE ODUL.E D0401 F'1.
1)0402 1AV I.II:S'(FTNE NO 1359
OS ' A 1 ICIII ATi. AIATI':IE"NT NOI)II L I:0'501 N:rt. F
D0502 .A '( ,; JI Ti E
1D05j3 9(, ' 1 '(:1 I'OSTATIC PPECIP
10504 .997 / t':c:(rPOSTATIC PlTCP ,0505 PIlC' 11Tt'lSITY IONIZEP
BC(6 '1 I'P. AF ATIE4LNT r'('UI.E
1"O601 NONF
1)0602 SCU'IEEl I IEST Ti .'OVAWAY (0603 SC('Tl''F I.IP;NE T'II'OV'AIAY 0)064 VCI1!P. IC (0 PTCENEfAPI F
f)(1605 N(Y J I."oVAI SCI'UIBEIP
D06, I;13 CTA'I.Y'IC NOY PEfOV
1)07 AIPOSPIFIC fOl(il P
1,0701 STAtrI)APDr DTIi lI'TO SC(Al.
I',702 1 (W 1 1)11 ITION SCAT I,
')(703 101 2 I)I1.ITION SCALE
1.(704 1,O' 3 1) 111T ION SCAI F
l'(.7U5 1 00 4 D011TION SCAIF
],070, LOL 5 DIllITION SCALE L'077 11I0l(: 1 i L.UTION SCALE
1+7 jr PICH 2 DILIIUTION SCATE
1107(09 PI' (I! 3 I1)1.'T 10 SCAIIE j,)j710 Ii I(' 4 I1 IT ION SCAIT I
P0(711 1(1' 5 1Ill!TION SCAI E D0712 VACAI~!
[DOF Al' I oci'irICAI M'II.E 10P.0 I Nr.o sUI A l
I)OP(12 S1 Il FA.T [ON AS+I'W)OI*A'IKN L0P,0O3 VO Pl'OTOC01VrI(Al
DOFg04 PI!OTOCIrEVICAI. SHC 1'ODFI1. I'd,0, 05 M0 (I'CA KI(C
Du f, W (11TAIKIC AEIITCI(EI'JCAT. WX)9 (DflWY*APPIIC t*0I)ULE
1)0901 AV OIF' AlTl. DENSITY PATT P0902 IF-DIA!" 1OTNT IN .19U) EST
D)0903 7 lot' I' 1 970) A(TUAI. J1090/, CAl \' CLIFF S IN 1 970 1)01105 1*10.)tt IN .14~80 L~ST BAT I P0906) FAIY Ir 1972 ACTUAL. H 9f '7 JIANFV) llb 11 19) [ST IATI D0908 VACANT~
Table 3-4 Chemical Pollutant Health Effects Models D1001 None
D1002 Average of All Chemical Health Models
D1003 LAMPI - Linear Additive Mortality IModel
D1004 Amdur Synergistic Toxicology Model
D1005 Bozzo Linear 1977
D1006 Buechley Model D1007 Carnow Meier 1973
D1008 Chapman Shy 1973 D1009 Chess 1976 Eodel
D1010 Crocker EPA Linear Model
D1011 Ferris Model
D1012 Finklea 1975 Model D1013 Glasser Greenburg Nodel
D1014 Goldstein Block 1974 1,bdel D1015 Gotchy Linear MIodel
D1016 Gregor 1976 Model
D1017 Hamilton Brookhaven Mi;odel 1973 D1018 Hamilton Nanne 1967
D1019 Hexter Goldstein 1971 lModel
D1020 Hickey Boyce Trace Element Model D1021 Hodgson l.odel
D1022 International Inst Applied Systems Analysis Model D1023 Kitagawa Hauser Linear 1973
D1024 Koshal Log Linear 1973 D1025 Lambert 1970 Model D1026 Lammers Schilling Fodel
D1027 Larsen 1970 Synergistic Model D1028 Lave Freeburg 1973 Eodel
D1029 Lave Seskin 1969 IModel
D1030 Lave Seskin 1972 Model Dl1031 Lawther Model
D1032 Lee Fraument 1969 Model
D1033 Lindeberg Model
D1034 Lipfert Linear 1978 Model D1035 Liu Yu Nonlinear 1979 Model D1036 Martin Bradley Model
D1037 McDonald Schwing 1973
D1038 Mendelsohn Orcutt 1978
D1039 Meyers Cederwall Nodel D1040 -organ Probabilistic Yodel D1041 Morris Noval 'Model
D1042 North Merkhofer NAS Model D1043 Riggan 1972 Model
D1044 Schwing .cDonald 1976 D1045 Smith Linear 1976 Model D1046 Thilly Cancer Toxic Iodel D1047 Thomas Linear 1973 Miodel
D1048 Winkelstein Linear 1967
D1049 Winkelstein 1Nonlinear 1967
D1050 Vacant D1051 Vacant D1052 Vacant
Other Impact Modules
11 I A IIAT ION I A il.rl! [ODULE
P1101 WNWE.
;1 102 AVE OF Al I [A POSE V0', 1 103 ji1 ! pAS 1972 Is0SF Fo(I,1
1 104 c(:FS ( r IC 1976 ) (,SE 'O) 1.: 105 t(;l1 I 976 lOS rc1':11"
II lu) EPSC rr:VIS. 1'77 OI'(l )1107 S t I 1-' -t'7( ) (:;: t'O EI.
D 01 -1 IASI-14vil 11', I' (, S.E }(1' 1)1 2 - (OTlEF IPtPAC. ,r U1 [I -111201 .(
11 202 AVE I OF A.AL (ST MODI.S I1203 IA}ITTON-FI n0I COWsT POD D1204 "I'N1L.ES.E COST ((. P(tI
P120)5 I AVE, SlISA't I 199 CoSTs
)12 I.AV. ,;I,SI'IP' 10172 (COSTS
0)1207 T'AT A(AIn'1 "S (COST P01),1
1 20() A'I-ONTAP All POll II!tFY
0I 12o9 AN('-A)J: 'O Al ITY INDE
D1 211) CI-C!EFFS, (C( :1PINEP' 1iNDL. S11211 CI'1-C(1f t'fT 1PlOP INDE'
1,1.212 1-VI-E1TT t f: MI 1 P. INDIY 1)1213 1AkI'T'EI S CIII I.X INDX
01214 A f -VI''TPl , All (IIAl. IND 1)1215 OPACI-OAIY Ii AIV I 1M 0)1216 IiPi)- 1i ' LI ADD INt.DEY
6. Dispersion, po.iulation, and health models are deterministic (mostly)
7. No particulate size distributions 8. Pre-specified storage capabilities
Potential Applications
1. For use in choosing among various fuels, combustors, abatement,
and site options
2. Defining uncertainties and potential risks in situations
3. R&D planning
4. Public awareness information
5. Pollution control cost-benefit analysis (e.g. for PSD BACT
arguments)
6. Ambient standards cost-benefit analysis 7. Cross-validation of health models
For a discussion of the development of the AEGIS structure and its limitations the reader should refer to (Gruhl, Nov. 1978). For a detailed understanding of the model the code his been annotated to answer a number of concerns. One detail that is not described in the code is the manner in which probabilities are concatenated.
The probahbilistic treatments in the current version of AEGIS are somewhat of an approximation. Before discussing how it is now
accomplished it is instructive to discuss how it should be done ideally. Beginning with the deterministic notation:
y = f(x)
where
y = the vector of model outputs, x = the vector of model inputs, and
f = the functional combinations of inputs that create the outputs. Now instead of constant deterministic values, suppose the inputs are specified as functions representing the probabilistic distribution of the values of the inputs, say _p. Likewise the outputs would then be
the inputs. Thus, the ultimately precise probabilistic formulation would be
The problem with this ideal method is that the functions cannot be precisely stored in a computer, thus a discretized representation of the
input and output are the best that can be used Xn, yn. In the
current version of the simulator there are five discrete points that represent the probablistic distribution, the points at which the probability of being less than that value is 0%, 16%, 50%, 84%, and
100%. Now the problem with these discrete values is that neighter f nor F is the appropriate transforming function. There are two possible
approaches to the development of the appropriate discrete transform. The first requires the fitting of functional relationships, from a set of generalized probability functions, to the discrete points. This somewhat
regenerates .p from xn and is termed x Now, assuming x. is very close to p
p v. F(xn)*
This p can be discretized to develop n. For a given set of
generalized probability functions it should be possible to develop a general formula, G, for obtaining the Yn.
n= )
The details of this have not been worked out.
The second approach is the more approximate approach and involves worst case analysis. Suppose m is such that m is 2,
that is the
minimum and maximum values of p.It is computationally quite easy, for any f, to determine the ym, that is, the minimum and maximujm
of yp, by simple tests using f over the range between the minimum and maximum, -m. Call this transform g:
What would ahppen if we were to operate g on n, n = 5; in fact does In 1Z g(xn),
that is
Y1,5 IM g(xl,5), Y2,4= 2(x2,4), Y3 q g(_3).
It can be thoughtout that Y1 and Y5 will be perfectly accurate. The middle point Y3 is not precisely the same as g(x3), but it does
happen that g(x3), while not the median, is the deterministic case, which has some value. The deviation points, Y2,4, are also not
precise, but they are very close. The advantages of this second approach are the ease of its implementation and the speed of its computation. 3.2 Input/Output Procedures
The input and output procedures for this simulator are quite
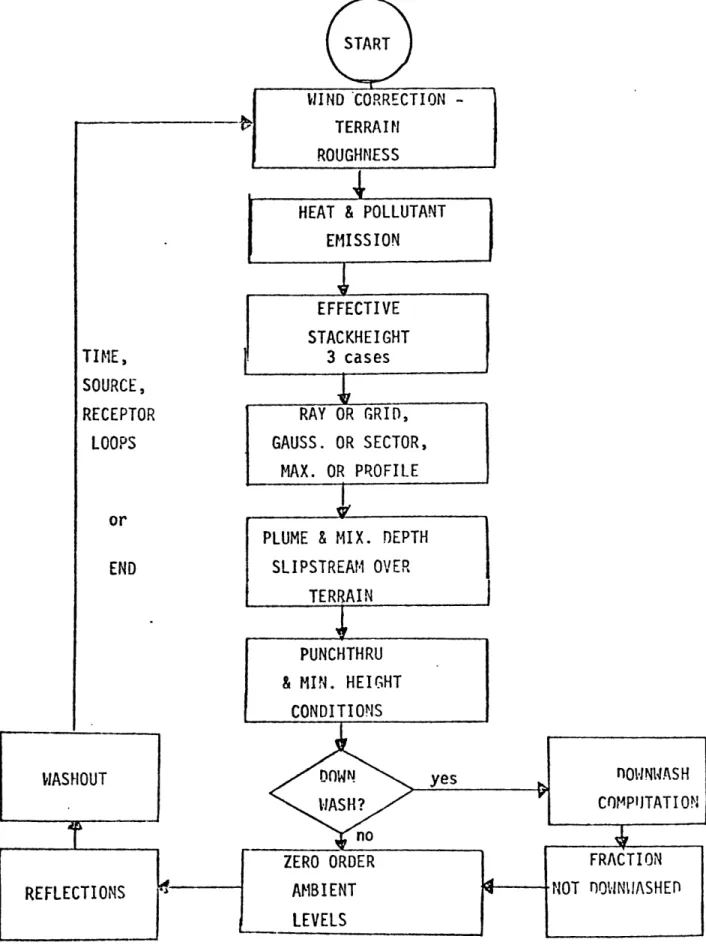
straightforward. For the sake of example, the procedures for the use of the interactive form of the simulator are presented. A flowchart of the
procedure is presented in Figure 3-3 showing the potential paths through the various subroutines in the simulator.
Table 3-6 displays the input information required to operate the model. This input informations is listed again in the beginning of the output report,so as to act as a formal record of the conditions for the simulation run. Table 3-7 presents the output from a sample simulation,
displaying the range of uncertainty associated with each of the 109 performance measures. Minus numbers, such as -1., or letters, such as NA, are indications that these are performance values that are not predicted by the particular modules chosen by the user.
Assimilating the important information from these long lists of performance measures could be a formidable task. It could be even more difficult to make a comparison of several alternative sets of performance measures. ,Some thought has been given as to how such comparisons and evaluations could be made. Although it has not been computerized, FigureS34represents a procedure that could be operated manually or possibly even examined for ideas about comparative techniques. 3.3 Status of AEGIS Modules
It was the original intent for the structure of this simulator to carry with it the documentation for every number and every
function in an on-line retrievable file. Table 3-3 shows the retrieval index; and Table 3-9 shows a sample of the way in which this documentation was initially intended to be set up. There were two major problems with this idea. First, the storage requirements for this material grew to the point where it was resulting in an unjustifiable expense. Second, all of the users initially interested in the simulator were only interested in the batch mode version. For these reasons the documentation is not now carried on-line.
It is appropriate here to discuss some of the general characteristics of the various modules. As shown in Figure3-1,the first module
encountered is the fuels module. For each different fuel type there is information about its cost, heat content, mineral and moisture contents,
Figure3-3 Flowchart of Procedures for the Use of the Interactive Version of the Simulator
NA = # Examples NB = Prob. Display NC = # Displays
ND = Max, Min or No Promptin
Table 3-6 Input Requirements
1. Facility Size (MWe)
2. Year Completed
3. Fuel Type
4. Precleaning Type
5. Generation/Combustion Type 6. Designed Capacity Factor (%) 7. Storage Capacity (MWhr)
8. Sorbent Type
9. Particulate Abatement Type
10i Scrubber Type 11. Stack Height (m) 12. Stack Diameter (m)
13. Meteorological Site Type or new Climatological Profile (16x8x6 Star frequency array)
14. Aerochemical Sulfation Type 15. Aerochamical Smog Type
16. Evaluation Radii Distances (default or 10 new radii in km) 17. Population Density Type or new Density Profile (by angle and
radii 16xi0)
18. Population Scaling Parameter
19. Reorientation of meteorological and Population Patterns (add 0 through 15 sector displacements)
20. Chemical Health Impact Model tupe 21. Radiation Health Impact Model Type 22. Pollution Index Model Type