HAL Id: insu-02078150
https://hal-insu.archives-ouvertes.fr/insu-02078150
Submitted on 14 Nov 2020HAL is a multi-disciplinary open access archive for the deposit and dissemination of sci-entific research documents, whether they are pub-lished or not. The documents may come from teaching and research institutions in France or abroad, or from public or private research centers.
L’archive ouverte pluridisciplinaire HAL, est destinée au dépôt et à la diffusion de documents scientifiques de niveau recherche, publiés ou non, émanant des établissements d’enseignement et de recherche français ou étrangers, des laboratoires publics ou privés.
François Leblanc, M. Benna, Jean-Yves Chaufray, Antoine Martinez, R. Lillis,
S. Curry, M. Elrod, P. Mahaffy, Ronan Modolo, J.G. Luhmann, et al.
To cite this version:
François Leblanc, M. Benna, Jean-Yves Chaufray, Antoine Martinez, R. Lillis, et al.. First in situ evidence of Mars nonthermal exosphere. Geophysical Research Letters, American Geophysical Union, 2019, 46 (8), pp.4144-4150. �10.1029/2019GL082192�. �insu-02078150�
1
First in situ evidence of Mars non-thermal exosphere
F. Leblanc1; M. Benna2,6, J.Y. Chaufray3, A. Martinez1, R. Lillis4, S. Curry4, M. K. Elrod2,7, P. Mahaffy2, R.
Modolo3, J.G. Luhmann4 and B. Jakosky5
1LATMOS/IPSL, Sorbonne Université, UVSQ, CNRS, Paris, France
2NASA Goddard Space Flight Center, Greenbelt, MD, USA
3LATMOS/IPSL, UVSQ Université Paris-Saclay, Sorbonne Univ., CNRS, Guyancourt, France
4Space Science Laboratory, University of California, Berkeley, CA, USA
5Laboratory for Atmospheric and Space Physics, University of Colorado, Boulder, CO, USA
6University of Maryland Baltimore County, Baltimore, MD, USA
2 Abstract:
Dedicated in-situ measurements of Mars' exospheric Ar density by NGIMS/MAVEN highlight profiles displaying two slopes altitude variation. Below 230 km, the Ar density is characterized by scale height of 13.5 1.7 km and above 400 km by scale height of 156 25 km. A comparison with the model HELIOSARES suggests that the most probable origin of the Ar non-thermal component is the collisional interaction, below the exobase, between the atmospheric Ar and the non-thermal O atoms produced by the dissociative recombination of O2+. These measurements therefore provide a new approach to
constrain one of the main source of Mars' atmospheric escape. They also lead to set up an upper limit on the efficiency of pickup ion sputtering at Mars. The comparison with HELIOSARES suggests that NGIMS detection sensitivity might allow a positive detection of this mechanism if more measurements at high altitude deep in the nightside are performed.
3 I Introduction
It has been established that the escape to space of the atmosphere of Mars through interaction with solar radiation flux and solar wind was a major driver to its past evolution (Jakosky et al. 2017). The MAVEN mission was tasked to shed light on how the solar mass and energy can lead to the erosion of the atmosphere (Jakosky et al., 2015). Among the processes that are suspected to be at the origin of this erosion are exothermic photo-chemical reactions in the upper atmosphere (McElroy and Donahue, 1972; Lillis et al., 2015) and the sputtering of Mars' atmosphere by heavy planetary ion picked up by the solar wind and precipitating into Mars (Luhmann and Kozyra, 1991). It is well-known that in the current epoch the major atmospheric escape rates are dominated by the photochemical process (e.g. Lillis et al., 2015). Nevertheless, the contribution of sputtering, which is potentially important for the early solar system conditions, remains of great interest.
In a past study, Leblanc et al. (2017) analyzed three periods of observation by the MAVEN/Imaging Ultraviolet Spectrograph (IUVS) of the UV atomic oxygen emission in the exosphere in order to understand its potential origin. They showed that the most probable origin of the non-thermal component, clearly identified in O 130.4 nm emission brightness profile (Deighan et al., 2015), is the photo-chemical reaction of dissociative recombination of the O2+ ion in Mars' upper atmosphere This
strong emission of dissociative recombination hinders all attempts to identify the expected much weaker signatures of present-day sputtering in the atmosphere of Mars using IUVS measurements of the emission brightness.
Bhardwaj et al. (2017) published a first report on the detection of an Ar non-thermal component as measured by MENCA and NGIMS. These authors analyzed two profiles from MENCA showing that the derived temperatures were significantly larger than expected. However this result provides only indirect evidence of a non-thermal component, in particular due to the use of measurements below 300 km and the difficulty of deriving reliable atmospheric temperature from wavy profiles (Terada et al. 2016). These authors also used six inbound Ar density profiles measured by NGIMS in February,
4
April and May 2015. Unfortunately, these profiles were improperly corrected for background contamination and noise. A reanalysis of the profiles (shown in supplementary material) used for their analysis showed that the parts of the profiles used in Bhardwaj et al. (2017) had a signal/noise ratio lower than one. As explained in the present paper, the data obtained using the original NGIMS mode of measurement cannot be used above 250 km without averaging many months of data.
Leblanc et al. (2018) simulated the density profile induced by the expected two main sources of non-thermal exospheric components. Their model computes the hot Ar density profiles at high altitudes produced indirectly by photo-chemical reactions or directly by sputtering. They concluded that suprathermal O atoms, produced on the dayside by the dissociative recombination of O2+, collide below
the exobase with atmospheric Ar atoms. This leads to the ejection of Ar populating altitudes above 300 km. While photo-chemical reaction is the major source of hot Ar on the dayside, it is a less efficient process deep in the nightside. Since Ar atoms ejected on the dayside are unlikely to reach ballistically the nightside regions, it is expected that sputtering by pickup ions precipitation (e.g. see Wang et al., 2015 and Curry et al., 2015 for model results) would be the dominant source of hot argon in the high altitudes deep in the nightside. As a result, we expect that the analysis of the Ar density profile that are measured by Neutral Gas Ion Mass Spectrometer (NGIMS) above 300 km would constrain the rate of dissociative recombination of O2+ and the efficiency of the energy transfer between the non-thermal O atoms and Ar
atoms on the dayside. It would also shed light on the relative efficiency of pickup ion sputtering at ejecting atmospheric particles on the nightside.
In this paper, we analyze the NGIMS in-situ measurements of Ar at high altitudes and characterize their dependence with Solar Zenith Angle (SZA). Section II presents the NGIMS dataset that were analyzed. In section III, we compare these Ar measurement to HELIOSARES model of Mars' exosphere.
II NGIMS/MAVEN measurements
NGIMS is a dual-source quadrupole mass spectrometer that was designed to characterize the composition and density structures of the upper atmosphere and ionosphere of Mars (Mahaffy et al.,
5
2015a). Typically, the open source of the instrument is used to characterize reactive species such as O and N. On the other hand, the closed source uses a thermalization chamber to provide a more sensitive measurement of non-reactive species such as CO2 and Ar. Due to the high instrument-induced
background, NGIMS provides reliable measurements of the two major neutral atmospheric species O and CO2 at altitudes above 300 km (Mahaffy et al. 2015b). However, owing to its very low interaction
with the internal walls of the NGIMS sensor, Ar observations exhibit minimal instrument-induced background, and can be achieved to very high altitude and a high sensitivity.
The residual faint background in the Ar mass channel (mass-per-charge m/z = 40) is mainly due to chemical contaminants and detector electronics noise. This background was fully characterized in August 2018 and an instrument’s detection limit of 22 cm-3 was established for the density of
atmospheric Ar. This background level was systematically subtracted from all the Ar measurements that are analyzed in this study.
To further improve the signal to noise ratio (SNR) of the collected Ar data, observations of exospheric Ar were organized in dedicated and systematic weekly campaigns starting from April 14th 2018. During each
campaign, NGIMS focused solely on sampling the mass channel m/z = 40 during the inbound leg of the orbits when the altitude of the spacecraft was above 300 km. These focused observations yielded Ar measurements at a 100 × the sampling cadence compared to the traditional NGIMS observations. Additionally, since July 2018, these NGIMS Ar observations were regularly performed to altitudes of 1200 km, which is higher than the 500 km used in the traditional NGIMS observations. In the following, we analyzed 74 distinct Ar-focused observations which cover a period spanning from April 14th 2018 to
November 12th 2018. These observations were collected during 19 campaigns of 5 (12 sequences) and 2
(7 sequences) consecutive orbits. Five of these observations cover the altitude range of 300 – 1200 km. The rest reach up to 500 km altitude.
We organized these set of measurements in an altitude - solar zenith angle (SZA) bins and plotted the resulting vertical profiles in Figure 1. As shown in the figure, during the April-November 2018 period, very
6
few measurements were collected at low SZA and low altitude. In fact, the dayside low altitudes were only covered by MAVEN during the first 5 targeted observations of April 2018. The remaining observations occurred while MAVEN periapsis was on the nightside. This results in a coverage that comprise relatively large SZA in the nightside. It is only at the end of September that a significant portion of the orbit of MAVEN above 400 km in altitude moved to the dayside.
Figure 1: Reconstructed density profiles of the Ar density as measured by MAVEN/NGIMS between April 2018 and November 2018. The colors correspond to increments of 5° SZA bins. Horizontal bars correspond to the one standard deviation uncertainty of the reconstructed density. a: SZA from 20° to 65°. b: SZA from 65° to 110°. c: SZA from 110° to 160°
As shown in Fig. 1, the Ar density were measured with SNR > 1 up to 1200 km in altitude when MAVEN covered regions with SZA < 110° (Figure 1b). Ar density were measured with SNR >3 up to 800 km when SZA < 90° is covered (Figure 1b). No density measurement with SNR >1 could be performed above 400 km in altitude for SZA >125 (Figure 1c)
The highest densities measured in the 600 – 1200 km altitude range were obtained for SZA >100° during the inbound portion of orbit 7540 (13th August 2018 with periapsis at 13:31) while covering the high
latitude region of the North pole. These densities were 2 – 5 × larger than the densities measured during the two consecutive orbits which covered nearly the same region. So far, we did not identify any variability in the plasma and magnetic environments that could explain this relatively rapid variation of the Ar density. One should note that significant increases of the CO2 and N2 atmospheric densities were
7
observed below 200 km on the same orbit. However, these densities were measured at a 30° lower latitude and closer to the midnight meridian than the observed Ar density enhancements that were seen above 600 km and at latitudes higher than 45°. At this point, based only on the available measurements, the origin of the rapid variation (in less than 5 hours) of the measured Ar at high altitude remains unexplained.
In Figure 2a, we display the densities in a two-dimensional SZA – altitude map. The densities measured during the 74 orbits are consistent with a density decrease as SZA increases from day to night (excluding the profile obtained during the inbound part of orbit 7540). This is particularly the case for measurements collected at high altitudes (excluding the aforementioned high altitude observation of orbit 7540). This SZA dependence of the high altitude density profiles should be further confirmed as more NGIMS observations are carried out. At low altitude (below 280 km), Mahaffy et al. (2015b), using the first months of NGIMS observations (Ls=290-340°, solar mean conditions), reported densities consistent with the present results with values around 106 Ar/cm-3 at 200 km decreasing with increasing SZA.
As can be seen in Figure 1, the Ar density profiles exhibit a noticeable change of slope above ~350 km. Below this altitude, Ar typically follows the expected barometric vertical profile with decreasing density with increasing altitudes. The scale heights of these vertical profiles are consistent with the one expected for the atmospheric Ar at temperature of 140 - 220 K for solar minimum (Bougher et al., 2015). Above 350 km, the high cadence/low noise Ar measurements of NGIMS reveal a much slower rate of density decreases with increasing altitude. These two distinct density trends are indicative of the presence of two Ar populations in the upper atmosphere of Mars. The first is associated with the thermal atmosphere and dominates below 350 km. The second is a non-thermal component that dominates above 350 km. While the Martian exosphere has been extensively observed by MAVEN since 2014, these new NGIMS in situ observations of Ar are the first to reveal the energetic dichotomy in the Ar exosphere, and provide additional new evidence that a significant portion of the atmosphere of Mars is being ejected to space by non-thermal processes.
8
Figure 2: Ar density (a) and scale height (b) measured by NGIMS between April and November 2018 (same as Fig. 1). The grey bins of panel a identify the regions covered by NGIMS measurements with SNR <1. The Sun is on the right side of each panel. Note that the planet is not represented at the correct scale.
Figure 2b shows the scale heights calculated for the altitude profiles that are displayed in Figure 1. The scale heights were derived from the density profiles over a 30 km altitude range for regions below 350 km. Above 350 km, a wider range of 140 km altitude was used. This calculation was repeated using other values of altitude ranges to demonstrate that the results displayed in Figure 2b were not dependent on this choice. This analysis show that the average scale height below 230 km is equal to 13.5 1.7 km and is equal to 156 25 km above 350 km. These scale heights correspond to temperatures of 216 27 K and 2800 400 K, respectively. When estimated for an altitude range between 120 and 350 km, the average scale height is 23 5 km. This corresponds to a temperature of 410 90K, which is significantly larger than the atmospheric temperature at lower altitudes, and probably reflects the fact that the population of Ar at these altitudes is already partially composed of non-thermal particles. A similar conclusion was reached by Bhardwaj et al. (2017) using NGIMS measured density profiles below 300 km
9
in altitude with incorrectly-subtracted background levels, rendering an accurate estimate of the scale height associated with the non-thermal component extremely difficult. The Mahaffy et al. (2015) value of 2746K that they derived from densities measurements of Ar, CO2 and O between 200 and 300 km
falls within our calculated range.
III Comparison between NGIMS Ar measurements and HELIOSARES simulation
To further analyse the measured Ar density profiles, we used the HELIOSARES numerical model. HELIOSARES is a set of coupled models that describe the dynamics of the space environment of Mars from its surface to its magnetosphere. HELIOSARES has been successfully used to characterize the oxygen component of the exosphere that was measured by MAVEN at different seasons and at various solar zenith angles (Leblanc et al. 2017). More recently, the model was used to calculate the expected increase of the exospheric density induced by pickup ion sputtering assuming the typical precipitating flux that was measured by MAVEN (Leblanc et al. 2018). The study showed that, deep in the nightside, the non-thermal component of Ar is dominated by particles ejected by pickup ion sputtering. This confirmed that Ar particle ejected by collision with the non-thermal O atoms produced by the dissociative recombination of O2+ on the dayside cannot reach large SZA, and cannot be produced locally on the nightside because
of its relatively low O2+ density (Benna et al. 2015).
To compare with NGIMS measurements, we modelled, using HELIOSARES, the density using the appropriate seasonal parameters (Ls = 270°) and for minimum solar activity which is consistent with MAVEN’s EUVM observations for the April – November 2018 period. In Figure 3, we displayed the density in the subsolar - midnight - North pole plane as simulated by HELIOSARES (roughly equivalent to Figure 2 plane). In the HELIOSARES model, three main sources of exospheric Ar can be identified:
- the Ar atoms ejected into the exosphere by collision with non-thermal O that were produced by the dissociative recombination of O2+ (Figure 3b).
10
- the sputtered component, which corresponds to Ar atoms that are ejected by pickup ions sputtering the atmosphere (Figure 3d). One should note that in the case of this simulation, we simulated O+
precipitating particles assuming the average dayside and nightside differential energy distribution of the precipitating particles that was observed by MAVEN/SWIA from 2015 to 2017 (Leblanc et al. 2018).
Figure 3: Simulated exospheric Ar density (in log10 cm-3) at Ls=270° and for solar minimum conditions in a
plane including the poles (the North pole is at the top of each panel), the subsolar point (on the right of each panel) and the midnight point. a: all components. b: Ar density induced by the collision with the non-thermal O atoms produced by dissociative recombination of O2+. c: thermal component. d: Ar sputtered
by precipitating picked up ions.
Panel a of Figure 3 displays the sum of all three components modelled by HELIOSARES. As shown, below 250 km, the Ar density is largely dominated by the thermal atmospheric component. Above this altitude, the density is dominated on the dayside by the Ar ejected by collision with the non-thermal O atoms produced by dissociative recombination and deep in the nightside by the Ar ejected by collision with the precipitating picked up O+ ions.
We reconstructed the density along each MAVEN trajectory using the relevant MAVEN’s ephemeris focusing on two particular observation campaigns. The first campaign is composed of the 5 consecutive orbits of the 13th – 14th August 2018 (orbits 7540 – 7544). The trajectories of the spacecraft during these
11
orbits were partly on the nightside and their vertical density profile displayed a very unusual shape (see Figure 4a). The second campaign was conducted on the 15th and 16th October 2018 with 5 consecutive
orbits (7884 – 7888). The trajectory of the spacecraft during the NGIMS observations covered a dayside region above 350 km. In Figure 4, we display the measured Ar density along the trajectory of MAVEN and the simulated HELIOSARES density profile.
The comparison between the HELIOSARES simulated profile and the NGIMS measured one (Fig. 4a) suggests that, between 600 km and 350 km, the expected density of Ar is just below the detection limit of NGIMS (22 cm-3). Above 600 km, NGIMS is able to detect Ar due to the fact that, in this particular case,
MAVEN emerges close to the terminator at high latitude above the pole when reaching these altitudes. It is noticeable that HELIOSARES simulated profile displays this same feature captured in the data. The comparison between the NGIMS measured densities and the HELIOSARES simulated ones suggests that the Ar that was measured along this trajectory above 600 km is mainly due to the collision between the non-thermal O atoms sourced from the O2+ dissociative recombination and the atmospheric Ar.
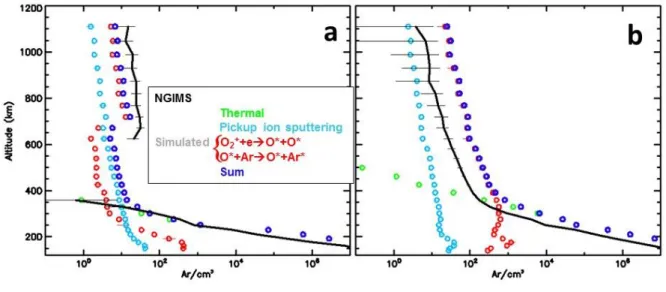
Figure 4: Comparison between the NGIMS measurements (black solid lines) and the HELIOSARES simulated density profiles (dark blue symbols for total). a: Case of the campaign of 13th and 14th August
2018 (orbits 7540 - 7544). b: Case of the campaign of the 15th and 16th October 2018 (orbits 7784 -
7788). Green, light blue and red symbols depicts the thermal, pickup sputtering and induced dissociative recombination simulated components of Ar in the exosphere of Mars respectively.
12
The same conclusion can be drawn for the campaign of the 15th and 16th October 2018 as shown in
Figure 4b. During the inbound legs of these orbits, MAVEN moved from the dayside high latitude regions toward a periapsis located near the Northern pole on the nightside. The measured density profile reveal the presence of a non-thermal component with an SNR > 3 between 350 km and 800 km in altitude. When compared to the simulated profile, the change of slope around 350 km in the measured profile occurs at the same altitude. Moreover, the scale heights are relatively well reproduced by the simulation. The discrepancy between the simulation and measurement altitude on the lower part of the measured profile suggests an overestimate by the simulation of the Ar thermal component below the exobase (the density being overestimated by roughly a factor 5 or/and the thermospheric temperature by few tens of percent). This part of the profile is actually just above the North pole which is dominated by the thermospheric polar warming at this season (González-Galindo et al. 2009). A too dense simulated Ar thermosphere should logically imply a too dense Ar exosphere. However, the upper part of the profile displayed in Figure 4b being obtained at significantly different latitudes and local time than the lower part of the profile, the difference between simulation and observation at high altitudes is probably not related to the one below the exobase along this particular MAVEN trajectory. As in the preceding case, the comparison between the measured and modeled profiles suggests a production of non-thermal Ar by collision between non-thermal O atoms and the atmospheric Ar atoms.
Deep in the nightside, the Ar density at high altitude is too low to be measured with large signal/noise ratio by NGIMS (typically below ten of cm-3). From the current set of NGIMS measurements, we are
only able to provide an upper limit on the Ar non-thermal density that should be produced by pickup ion sputtering. This upper limit appears to be consistent with HELIOSARES modelling, that is, with a sputtering effect induced by precipitating fluxes as measured by MAVEN, an atmospheric background derived from the LMD-GCM (Chaufray et al. 2014) and modeled collisions using Lewkow and Kharhenko (2014) cross sections. This comparison suggests that NGIMS detection limit is very close to the simulated pickup ion sputtered density in the nightside. In another way, additional NGIMS
13
measurements on the nightside might allow us to positively detect for the first time a signature of atmospheric pickup ion sputtering at Mars.
Based on the simulation displayed in Figure 4, we calculate escape rates induced by dissociative recombination of 1.1×1026 O/s, 2.5×10²² CO/s, 1.0×10²¹ C/s and 1.4×10²³ N
2/s whereas pickup ion
sputtering induces an escape of 2.7×10²³ O/s, 3.8×10²² CO/s, 2.3×10²³ CO
2/s, 7.5×10²² C/s, 2.8×10²³
N2/s, 2.4×10²³ N/s and 4.9×10²² Ar/s. The escape rate induced by sputtering is larger than the one
induced by dissociative recombination for most of the atmospheric species considered in our simulation, with the key and very significant exception of O atoms whose escape rate is almost three orders of magnitude larger for dissociative recombination. Most of the Ar ejected into Mars' exosphere do not escape. At the present escape rate for Ar, around 4 Gyr would be needed to deplete totally Mars' atmosphere of Ar.
IV Conclusions
In this paper, we present the first in situ observations of the non-thermal component of the exosphere of Mars using dedicated NGIMS measurements of the Ar species at 300 – 1200 altitude. These measurements clearly show that the Ar density profile displays a two slopes profile consistant with the presence of a cold component associated with the atmosphere, and a non-thermal component. This non-thermal component was measured by NGIMS up to 1200 km altitude and at SZA < 110°.
The comparison between the measured profiles and outputs from the HELIOSARES model shows that the non-thermal Ar is most likely produced by collisions between atmospheric Ar atoms below the exobase and hot O atoms produced by dissociative recombination of the O2+ ion in the ionosphere.
Based on NGIMS limit of detection we derived an upper limit for the Ar density at high altitudes deep in the nightside where pickup ion sputtering should dominate.
These new measurements establish a new approach to characterize the efficiency of non-thermal processes at Mars. As additional data are collected, we expect to be able to constrain their dependency with solar activity and any other potential drivers. Moreover, a larger set of measurements in the
14
nightside should allow us to make a first direct identification of the signatures of pickup ion sputtering in the exosphere.
Acknowledgements:
This work was supported by CNES ”Système Solaire” program and by the Programme National de Planétologie and Programme National Soleil-Terre. This work is also part of HELIOSARES Project supported by the ANR (ANR-09-BLAN-0223) and ANR MARMITE (ANR-13-BS05-0012-02). Authors also acknowledge the support of the IPSL data center CICLAD for providing us access to their computing resources and data. The results of the simulations presented in this paper are available at http://heliosares.latmos.ipsl.fr/EGM_Library.html.
15 References
Benna, M., P. R.Mahaffy, J.M. Grebowsky, J. L. Fox, R. V. Yelle, and B. M. Jakosky (2015), First measurements of composition and dynamics of the Martian ionosphere by MAVEN’s Neutral Gas and Ion Mass Spectrometer, Geophys. Res. Lett., 42, 8958–8965, doi:10.1002/ 2015GL066146.
Bhardwaj A., Smitha V. Thampi, Tirtha Pratim Das, M. B. Dhanya, Neha Naik, Dinakar Prasad Vajja, P. Pradeepkumar, P. Sreelatha, J. K. Abhishek, R. Satheesh Thampi, Vipin K. Yadav, B. Sundar, Amarnath Nandi, G. Padma Padmanabhan, and A.V. Aliyas, Observation of Suprathermal Argon in the exosphere of Mars (2017), Geophysical Research Letters, 44, 5, 2088-2095, doi: 10.1002/2016GL072001.
Bougher, S. W., D. Pawlowski, J. M. Bell, S. Nelli, T. McDunn, J. R. Murphy, M. Chizek, and A. Ridley (2015), Mars global ionosphere-thermosphere model: Solar cycle, seasonal, and diurnal variations of the Mars upper atmosphere, J. Geophys. Res., 120, 311–342, doi:doi:10.1002/2014JE004715. Curry S. M., J. G. Luhmann, Y. Ma, C. F. Dong, D. Brain, F. Leblanc, R. Modolo, Y. Dong, J. McFadden, J.
Halekas, J. Connerney, D. Larson, J. Espley, D. Mitchell, T. Hara, Y. Harada, C. Lee, X. Fang, B. Jakosky, Response of Mars O+ Pick-up Ions to the March 8th, 2015 ICME: Inferences from MAVEN Data-Based Models, Geophys. Res. Lett., 42, 10.1002/2015GL065304, 2015
González-Galindo, F., F. Forget, M. A. López-Valverde, and M. Angelats i Coll (2009), A ground-to-exosphere Martian general circulation model: 2. Atmosphere during solstice conditions— Thermospheric polar warming, J. Geophys. Res., 114, E08004, doi:10.1029/2008JE003277.
Hara T., J. G. Luhmann, Leblanc F., Curry S.M., Seki K., Brain D.A., Halekas J.S., Harada Y., McFadden J.P., Livi R., DiBraccio G.A., Connerney J.E.P. and B. Jakosky, MAVEN observations on a hemispheric asymmetry of precipitating ions toward the Martian upper atmosphere according to the upstream solar wind electric field, J. Geophys. Res. Space Physics, 122, 1083–1101, doi:10.1002/2016JA023348, 2017.
16
atmospheric history derived from upper-atmosphere measurements of 38Ar/36Ar, Science 355, 1408–1410, doi: 10.1126/science.aai7721a.
Jakosky, B. M., R. P. Lin, J. M. Grebowksy, J. G. Luhmann, and others (2015), The Mars Atmosphere and Volatile Evolution (MAVEN) Mission, Space Sci. Reviews, 195, 3–48, doi:doi:10.1007/s11214-015-0139-x
Leblanc F., R. Modolo, S. Curry, J. Luhmann, R. Lillis, J. Y. Chaufray, T. Hara, J. McFadden, J. Halekas, F. Eparvier (2015), Mars heavy ion precipitating flux as measured by Mars Atmosphere and Volatile EvolutioN, Geophys. Res. Lett., 42, doi:10.1002/2015GL066170
Leblanc F., Modolo R., Chaufray J.Y., Leclercq L., Curry S., Luhmann J., Lillis R., Hara T., McFadden J., Halekas J., Schneider N., Deighan J. and B. Jakosky, On the origins of Mars’ exospheric nonthermal oxygen component as observed by MAVEN and modeled by HELIOSARES, J. Geophys. Res., doi: 10.1002/2017JE005336, 2017.
Leblanc F., Modolo R., Chaufray J.Y., Curry S., Luhmann J., Lillis R., Hara T., McFadden J., Halekas J. and B. Jakosky, On Mars' Atmospheric Sputtering after MAVEN first Two Years of Measurements, Geophys. Res. Let., 2018GL077199, 45, 10, 4685-4691, 2018.
Lewkow N.R. and V. Kharhenko (2014), Precipitation of energetic neutral atoms and induced non-thermal escape fluxes from the Martian atmosphere, ApJ, 790, doi:10.1088/0004-637X/790/2/98
Lillis R.J., D. A. Brain, S. W. Bougher, F. Leblanc, J. G. Luhmann, J. Grebowsky, J. Fox, J. Deighan, X. Fang, R. Modolo, J. Wang, Y. Lee, C. Dong, L. Andersson, T. Cravens, N. Schneider, I. Stewart, R. Yelle, J. Clarke, Y. Ma, B. Jakosky, D.L. Mitchell, A.F. Nagy (2015), Characterizing atmospheric escape from Mars with MAVEN, today and in the ancient past, Space Science Review, DOI 10.1007/s11214-015-0165-8, 1-66.
Luhmann, J.G., Kozyra, J.U., (1991), Dayside Pickup Oxygen Ion Precipitation at Venus and Mars Spatial Distributions Energy Deposition and Consequences. J. Geophys. Res. 96, 5457-5467.
17
Mahaffy, P. R., M. Benna, T. King, D. N. Harpold, and R. e. a. Arvey (2015a), The Neutral Gas and Ion Mass Spectrometer on the Mars Atmosphere and Volatile Evolution Mission, Space Sci. Reviews, 195, 49–73, doi:doi:10.1007/s11214-014-0091-1.
Mahaffy, P. R., M. Benna, M. Elrod, R. V. Yelle, S. W. Bougher, S. W. Stone, and B. M. Jakosky (2015b), Structure and composition of the neutral upper atmosphere of Mars from the MAVEN NGIMS investigation, Geophys. Res. Lett., 42, 8951–8957, doi:10.1002/2015GL065329.
McElroy, M. B., Donahue, T. M. (1972), Stability of the Martian Atmosphere. Science 177, 986-988. Wang, Y.-C., J. G. Luhmann, X. Fang, F. Leblanc, R. E. Johnson, Y. Ma, and W.-H. Ip (2015), Statistical
studies on Mars atmospheric sputtering by precipitating pickup O+: Preparation for the MAVEN mission, J. Geophys. Res. Planets, 120, 34–50, doi:10.1002/2014JE004660
Terada N., F. Leblanc, H. Nakagawa, T. Kuroda, A. S. Medvedev, H. Fujiwara, K. Terada, K. Seki, T. Hara, S. L. England, P. R. Mahaffy, M. Elrod, M. Benna, and B. M. Jakosky Global distribution and parameter dependences of gravity wave activity in the Martian upper thermosphere derived from MAVEN/NGIMS observations, J. Geophys. Res., 122, 2, 2374-2397; doi: 10.1002/2016JA023476, 2017.