Publisher’s version / Version de l'éditeur:
Vous avez des questions? Nous pouvons vous aider. Pour communiquer directement avec un auteur, consultez la première page de la revue dans laquelle son article a été publié afin de trouver ses coordonnées. Si vous n’arrivez pas à les repérer, communiquez avec nous à [email protected].
Questions? Contact the NRC Publications Archive team at
[email protected]. If you wish to email the authors directly, please see the first page of the publication for their contact information.
https://publications-cnrc.canada.ca/fra/droits
L’accès à ce site Web et l’utilisation de son contenu sont assujettis aux conditions présentées dans le site LISEZ CES CONDITIONS ATTENTIVEMENT AVANT D’UTILISER CE SITE WEB.
The 16th European Conference on Artificial Intelligence (ECAI 2004)
[Proceedings], 2004
READ THESE TERMS AND CONDITIONS CAREFULLY BEFORE USING THIS WEBSITE. https://nrc-publications.canada.ca/eng/copyright
NRC Publications Archive Record / Notice des Archives des publications du CNRC : https://nrc-publications.canada.ca/eng/view/object/?id=14d41bd3-87fb-46f6-b86b-291ff0eb7c13 https://publications-cnrc.canada.ca/fra/voir/objet/?id=14d41bd3-87fb-46f6-b86b-291ff0eb7c13
Archives des publications du CNRC
This publication could be one of several versions: author’s original, accepted manuscript or the publisher’s version. / La version de cette publication peut être l’une des suivantes : la version prépublication de l’auteur, la version acceptée du manuscrit ou la version de l’éditeur.
Access and use of this website and the material on it are subject to the Terms and Conditions set forth at
A Novel Data Mining Technique for Gene Identification in Time-Series
Gene Expression Data
Famili, Fazel; Liu, Ziying; Ouyang, Junjun; Walker, P.R.; Smith, B.;
O'Connor, M.; Lenferink, A.
Institute for
Information Technology
Institut de technologie de l'information
A Novel Data Mining Technique for Gene
Identification in Time-Series Gene Expression Data *
Famili, F., Liu, Z., Ouyang, J., Walker, P.R., Smith, B., O'Connor, M.,
Lenferink, A.
August 2004
* published at the 16th European Conference on Artificial Intelligence (ECAI 2004). August 22-27, 2004. Valencia, Spain. NRC 47142.
Copyright 2004 by
National Research Council of Canada
Permission is granted to quote short excerpts and to reproduce figures and tables from this report, provided that the source of such material is fully acknowledged.
A Novel Data Mining Technique for Gene
Identification in Time-Series Gene Expression Data
A. Fazel Famili1, Ziying Liu1 and Junjun Ouyang1 P. Roy Walker2 and Brandon Smith2
Maureen O’Connor3 and Anne Lenferink3
Abstract: The purpose of this study was to develop a method for identifying useful patterns in gene expression time-series data. We have developed a novel data mining approach that identifies interesting patterns. The method consists of a combination of data pre-processing as well as unsupervised and supervised learning techniques. To evaluate our approach, we have analyzed three time series data sets which investigate the temporal transcriptome changes that occur during: 1) the cell cycle of budding yeast (S. cerevisiae) [3], 2) the epithelial to mesenchymal transition induced by Transforming Growth Factor-β1 in mouse mammary epithelial BRI-JM01 cells, and 3) the program of differentiation induced by retinoic acid in human embryonal teratocarcinoma NT-2 cells. We present the results from all of our experiments, discuss the patterns discovered through the use of our approach and briefly explain future plans and directions for improving our method.
Keywords: Data Mining, Genomics, Gene
identifications, Gene expression, Time-series, and Microarray
1. Introduction
Recent advances in microarray technology have been the driving force for studying genome-wide mRNA transcript expression using cDNA microarrays and oligonucleotide arrays [2, 4, 5, 14, and 28]. These advances have helped researchers investigate biological processes at the level of gene activity for thousands of genes simultaneously. Moreover, gene expression time series data have allowed researchers to investigate cellular processes underlying the regulatory effects, and to obtain an inference of regulatory networks, ultimately leading to an understanding of the cause and effect of the transcription of all the genes analyzed [24]. The biological regulatory systems of a cell are very dynamic, and are governed by complex gene regulatory
1Institute for Information Technology, National Research Council of Canada, Ottawa, Canada email: [email protected] 2Institute for Biological Sciences, National Research Council of Canada, Ottawa, Canada
3Biotechnology Research Institute, National Research Council of Canada, Montreal, Canada
networks. Understanding the behavioral patterns of these networks is possible through the analysis of large data sets that measure the transcriptome status at several different time points. Knowledge obtained through this process may help to discover the mechanisms underlying disease development and may lead to the identification of potential therapeutic targets. The objectives of the analysis of time-series data from several studies described here are to:
(i) search for meaningful patterns in the data (i.e. clustering of genes with unique properties), (ii) identify specific genes that belong to each
pattern,
(iii) identify any relationships between groups of genes, and
(iv) develop one or more models that explain the relationships between groups of genes.
In this paper we propose a novel approach to clustering time series microarray data. We further introduce a method that combines prior knowledge of biological systems with current observations to find the interactions between sets of genes and individual genes. The approach involves a unique clustering strategy, which reduces the magnitude of the problem. The resulting clusters are then merged based on a certain threshold, in combination with the individual cluster properties. We also apply domain knowledge as the main criteria to perform hierarchical clustering of genes. Finally, we try to identify meaningful associations between the high quality clusters by running Apriori association algorithms [31], using equal-interval discretized centroids of the merged clusters. The associations between individual genes in these high quality clusters are further evaluated in detail. In summary, our analysis allows for the discovery of pairs of clusters in which the expression levels of gene cluster A influences the expression level of gene cluster B.
The rest of the paper is organized as follows. Section 2 provides an overview of related work. Section 3 explains the data and data selection process, and section 4 briefly explains the structure of the time-series data. Section 5 gives an overview of the data mining method and section 6 presents details of the experimentation
and results. Finally, we end the paper with a conclusion, and a discussion of our future research.
2. Related work
Clustering analysis is a multivariate data mining technique, which identifies meaningful subgroups of individuals or objects [6 and 11]. In the gene expression context, the analysis is used to identify subsets of genes that behave similarly along a time course under the described test conditions. A number of previous studies have attempted to cluster genes into groups based on the expression profiles across different experiments, e.g. time points. Genes in the same cluster have similar expression patterns and may share the same or related regulatory pathways. If many genes in a cluster are known to function under certain experimental conditions (disease or treatment), other genes with unknown functions may therefore also be related to these regulatory mechanisms.
Popular clustering approaches applied to time-series microarray data include:
1) Hierarchical clustering techniques [5 and 29], which are based on a distance measure, and yield trees of clusters (dendrograms) representing nested clusters of patterns and similarity levels. These trees can then be ‘cut’ at different levels to generate disjoint groupings of the data.
2) Partitioning optimization techniques (K-means) [9 and 27], which divide data in order to optimize some predefined criterion. K-means partition-optimization [16] maintains k cluster centroids, which are summary descriptions of objects in the same cluster. Data objects are assigned to the nearest cluster and the cluster centroids are recomputed iteratively until an end condition is satisfied, such as: no re-assignment of objects, minimal decrease in squared error or an iteration limit is reached.
3) Principal Components Analysis (PCA) [21 and 22] is a statistical technique for determining the key variables in a multidimensional data set that explain differences in the observations made. This approach can be used to simplify the analysis and visualization of multidimensional data sets [23 and 7].
4) Self Organizing Maps (SOM) [12 and 26] use neural networks to map data objects into a one or two-dimensional lattice in which neighboring nodes tend to define related clusters.
Model based approaches are also used in the analysis of time-series microarray data. These methods consider the dependencies between expression profiles belonging to subsequent time-points.
Schliep et al [24] used an iterative procedure based on HMM (Hidden Markov Model) to find cluster models
and an assignment of data points to models that maximize the joint likelihood of clustering and models. Bar-Joseph et al [1] proposed an approach based on statistical models: each cluster is represented by a spline curve and the clustering is computed using an EM-type algorithm (EM: Expectation Maximization). Similarly, Kundaje [13] used a clustering algorithm based on statistical splines to estimate continuous probabilistic models for clusters of genes with similar time expression profiles, and individual genes.
Ramoni [19 and 20] used a model based clustering approach, where the cluster models were autoregressive curves of a fixed order. For each cluster of time series data, a posterior probability can be derived and models with maximum posterior probability are chosen agglomeratively, while deciding on the optimal number of clusters by applying the Akaike information criterion.
Luan et al [15] introduced a mixed-effects model in analyzing time course gene expression data for performing clustering of genes in a mixture model framework. Michaels et al [17] took advantage of cluster analysis and graphical visualization methods to reveal correlated patterns of gene expression from time series data.
Other clustering methods related to this research are graph theoretic techniques [10] and cluster identification via connectivity kernels [25]. Wichert et
al [30] introduced two simple statistical methods for
signal detection and gene selection in gene expression time series data.
3. Data and Data Selection Process
We used three gene expression data sets for this study, which are further referred to as “yeast”, “cancer genomics”, and “neurogenesis”. Each of these data sets contains gene expression measurements for various numbers of genes that were collected in different time-course experiments. One of these data sets is publicly available. We provide a reference to one of the private data sets used for which more information can be obtained.
Yeast: consisting of 2321 genes as objects with 16 time points as attributes. This data is a subset from the original 6220 genes with 17 time points listed by Cho et
al. [3] from which we selected 2321 genes based on the
largest variance in their expression. One abnormal time point was removed from the data set as suggested by Tomayo et al. [26]. This data has been extensively used in the literature for clustering and unsupervised pattern recognition. In addition, a large number of genes contained in this data set have been biologically characterized and assigned to different phases of the cell cycle.
Cancer Genomics: consisting of 331 genes (selected from an original list of 15264 genes) obtained from cells treated with transforming growth factor (TGF-β1), the p38MAPK inhibitor SB203580 (SB) or TGF-β1+SB. The TGF-β1 data set consists of 5 time points (2, 4, 6, 11, and 24 hours), of which each experimental condition was repeated 4 to 6 times. The p38MAPK inhibitor was used only at the 24-hour time point. The gene expression data was expressed as the ratio of the experimental sample divided by that of the control sample. This data set was generated to characterize the murine mammary epithelial tumor cell line, BRI-JM01, which undergoes an epithelial-to-mesenchymal-transition (EMT) and displays an increase in cell motility, as a result of TGF-β1 exposure. These alterations in phenotype are thought to be critical for tumor progression. The most informative genes in this data set exhibited expression patterns that strongly correlated with the experimental conditions (stimulus, inhibitors). Table 1 shows the three data sets representing the experimental conditions.
Table 1.
Data sets of breast cancer research
Data set H2 H4 H6 H12 H24 TGF-β1 TGF-β1 TGF-β1 TGF-β1 TGF-β1 TGF-β1 TGF-β1 +SB TGF-β1 TGF-β1 TGF-β1 TGF-β1 TGF-β1 +SB SB TGF-β1 TGF-β1 TGF-β1 TGF-β1 SB
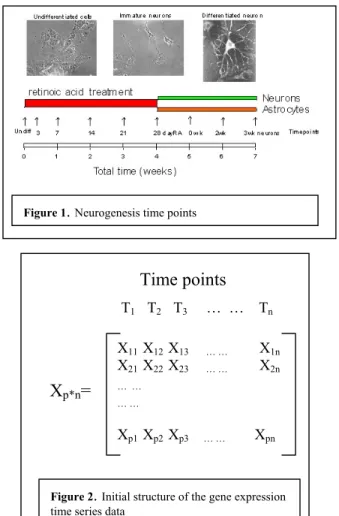
Neurogenesis: consisting of 1747 up-regulated and 1083 down-regulated genes (selected from an original list of 9600 genes). The data consisted of 9 time points, which were named as: undiff, 3, 7, 14, 21, 28 days followed by 0, 2 and 3 weeks. The data is related to the NT-2 cell line, which is a human embryonal carcinoma that is capable of being differentiated into neurons and astrocytes. In this experiment the cells were treated with retinoic acid (RA) for 28 days to stimulate the undifferentiated cells to become neurons or astrocytes, followed by a 3-week neuron maturation process in the absence of RA. This is a complex process taking several weeks involving changes in the expression levels of many genes. The overall process is illustrated in Figure 1.
4. The structure of the time-series data
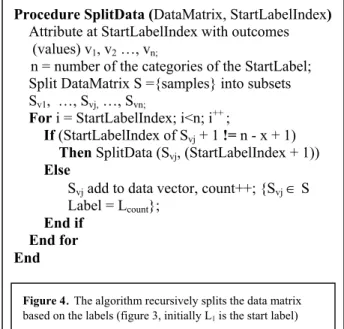
Typically, time series gene expression data consists of a matrix containing intensity data for a group of genes for certain time points. Let Xij be the gene expression level representing the ith gene at time point tj, for i =1, …, p, and j =1, …, n, where p is the number of genes and n is number of time points. Figure 2 shows the overall structure of the time-series data. Depending on the research problem under study, the entire data or a subset of the above matrix may be selected for the data analysis process.
Figure 1. Neurogenesis time points
Time points
T1 T2 T3 … … Tn X11 X12 X13 … … X1n X21 X22 X23 … … X2n … … … … Xp1 Xp2 Xp3 … … XpnX
p*n=
Figure 2. Initial structure of the gene expression time series data
5. Method
The method introduced in this research is illustrated in Figure 5. We divide our method into 12 steps, which consist of a combination of data preprocessing tasks, followed by a combination of unsupervised and supervised learning techniques along with some additional steps that are described below.
In Step 1, we partition the attribute vectors that represent all the time points and select a specific combination of time points for an unsupervised learning process. The procedure for data selection is as follows. For n time points (n attribute vectors containing gene expression data), the total number of combined data points selected, S, is equal to:
S = (n-x) + 1 Eq. 1
where x is the number of adjacent time points (window size) selected for each combination set. Therefore, for a 5 time points data set (n=5), 2 time points are used for
each combination, i.e. window size=2, with one time point overlapped, then S=4.
Step 2, is an unsupervised learning process. Here, we choose an unsupervised procedure, such as K-Means clustering, by which selected time-points are clustered. The clustering method selected for this step will depend on the characteristics of the application for which the data is generated. The expression matrix (Figure 2) is then labeled with cluster assignments as shown in Figure 3.
Step 3, involves preliminary listing of all clusters obtained from step 2. Therefore, if K-Means is used as the unsupervised learning process, for a 5 time points data set in which K=2, we will have T=8, total number of clusters to evaluate (Eq. 2).
T= K*[(n-x) + 1] Eq. 2
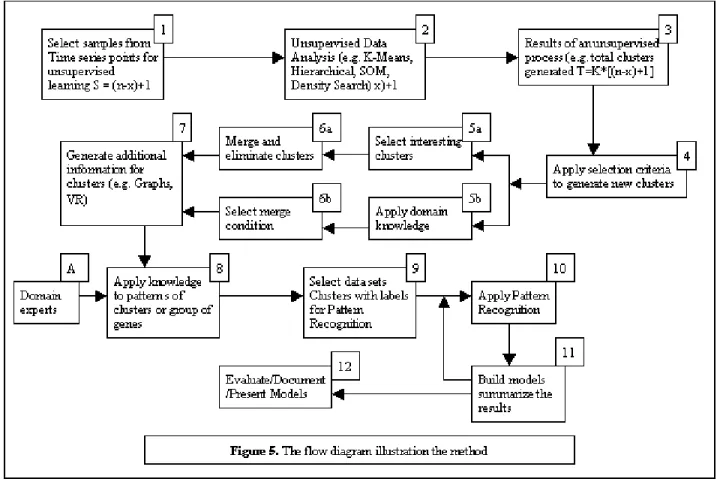
In Step 4, we identify genes that are common to the same clusters, then group them together and give a label to this group of genes. This process is shown as the core of our algorithm in Figure 4.
Step 5 involves use of some domain knowledge to select interesting clusters.
Step 6 is the process in which, we eliminate clusters that do not contain any useful information and merge the ones that lead to promising results. The cluster merge process is based on one of the three main properties of cluster centroid information. These are: (i) properties of individual time points (e.g. mean, median, etc.), (ii) properties of each time point with respect to its adjacent time point (e.g. dimensionless terms such as forward-centroid-ratio, backward-centroid-ratio, etc.), and (iii) properties of all or a sub-set of time points (e.g. partitioned slope, overall slope). This process, which is
automated, requires some input (e.g. merge selection criteria), from the user.
Procedure SplitData (DataMatrix, StartLabelIndex) Attribute at StartLabelIndex with outcomes (values) v1, v2 …, vn;
n = number of the categories of the StartLabel;
Split DataMatrix S ={samples} into subsets Sv1, …, Svj, …, Svn;
For i = StartLabelIndex; i<n; i++ ;
If (StartLabelIndex of Svj + 1 != n - x + 1)
Then SplitData (Svj, (StartLabelIndex + 1))
Else
Svj add to data vector, count++; {Svj ∈ S
Label = Lcount};
End if End for End Time Points Labels
In Step 7, we provide the user with all forms of additional information to understand the results of the cluster merge process. This is done through various forms of graphs and data visualization techniques.
In Step 8, knowledge from domain experts (e.g. biologist) is used to focus on certain clusters with specific patterns of interest for some follow up analysis. This leads to Step 9, in which clusters are labeled. This process may then result in building several newly labeled data sets. The data for labeled clusters is then used for supervised learning methods.
In Step 10, pattern recognition techniques are applied to the data sets. The main objective of this step is to identify any association between clusters that contained interesting patterns. All models obtained from this process are summarized in Step 11. The result of this step defines the path for the iteration process during which we either look for additional associations or associations between genes of certain clusters.
Finally, in Step 12, we document and present all the results (e.g. models).
6. Experimentation and Results
This section contains the results from the application of the methods introduced in the previous section to the three data sets, described earlier. Our objective in this section is to highlight interesting clusters and introduce informative genes.
Figure 4. The algorithm recursively splits the data matrix based on the labels (figure 3, initially L1 is the start label) T1 T2 T3
Tn L1 L2 Ln-x+1 X11 X12 X13 … X1n X21 X22 X23 … X2n . . . … . . . . … .
. . . … .
Xp1 Xp2 X23 … XpnV1 V2 V1
V1 V2 V1 2 2 V1 V V … … … … … … Xp*n=
Figure 3.Structure of the expression time series data and labels.
6.1 Preliminary Evaluation of the Data
Our preliminary investigation of the data characteristics allowed us to identify missing values [8], abnormal conditions or interesting characteristics. In addition, we obtained an over all statistical distribution of the data sets. No missing values or anomalies were found in the yeast data. There were also no anomalies found among the data distributions of the neurogenesis data. However, 11.22% and 7.61% missing values were found in up and down-regulated data, respectively. With regard to the cancer genomics data, no missing values were identified in the three sub-data sets. However, one gene was filtered out because of a statistical irregularity (the standard deviation among duplicates was very different from the other genes). 6.2 Clustering partitioned time points
The experimentation process started by applying a K-means clustering method, with K=2, to all partitioned time points. We then grouped together genes that always remained in the same cluster in the series of clustering on pairs of time points (Table 2). In order to simplify the process of biological validation, clusters without known genes were ignored.
Table 2. Results of Clustering partitioned time points
Data set clusters # of selected # of total clusters generated # of selected genes Total # of genes Yeast 120 1129 595 2321 TGF-β1 6 6 330 330 TGF-β1+SB 7 7 330 330 Cancer Genomics SB 7 7 330 330 Up 123 273 1341 1747 Neuro Down 151 233 976 1083 6.3 Meaningful Clusters
To identify meaningful clusters, we obtained new features (forward centroid slope) from the centroids of the clusters generated previously. The forward centroid slope values were then clustered using an agglomerative hierarchical clustering algorithm with both complete linkage and Ward’s methods [29 and 32]. The complete linkage method evaluates the distance between two clusters. Here, the longest distance that can be found between any pair of points from the two corresponding clusters is:
J
j
I
i
D
D
I,J=
max{
ij},
∈
,
∈
where D represents the distance between cluster I and J. Lower case i and j represent the elements in the corresponding clusters. In Ward’s method, at each step, the central point is calculated for any possible combination of two clusters. Then, the total sum of squared distances from this point to all objects in this hypothetical cluster is evaluated. The hierarchical cluster trees were cut at a threshold determined using biological domain knowledge and visualization output.
Yeast: The trees were cut at a threshold generating 5 clusters, which could then be compared to the five major cell cycle phases. Three clusters from the complete linkage tree show time-dependent responses correlating with Early G1 (C5), Late G1 (C4) and S, G2 and M (C1) phases (Figure 6). Since the S, G2 and M are quite close cell cycle phases, it is not surprising to see gene expression changes related to these phases condensed into a single cluster.
Cancer genomics: Since this data set was a small subset of original data, only a few clusters could be generated. Therefore it was not necessary to use agglomerative clustering to further merge these clusters for the three sub-sets. Following are some highlights of the clusters generated by the time-series clustering processes.
For TGF-β1 (Figure7), the C2 cluster (containing 3 genes) is significantly stimulated by the effect of TGF-β1. Along the time course, the C4 cluster contains genes that are slightly down regulated; the C5 cluster contains slightly up-regulated genes, whereas the other clusters contain genes that fluctuate in no particular direction.
In TGF-β1+SB (Figure 8), the C3 cluster contains genes significantly modulated by TGF-β1and repressed by the addition of SB (the same genes as in TGF-β1). The C2 and C5 clusters contain genes that are moderately stimulated by the addition of SB. Along the time course, the C4 and C6 clusters contain genes whose expression is slightly down regulated, the genes in cluster C7 fluctuate slightly, whereas the genes in C1 change only minimally.
Figure 7. Time series plot of cluster centroids.
Figure 8. Time series plot of cluster centroids.
Figure 6. Time series plot of cluster centroids
In the last data subset (SB, Figure 9), C7 was significantly stimulated by TGF-β1 and significantly repressed by SB (same genes as the other two routes). C5 and C6 seem to be moderately repressed by the addition of SB. Along the time course, C3 goes down slightly, C2 goes up slightly, C4 fluctuates slightly, and C1 changes little.
Figure 9. Time series plot of cluster centroids.
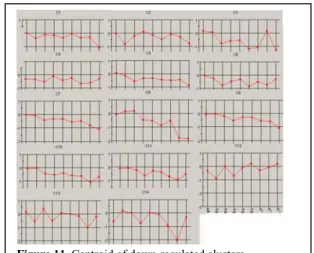
Neurogenesis: From the two data sets of up and down-regulated genes, 13 and 14 clusters were generated, respectively (Figures 10 and 11).
Looking at the centroids of the 13 clusters of up-regulated genes (Figure 10), we found that the patterns of C7 and C9 were quite similar. The centroids of these clusters show a small peak in expression at 21 days of RA exposure, returning to normal until the week 0 time-point in which RA treatment is withdrawn. From this point to the end of the time course, expression increases and implies that RA withdrawal stimulates
these two groups of genes. C1 and C2 have minimal changes at the beginning of RA treatment but these two groups of genes, as with C7 and C9, show an up-regulation following RA withdrawal at week 0 which continues to increase up to 3 weeks. C13 first peaks at 14 days and then declines. It is interesting that during maturation it increases immediately, before declining from week 2 onwards. C4 reaches its first peak at 7 days, and then its downward trend continues to 21 days. It is recovered a little bit at day 28 and it starts to express again at week 0. C6 increases continuously up to 28 days. However, after RA withdrawal, it immediately declines.
Based on the centroids of the 14 down-regulated clusters (Figure 11), C1 does not change much up to 28 days. Then, after RA withdrawal, it slowly goes down, and it seems moderately repressed during maturation. C7 and C9 have similar patterns except that C9 is off-set from C7 by one time point. Both clusters consistently and smoothly go down starting at 7 and 14 days, respectively, followed by steep declines after RA withdrawal. C8 contains small changes at the beginning. It decreases at 14, 21 and 28 days, then goes up after RA withdrawal before declining again. C10 and C11 have a similar pattern, with a downward trend during treatment with RA and did not consistently change after RA withdrawal except for a late increase at week 3.
6.4 Association between Clusters
Our next task was to identify any associations between the clusters. This was done first by deriving forward centroid slope data from all the clusters identified during the previous step. An equal-width-interval discretization method was used to discretize the numeric data [31]. The selection criteria for the
association rules was based on confidence, complexity and the coverage of the rules. We use ‘Ù’ to indicate the simultaneous changes.
Figure 11. Centroid of down-regulated clusters
Figure 10. Centroid of up-regulated clusters
Yeast cell cycle: We used 3 as the number of intervals. The associations were between C1, C4 and C5 (Figure 12). Figure 13 shows the relationship among clusters. C1 (0.2…0.56) ÙC4 (–0.42… 0.12) Ù C5 (-0.68… –0.31).
C1 C2 C3 C4 C5
C1 C2 C3 C4 C5
Figure 12. Associations in clusters in Yeast data
Cancer genomics: Using 2 intervals the following associations were identified.
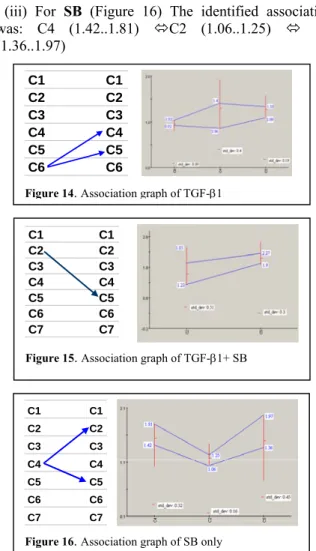
(i) For TGF-β1(Figure 14) C6 (0.92..1.03) Ù C4 (0.86..1.4) Ù C5 (1.09..1.33).
Figure 13. Association Graph for Yeast data
(ii) For TGF-β1 + SB (Figure 15) The identified association was: C2 (1.23..1.85) Ù C5 (1.9..2.27).
(iii) For SB (Figure 16) The identified association was: C4 (1.42..1.81) ÙC2 (1.06..1.25) Ù C5 (1.36..1.97)
Neurogenesis: Three intervals were used. For up-regulated genes, the associations were: C3 (00.5 … 0.31) Ù C10 (-0.56 … 0.07) (Figure 17). And for down-regulated data, the identified associations were, C5 (-0.56 … -0.26) Ù C1 (-0.36 to 0.0) (Figure 18).
C1 C2 C3 C4 C5 C6 C7 C8 C9 C10 C11 C12 C13 C14
C1 C2 C3 C4 C5 C6 C7 C8 C9 C10 C11 C12 C13 C14
Figure 18.Association for down regulated genes
C1 C1 C2 C2 C3 C3 C4 C4 C5 C5 C6 C6
Figure 14. Association graph of TGF-β1
C1 C1 C2 C2 C3 C3 C4 C4 C5 C5 C6 C6 C7 C7
Figure 15. Association graph of TGF-β1+ SB
6.5 Most informative genes
C1 C1 C2 C2 C3 C3 C4 C4 C5 C5 C6 C6 C7 C7
Figure 16. Association graph of SB only
The following is a summary of the contents of all clusters that resulted from merging, along with highlights of some interesting results.
Yeast: Following several years of research on this data set, many genes have been annotated and their functions have been identified in the cell cycle. Compared to other studies using yeast data, we have a better coverage of the previously well-characterized genes (see Table 3 and Figure 19). The remaining genes that are included in these clusters are of unknown function, but may now be studied to validate their predicted relations to the cell cycle and elucidate their functions. For example, transcription of SWI5 and CLB1 is G2/M specific and activated in G2. These two genes are included in cluster C1 in our study (See Figure 20). This shows synchronization between these two genes.
C1 C2 C3 C4 C5 C6 C7 C8 C9 C10 C11 C12 C13
C1 C2 C3 C4 C5 C6 C7 C8 C9 C10 C11 C12 C13
Figure 17.Association for up-regulated clusters
Table 3.Coverage of cell cycle related genes Complete Linkage 5Clusters Early G1 Later G1 S G2 M C1 2 7 22+1* 22+1* 19+2* C2 2 3 3 1+ 3* 1 + 1* C3 2 2 8 2 + 1* 2 +1* C4 4 70 13 2 1 C5 22 5 1 1 + 1* 7 Cluster assignment 22 (C5) 70 (C4) 23 (C1) 23 (C1) 21 (C1) Total ** 32 87 48 28 30 * The gene(s) also belongs to other cell cycle phases
Cancer genomics: It is very interesting to see three genes that always stay together in the same cluster in the analyses of three sub-data sets (Figures 21, 22 and 23). The three clusters, to which these genes belong, are also discussed in Section 6.2 for their characteristic change over the time course. These genes are up regulated by the addition of TGF-β1, but repressed in the presence of SB. These genes have been highlighted in another study [18] using this breast cancer data set. 0.00% 10.00% 20.00% 30.00% 40.00% 50.00% 60.00% 70.00% 80.00% 90.00% 100.00%
Early G1 Later G1 S phase G2 M
Yeast cell cycle
Percen tag e o f co verag e
Ward's* Complete Linkage* Cho et al [3] Famili et al [9]
Figure 19. Comparison of number of previously well- characterized genes detected by different methods. * is the method used in the current study.
TGF_b + SB
Figure 22. Genes in TGF- β1 +SB
SB
Figure 23.Genes in SB only
Figure 20.Time course synchronization of two genes.
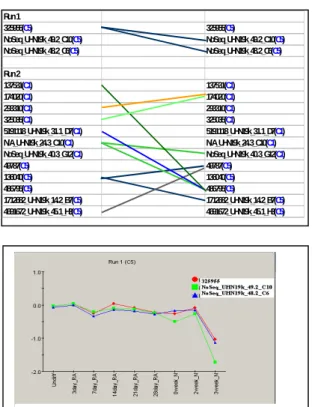
Neurogenesis: Here we repeat the same process after removing all the genes identified in the association rules generated in the first run. These analyses discover associations among genes in these clusters.
(i) Up regulated genes: The associations among the genes identified in two runs of the analysis are listed in Table 4 and expression patterns are depicted in Figure 24 and 25.
(ii) Down regulated genes: Similarly, the associations among the genes identified in two runs of the analysis are listed in Table 5 and expression patterns are shown in Figures 26 and 27.
Table 4.Associations of up-regulated genes
TGF_b Figure 21.Genes in TGF-β1 run1 152940 (C10) 152940 (C10) 470712 (C3) 470712 (C3) 325296 (C3) 325296 (C3) 122906 (C3) 122906 (C3) run2 244896 (C3) 244896 (C3) 210782 (C3) 210782 (C3)
Table 5. Associations of down-regulated genes Figure 24.Up-regulated genes in the first run of association rules.
Figure 27.Up-regulated genes in the second run of association rules.
Figure 25. Up-regulated genes in the second run of
association rules.
7. Conclusions
We have described a novel method for identifying interesting patterns in time-series microarray data obtained from multiple experiments. The experimental results have shown that our approach not only identifies groups of genes with interesting patterns, but is also capable of finding associations between these clusters as well as associations between individual genes in each cluster. This approach could help in the identification of gene clusters that influence the behavior of other gene clusters at any time point.
The most interesting part of our results was generated using the well-known yeast data set that has been used in several previous studies. The patterns that we identified are consistent with those identified by another study performed on this data set. The results from the “cancer genomics” and ”neurogenesis” data sets, indicate that the application of machine learning methods on partitioned time-series data can help in the identification of interesting gene expression patterns.
Run 1 325955(C5) 325955(C5) NoSeq_UHN19k_49.2_C10(C5) NoSeq_UHN19k_49.2_C10(C5) NoSeq_UHN19k_48.2_C6(C5) NoSeq_UHN19k_48.2_C6(C5) Run 2 137531(C1) 137531(C1) 174020(C1) 174020(C1) 293310(C1) 293310(C1) 325035(C1) 325035(C1) 5191118_UHN19k_31.1_D7(C1) 5191118_UHN19k_31.1_D7(C1) N/A_UHN19k_24.3_C10(C1) N/A_UHN19k_24.3_C10(C1) NoSeq_UHN19k_40.3_G12(C1) NoSeq_UHN19k_40.3_G12(C1) 49787(C5) 49787(C5) 136040(C5) 136040(C5) 486795(C5) 486795(C5) 1712682_UHN19k_14.2_B7(C5) 1712682_UHN19k_14.2_B7(C5) 4691672_UHN19k_45.1_H3(C5) 4691672_UHN19k_45.1_H3(C5)
Based on our approach, we present the results describing associations between gene clusters, thereby focusing on a specific range of gene expressions where an association is strongly valid. For example, genes in cluster A that change in a certain range influence genes in cluster B to change in a certain other range. This explains the association between the gene clusters, and is based on a particular range of the expression levels.
Figure 26.Down-regulated genes in the first run of association rules.
8. Future Research
In this study, we present a novel method to identify interesting and useful patterns in time series microarray data, which reveal the associations among groups of genes and individual genes in these clusters. These associations will be further studied to identify the causal relationships using Hidden Markov Models and Bayesian Networks for the identification of gene regulatory networks.
9. Acknowledgements
The authors would like to acknowledge the
contributions of all members of the BioMine project team at IIT and IBS.
10. References
[1] Z. Bar-Joseph, G. Gerber, D. Gifford, T. Jaakkola, and I. Simon, ‘A new approach to analyzing gene expression time series data’,
Proceedings of the Sixth Annual International Conference on Computational Biology, 39-48, (2002).
[2] A. Ben-Dor, L. Bruhn, N. Friedman, I. Nachman, M. Schummer, and Z. Yakhini, ‘Tissue classification with gene expression profiles’, J. Comput. Biol., 7 (3-4), 559-583. (2000). [3] R. J. Cho, R.J. et al, A Genome-Wide Transcriptional Analysis
of the Mitotic Cell Cycle, Molecular Cell, Vol 2, 65-73, (1998). [4] P. D’Haeseleer, X. Wen, S. Fuhrman, and R. Somogyi, ‘Linear
modeling of mRNA expression levels during CNS development and injury’, Pac. Symp. Biocomput, 4, 41–52, (1999).
[5] M.B. Eisen, P.T. Spellman, P.O. Brown, and D. Botstein, ‘Cluster analysis and display of genome-wide expression patterns’, Proc. Natl. Acad. Sci. USA, 95, 14863-14868, (1998). [6] B. Everitt, Cluster Analysis, Heinemann Educational Books,
London, 1974.
[7] B.S. Everitt and G.Dunn. Applied Multivariate Data Analysis. 1992 Oxford University Press, New York, NY.
[8] A. Famili and J. Ouyang, ‘Data mining: understanding data and disease modeling’ Applied Informatics, 32-37, (2003). [9] A. Famili, G. Liu, and Z. Liu, ‘Evaluation and optimization of
clustering in gene expression data analysis’, Journal of
Bioinformatics, Volume 20, No.7, 2004.
[10] E. Hartuv, A. Schmitt, J. Lange, S. Meier-Ewert, H. Lehrach, and R. Shamir, ‘An algorithm for clustering cDNA fingerprints’,
Genomics, 66 (3), 249-256, (2000).
[11] A.K. Jain and R.C. Dubes, Algorithms for Clustering Data, Prentice Hall, Englewood Cli.s, 1988.
[12] T. Kohonen, Self-Organization and Associative Memory, Sringer-Verlag, 3rd edn., 1989.
[13] A. Kundaje, O. Antar, T. Jebara, and C. Leslie, ‘Learning regulatory networks from sparsely sampled time series expression data’, Technical report, Columbia University, (2002).
[14] D.J. Lockhart et al, Expression Monitoring by hybridization to high-density oligonucleotide arrays, National Biotechnology, Vol 14, pp. 1675-1680, (1996).
[15] Y. Luan and H. Li. Clustering of time course gene expression data using a mixed-effects model with B-splines,
Bioinformatics. Mar 1; 19(4): 474-82. (2003).
[16] J. McQueen, ‘Some methods for classification and analysis of multivariate observation’, Proceedings of the 5th
Berkeley symposium on Mathematical Statistics and Probability,
271-297, (1967).
[17] GS. Michaels, DB. Carr, M. Askenazi, S. Fuhrman, X. Wen, R. Somogyi. Cluster analysis and data visualization of large-scale gene expression data. Pac Symp Biocomput. 1998; 42-53. [18] O'Connor-McCourt, M., Lenferink, A., Nantel, A., Cantin, C.,
Magoon, J., Ouyang, J., Lui, G., and Famili, A. Analysis of Transforming Growth Factor (TGF)-ß Modulated Genes Involved in the Epithelial to Mesenchymal Transdifferentiation of Murine Mammary Epithelial Cells. Annual Meeting on American Cancer Research Institute. Washington, USA. July 2003
[19] M.F. Ramoni, P. Sebastiani, and P.R. Cohen, ‘Bayesian clustering by dynamics’, Mach. Learning., 47, 9-121, (2002a). [20] M.F. Ramoni, P. Sebastiani, and I. S. Kohane, ‘Clustering
analysis of gene expression dynamics’, Proc. Natl. Acad. Sci.
USA, 99, 9121-9126, (2002b).
[21] S. Raychaudhuri, J. M. Stuart, & R. B. Altman. Principal Components Analysis to Summarize Microarray Experiments: Application to Sporulation Time Series. Pacific Symposium on Biocomputing 2000, Honolulu, Hawaii, 452-463. 2000. [22] S.A. Rifkin and J. Kim, ‘Geometry of gene expression
dynamics’, Bioinformatics, 18, 1176-1183, (2002).
[23] K. Pearson, On lines and planes of closest fit to systems of points in space, Phil. Mag., 2 (1901), 559–572
[24] A. Schliep, A. Schönhuth, and C. Steinhoff, ‘Using hidden Markov models to analyze gene expression time course data’,
Bioinformatics, 19 (Suppl. 1), i255-i263, (2003).
[25] R. Sharan and R. Shamir, ‘CLICK: A clustering algorithm with applications to gene expression analysis’, Proc. Int. Conf. Intell.
Syst. Mol. Biol., 8, 307-316, (2000).
[26] P. Tamayo, D. Slonim, J. Mesirov, Q. Zhu, S. Kitareewan, E. Dmitrovsky, E.S. Lander, T.R. Golub, ‘Interpreting patterns of gene expression with self-organizing maps: Methods and application to hematopoietic differentiation’, Proc. Natl. Acad.
Sci. USA, 96(6), 2907-2912, (1999).
[27] S. Tavazoie, J.D. Hughes, M. J. Campbell, R.J. Cho, and G.M. Church, ‘Systematic determination of genetic network architecture’, Nature Genetics, 22, 281-285, (1999).
[28] V.E. Velculescu, L. Zhang, B. Vogelstein, and K.W. Kinzler, ‘Serial analysis of gene expression’, Science, Vol. 270, pp. 484-487, (1995).
[29] J.H. Ward, ‘Hierarchical grouping to optimize an objective function’, Journal of the American Statistical Association, 58, 236-244, (1963).
[30] S. Wichert, K. Fokianos, and K. Strimmer, ‘Identifying Periodically Expressed Transcripts in Microarray Time Series Data’, Bioinformatics, 20 (1), 5-20, (2004).
[31] I. Witten and F. Eibe, Data Mining: Practical Machine
Learning Tools and Techniques with Java Implementations,
Morgan Kaufmann, San Mateo, (1999).
[32] J. Zupan, Clustering of large data sets, Chichester; Toronto: Research Studies Press, (1982).