Publisher’s version / Version de l'éditeur:
The Journal of Physical Chemistry C: Nanomaterials and Interfaces, 113, 9, pp.
3390-3401, 2009-02-10
READ THESE TERMS AND CONDITIONS CAREFULLY BEFORE USING THIS WEBSITE.
https://nrc-publications.canada.ca/eng/copyright
Vous avez des questions? Nous pouvons vous aider. Pour communiquer directement avec un auteur, consultez la première page de la revue dans laquelle son article a été publié afin de trouver ses coordonnées. Si vous n’arrivez pas à les repérer, communiquez avec nous à PublicationsArchive-ArchivesPublications@nrc-cnrc.gc.ca.
Questions? Contact the NRC Publications Archive team at
PublicationsArchive-ArchivesPublications@nrc-cnrc.gc.ca. If you wish to email the authors directly, please see the first page of the publication for their contact information.
NRC Publications Archive
Archives des publications du CNRC
This publication could be one of several versions: author’s original, accepted manuscript or the publisher’s version. / La version de cette publication peut être l’une des suivantes : la version prépublication de l’auteur, la version acceptée du manuscrit ou la version de l’éditeur.
For the publisher’s version, please access the DOI link below./ Pour consulter la version de l’éditeur, utilisez le lien DOI ci-dessous.
https://doi.org/10.1021/jp809990a
Access and use of this website and the material on it are subject to the Terms and Conditions set forth at
Single-sized CdSe nanocrystals with bandgap photoemission via a
non-injected one-pot approach
Yu, Kui; Ouyang, Jianying; Zaman, Md. Badruz; Johnston, Dennis; Yan, Fu
Jian; Li, Grace; Ratcliffe, Christopher I.; Leek, Donald M.; Wu, Xiaohua;
Stupak, Jacek; Jakubek, Zygmunt; Whitfield, Dennis
https://publications-cnrc.canada.ca/fra/droits
L’accès à ce site Web et l’utilisation de son contenu sont assujettis aux conditions présentées dans le site
LISEZ CES CONDITIONS ATTENTIVEMENT AVANT D’UTILISER CE SITE WEB.
NRC Publications Record / Notice d'Archives des publications de CNRC:
https://nrc-publications.canada.ca/eng/view/object/?id=08c76c5f-73da-4536-8c4e-8c0a4441510d https://publications-cnrc.canada.ca/fra/voir/objet/?id=08c76c5f-73da-4536-8c4e-8c0a4441510dThe Journal of Physical Chemistry C is published by the American Chemical Society. 1155 Sixteenth Street N.W., Washington, DC 20036
Article
Single-Sized CdSe Nanocrystals with Bandgap
Photoemission via a Noninjection One-Pot Approach
Kui Yu, Jianying Ouyang, Md. Badruz Zaman, Dennis Johnston, Fu Jian Yan, Grace Li, Christopher
I. Ratcliffe, Donald M. Leek, Xiaohua Wu, Jacek Stupak, Zygmunt Jakubek, and Dennis Whitfield
J. Phys. Chem. C, 2009, 113 (9), 3390-3401• DOI: 10.1021/jp809990a • Publication Date (Web): 10 February 2009
Downloaded from http://pubs.acs.org on February 26, 2009
More About This Article
Additional resources and features associated with this article are available within the HTML version: • Supporting Information
• Access to high resolution figures
• Links to articles and content related to this article
ARTICLES
Single-Sized CdSe Nanocrystals with Bandgap Photoemission via a Noninjection One-Pot
Approach
Kui Yu,*,†Jianying Ouyang,†Md. Badruz Zaman,†,§Dennis Johnston,† Fu Jian Yan,†
Grace Li,† Christopher I. Ratcliffe,†Donald M. Leek,†Xiaohua Wu,‡Jacek Stupak,§
Zygmunt Jakubek,† and Dennis Whitfield§
Steacie Institute for Molecular Sciences, National Research Council of Canada, Ottawa, Ontario K1A 0R6, Canada, Institute for Microstructural Sciences, National Research Council of Canada, Ottawa, Ontario K1A 0R6, Canada, and Institute of Biological Science, National Research Council of Canada, Ottawa,
Ontario K1A 0R6, Canada
ReceiVed: NoVember 12, 2008; ReVised Manuscript ReceiVed: December 17, 2008
The manuscript addresses the synthesis and characterization of one colloidal CdSe single-sized nanocrystal ensemble exhibiting bandgap absorption and emission peaking at 463 and 465 nm, respectively, with full width at half-maximum of ca. 8 nm. This ensemble is called Family 463; also, these single-sized quantum dots (QDs) are termed as magic-sized quantum dots (MSQDs). A magic-sized quantum dot (MSQD) ensemble is similar to a regular quantum dot (RQD) ensemble but consisting of single-sized nanocrystals; meanwhile, MSQDs do not grow in size any more with longer reaction periods or higher temperature, after their well development during synthesis. The CdSe MSQDs were synthesized via a noninjection one-pot approach with long reaction periods at elevated temperature, with cadmium acetate dihydrate (Cd(OAc)2·2H2O) and elemental
selenium as Cd and Se sources, respectively, one long-chain fatty acid as ligands, and 1-octadecene (ODE) as a reaction medium. Different carboxylic acids with the carbon-chain length ranging from C2 to C24, the number of which refers to the total number of carbons, were investigated. Deficient acid feed amount with respect to Cd is crucial for the formation of the CdSe MSQDs, leading to the resulting Cd precursor Cd(OAc)x(OOC-(CH2)n-CH3)2-x(with tunable activity). It was also found that the fatty acids of C12-C18,
with low acid-to-Cd and high Cd-to-Se feed molar ratios and the growth temperature of 200-240 °C, are optimum for MSQD Family 463, regarding the yield, purity, and their bandgap photoluminescent (PL) efficiency. Interestingly, in the initial stage of the formation at the growth temperature of 140-160°C, there may be an “isomer competing” process. 13C solid-state cross-polarization magic-angle spinning (CP/MAS)
nuclear magnetic resonance (NMR) indicates that the capping carboxylate groups are firmly attached to the nanocrystals, which allows cross-polarization from1H of the alkyl chains to113Cd. Thus113Cd NMR is able
to distinguish surface (422 ppm) bonding to both -COO and Se and bulk (680 ppm) Cd species bonding to Se only. The CdSe MSQD Family 463 possesses long shelf-storage stability. The synthetic approach introduced here is ready and reproducible, featuring large-scale production. The present study on the growth kinetics of CdSe MSQD Family 463 brings insights for rational design strategies toward various MSQD ensembles with different sizes, via the choice of acids and their feed amount affecting the activity of the resulting Cd precursor. 1. Introduction
Colloidal photoluminescent (PL) semiconductor nanocrystals are of great appeal for both fundamental and application-oriented research, initiating significant attention for their potential in various areas including bioassociated imaging/labeling, light-emitting diodes (LED), and sensing.1,2 Among them, CdSe
nanocrstyals provide an excellent opportunity to investigate the evolution of the materials properties from molecules to the bulk, due to the bulk bandgap energy of ∼1.7 eV (ca. 730 nm),3the
value of which is much smaller than the transition energy of
their capping ligands. Accordingly, as the nanocrystal sizes decrease, a large range of energy shifts is possible, prior to mixing between the bandgap transition and the intraligand transition; the CdSe nanocrstals exhibit bandgap energy in the full visible spectral range (from ca. 400 nm to ca. 700 nm). Thus, it is practical to study the quantum confinement effect of the nanometer-sized colloidal CdSe crystallites. Several research groups have developed various wet-chemistry synthetic routes to PL CdSe nanocrystals; via the control of synthetic parameters, the resulting CdSe nanocrystals are usually in the size range of 2-7 nm, exhibiting bandgap photoemission from blue to red, with the full width at half-maximum (fwhm) in the range of 25-40 nm.4-6To date, each of the ensembles is made up of
nanocrystals with various numbers of atoms; thus, the nano-crystal ensemble has a certain size distribution. On the other
* To whom correspondence should be addressed. †Steacie Institute for Molecular Sciences. ‡Institute for Microstructural Sciences. §Institute of Biological Science.
J. Phys. Chem. C 2009, 113,3390–3401 3390
10.1021/jp809990a CCC: $40.75 2009 American Chemical Society Published on Web 02/10/2009
hand, it has been known that cluster materials possess control-lable assembly with particular atomic arrangements, leading to “magic” structures with the precision on both the atomic and molecular levels.7,8
In the field of materials chemistry, it is important to precisely control the size and size distribution of the nanocrystals in one colloidal ensemble; for the biolabeling and LED applications, single-sized nanocrystal ensembles exhibiting single-dot band-gap absorption and emission are in demand.9Recently,
time-of-flight mass spectrometry (TOF-MS) revealed the presence of several (CdSe)nnanoclusters termed as magic-sized
nano-clusters;10also, CdSe magic-sized nanocrystal (MSN) ensembles
exhibiting narrow bandgap absorption without bandgap emission were reported.10-13In the present manuscript, both MSQDs and
MSNs are used to refer to single-sized nanocrystal ensembles. For a long time, it has been a significant challenge to synthesize MSQDs exhibiting bandgap photoemission. The research group of Manna reported a Se-injection approach, with both the injection and growth at 80°C, leading to the coexistence of a series of CdSe MSN ensembles, with the largest ensemble exhibiting its bandgap absorption at 432 nm.13Therefore, it is
easy to understand that it is also a challenge to produce a single MSQD family without the coexistence of other families from one synthetic batch.
Our laboratories recently developed a noninjection one-pot approach to three CdSe MSQD families, in pure form, exhibiting “bright” bandgap emission.14Such an approach is believed to
be the first to produce single-sized nanocrystal ensembles with bandgap emission and is a breakthrough from the absence to the presence of bandgap emission in CdSe single-sized en-sembles with fwhm of ca. 10 nm and quantum yield (QY) of 1-5% in toluene. The fwhm of the CdSe single-sized ensembles is similar to that of single CdSe QD, without inhomogeneous spectra broadening but only homogeneous broadening.15Due
to the narrow bandwidth, the emission is bright, even with relatively low QY as compared to that of regular QDs with relatively wide fwhm. The three families synthesized are referred to as Family 395, 463, and 513, due to their bandgap absorption peaking at 395, 463, and 513 nm, respectively. This synthetic approach is the simplest, using cadmium acetate dihydrate (Cd(OAc)2·2H2O) as the Cd source, elemental selenium as the
Se source, a fatty acid as a surface capping agent, and 1-octadecene (ODE) as the reaction medium. With low acid-to-Cd and high Cd-to Se feed molar ratios, all of these chemicals were loaded into a reaction flask at room temperature. Depend-ing on the synthetic condition, a growth at 120-240°C led to the presence of one CdSe MSQD family exhibiting strong bandgap PL or the coexistence of several MSN families. This synthetic approach allows long growth/annealing periods at high temperature, featuring highly synthetic reproducibility and large-scale capability.
It is necessary to point out that the research group of Cao reported a noninjection approach to regular CdSe nanocrystal ensembles with certain size distribution (PL fwhm ∼ 25 nm).16
With ODE as the reaction medium and myristic acid (MA) as the ligand, this approach used CdNO3as a Cd source compound
and purified cadmium myristate as the Cd precursor. Compared to the present approach, the nature of the Cd precursor plays an important role in the formation of regular QD ensembles vs single-sized QD ensembles.
With ODE as the reaction medium and a long-chain fatty acid, such as myristic acid, as the capping agent, the present noninjection approach used Cd(OAc)2as a Cd source compound
and in situ formed Cd(OAc)x(OOC-(CH2)n-CH3)2-xas the Cd
precursor.14With acid-to-Cd feed molar ratios smaller than two,
the Cd precursor was developed in the form of Cd(OAc)x
(OOC-(CH2)n-CH3)2-x, as shown in eq 1, where Cd2+represents the
monomers available for the formation of final nanocrystals (CdSe)i. Our Cd precursor releases the Cd2+monomers slowly
in ODE, with the nature of the acid and reaction temperature playing a role. Cd(OAc)2+HOOC-(CH 2)n-CH3f Cd(OAc)x · (OOC-(CH2)n-CH 3)2-xf Cd 2+ f (CdSe)i (1)
In the present study, we report the growth kinetics of CdSe MSQD Family 463 affected by the acid feed amount and its chain length. Due to the fact that the acid amount is deficient, namely the acid-to-Cd feed molar ratio is less than two, the release of the Cd2+monomers by the Cd precursor, which is in
the form of Cd(OAc)x(OOC-(CH2)n-CH3)2-x rather than
Cd(OOC-(CH2)n-CH3)2, plays an essential role in the
forma-tion of Family 463. It is straightforward that the former releases Cd2+more slowly than the latter, due to their solubility in ODE;
meanwhile, the activity of the Cd2+monomers is related to the
steric effect of the acid used and its bonding strength. Tuning the activity of the Cd precursor as well as the monomer, we successfully synthesized high-quality CdSe MSQD Family 463 in pure form. Also, we address an “isomer competing” process in the initial stage of the formation of Family 463. For the size characterization of Family 463, TEM proved to be challenging due to the significant aggregation during the TEM sample preparation; diffusion ordered spectroscopy nuclear magnetic resonance (DOSY-NMR) suggests 2.1 nm for the size of Family 463.113Cd solid-state magic-angle spinning (MAS) NMR is able
to distinguish surface (at a chemical shift of 422 ppm) and bulk (680 ppm) Cd species bonding to both -COO and Se, or to Se only, respectively.
2. Experimental Section
2.1. Chemicals and Synthesis. All chemicals used are commercial available and were used as received. Cadmium acetate dihydrate (Cd(OAc)2·2H2O, 99.999%) and selenium
powder (325 mesh, 99.5%) were from Alfa Aeser. The straight-chain carboxylic acids used were from Aldrich with highest purities (g99%); they were butyric acid (C4), hexanoic acid (C6), caprylic acid (C8), capric acid (C10), lauric acid (C12), myristic acid (C14, MA), stearic acid (C18, SA), arachidic acid (C20), behenic acid (C22), and liginoceric acid (C24). 1-Oc-tadecene (ODE, tech. 90%) was from Aldrich.
For the preparation of CdSe nanocrystals (MSNs), a nonin-jection one-pot approach in ODE was used. Typically, selenium powder (0.05 mmol), cadmium acetate dihydrate (with varied mmols according to the Cd-to-Se feed molar ratio), a carboxylic acid (with varied mmols according to the acid-to-Cd feed molar ratio), and ODE (5.0 g) were loaded in a 50 mL three-necked round-bottom reaction flask at room temperature. The two feed molar ratios of Cd-to-Se and acid-to-Cd were investigated, ranging from 1Cd-to-2Se to 8Cd-to-1Se and from 4acid-to-1Cd to 1acid-to-4Cd. In the examination of the acid alkyl chain length affecting the formation of Family 463, selenium powder (0.05 mmol), cadmium acetate dihydrate (0.2 mmol), a carboxylic acid (0.133 mmol), and ODE (5.0 g) were loaded, with the fixed 1.5acid-to-1Cd and 4Cd-to-1Se feed molar ratios; the acids used were from C2 to C24, with the number referring to the total number of carbon.
The growth was at elevated temperature, with two protocols to increase the reaction temperature from room temperature,
namely nonstop heating and stepwise heating. The mixture in the flask was degassed under vacuum (∼50 mTorr) for 20 min while stirring, and then, the flask was heated to 120 °C and kept at this temperature for two hours, in order to form the Cd precursor and to remove acetic acid and moisture. Afterward, under a flow of purified nitrogen for the nonstop-heating reaction, the reaction flask was heated to its reaction temperature (200°C-240°C) at a rate of ca. 20°C/min. To monitor the formation of the nanocrystals, a small amount of aliquots (∼0.2 mL) were taken from the reaction mixture at 200 °C/0 min, 220 °C/0 min, and 240°C with the growth periods of 0-90 min. For the stepwise-heating reaction, one sample was taken at 120°C before increasing the reaction temperature. When the temperature was kept for 30-120 min at certain intervals between 140 and 265°C, aliquots were taken from the reaction mixture to monitor the growth of the nanocrystals.
2.2. Optical Measurements together with Mass, TEM, and NMR Characterization.For the as-synthesized samples (with-out purification, namely reaction crude samples) dispersed in toluene at room temperature, optical measurements were performed. Ultraviolet-visible (UV-vis) absorption spectra were collected using a 1-nm data collection interval (Perkin-Elmer Lambda 45 spectrometer). Photoemission spectra were collected with the excitation wavelengths of 350, 400, and/or 430 nm, an increment of data collection of 1 nm, and the slits of 3 nm (Fluoromax-3 spectrometer, Jobin Yvon Horiba, Instruments SA, with a 450-W Xe lamp as the excitation source). For the emission analysis, Gaussian-fitted and baseline-subtracted integration was performed using built-in Fluoromax3 software functions to yield emission peak, fwhm, and area (intensity). PL quantum yield (QY) was estimated by comparing with that of quinine sulfate in 0.05 M H2SO4(Lit. QY of 0.546).
Corrections were made for the difference of the refractive index of the two solvents.
Laser desorption ionization (LDI) mass spectra were acquired in the linear mode in either positive or negative ion mode without the use of a matrix (Voyager DE-STR instrument, AB/ MDS-Sciex, Concord, ON). One raw reaction product from a synthetic batch with the 1MA-to-1Cd and 4Cd-to-1Se feed molar ratios and the growth of 120 min/240 °C was centrifuged to remove ODE. The CdSe MSQD sample dispersed in toluene was spotted on a steel target and allowed to air-dry. No additives were used, since no positive effects on ionization were obtained with the addition of salts. The MS spectrum was acquired by adjusting the laser power until peaks became apparent, with an average of 400 laser shots per spectrum. Instrument calibration was performed in the MALDI-MS mode with peptides as calibrates.
The transmission electron microscopy (TEM) sample was prepared by depositing diluted purified nanocrystal dispersion in toluene onto a 300-mesh carbon-coated TEM copper grid and allowed to air-dry. TEM images were collected on a JEOL JEM-2100F electron microscope operating at 200 kV and equipped with a Gatan UltraScan 1000 CCD camera. The powder X-ray diffraction (XRD) sample was prepared by depositing the purified nanocrystals on a low-background quartz plate. The XRD patterns were recorded at room temperature on a Bruker AXS D8 X-ray diffractometer using Cu KR radiation in aθ-θ mode. The generator was operated at 40 kV and 40 mA, with data collected between 5°and 80°in 2θ mode, a step size of 0.1°, and a counting time of 5 s per step.
Solution NMR was carried out to characterize the size of the CdSe MSNs dispersed in toluene, with diffusion ordered spectroscopy (DOSY) NMR. CdSe Family 463 (with two rounds
of purification in toluene/methanol followed by drying in air) was dissolved in toluene-d8. Diffusion coefficients were
mea-sured using standard Bruker pulse sequences, together with an internal standard of heptakis(2,3,6-trio-methyl)-β-cyclodextrin, which has an average diameter of 1.4 nm. According to the Stokes-Einstein equation, the diffusion coefficient of a particle is inversely proportional to its diameter; thus, the size of one nanocrystal ensemble was calculated from the ratio of its diffusion coefficient to that of the internal standard. The use of an internal standard eliminates the need for parameters such as the sample viscosity and the temperature. The NMR study was performed with a Bruker DRX-400 spectrometer equipped with an inverse detected Z-gradient probe.
Solid-state NMR spectra of Family 463 were obtained on a Bruker AMX300 spectrometer with a Doty Scientific Inc. 5 mm probe using silicon nitride rotors. 113Cd NMR magic angle
spinning (MAS) spectra were obtained at 66.58 MHz, both with and without1H cross-polarization (CP). For spectra without CP,
a simple one pulse sequence with phase cycling was used, with a 90°pulse length of 4.0 ms and spin rates from 6.3 to 7.3 kHz. A recycle time of 120 s was used and collection times were of the order of 1.5-2.75 days.113Cd CP/MAS spectra were
obtained with CP times of 5-15 ms, recycle times of 1-2 s, and collection times of 7-44 h. Chemical shifts were referenced to Cd(NO3)2·4H2O (powdered, under MAS). Standard13C CP/
MAS spectra at 75.43 MHz were obtained with a CP time of 3 ms and 4 s recycle times, and dipolar dephasing spectra were obtained with an interruption of1H decoupling of 40µs before
data acquisition (referenced to TMS via external hexamethyl-benzene). The sample for solid state NMR was synthesized from a batch with the 1C14-to-4Cd and 4Cd-to-1Se feed molar ratios and with 60-min growth at 220°C.
3. Results and Discussion
The synthesis-structure-property relationship has always been highlighted in our laboratories, with our efforts on monitoring the growth kinetics via the temporal evolution of the optical properties of the growing nanocrystals and on the characterization with various techniques including nuclear magnetic resonance (NMR).17,18With our noninjection one-pot
approach, various synthetic parameters and the interplay between them affect the formation of the single-sized ensemble. Thus, there are three parts in this section. Part one (section 3.1) addresses the growth kinetics of CdSe MSN Family 463, focusing on the Cd-to-Se (section 3.1.1) and acid-to-Cd (section 3.1.2) feed molar ratios and the nature of the acids (section 3.1.3) used affecting the formation of the nanocrystals and their thermal stability. Part two (section 3.2) deals with the structural and compositional characterization of the resulting Family 463, in the order of MS, TEM, solution NMR, and solid-state NMR. Part three (section 3.3) presents the shelf-storage stability of the resulting colloidal nanocrystals.
3.1. Growth Kinetics of CdSe MSN Family 463. The MSNs are different from regular nanocystals, regarding their thermal stability during synthesis: they do not grow in size after they are well established, but decompose with longer growth periods or higher reaction temperature. In the order of decreasing the MA-to-Cd feed molar ratios, we demonstrate that the low acid-to-Cd and high Cd-to-Se feed molar ratios are crucial to obtain CdSe MSNs in pure form with our synthetic approach.14
Also, we reveal that C12-C18 acids are optimum for the growth of Family 463, with respect to the yield, purity, and PL efficiency.
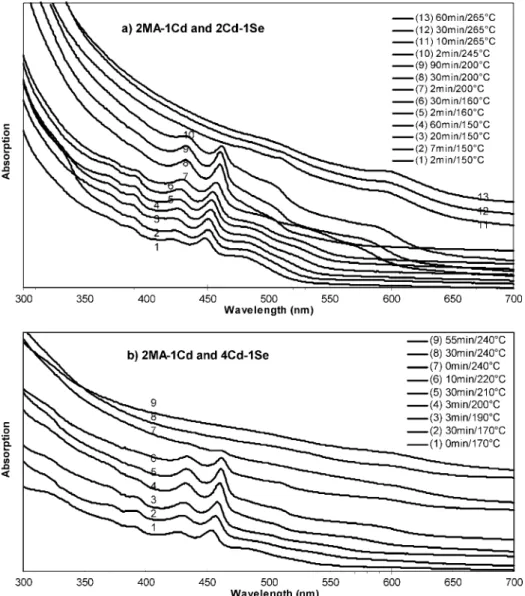
3.1.1. 2MA (C14)-to-1Cd and (2∼8) Cd-to-1Se Feed Molar Ratios.Figure 1 shows the temporal evolution of the absorption spectra of the nanocrystals from two synthetic batches with the fixed feed molar ratio of 2MA-to-1Cd but different Cd-to-Se feed molar ratios of 2Cd-to-1Se (1a) and 4Cd-to-1Se (1b). With the acid-to-Cd feed molar ratios larger than two, only regular QDs were synthesized;14thus, the present study only deals with
the acid-to-Cd feed molar ratios not larger than two. For batch 1a, the coexistence of CdSe MSN Family 463 and regular CdSe QDs is significant. Under the present experimental setup, the thermal stability of Family 463 was up to 245°C and that of the regular CdSe QDs was at least 265 °C. For Family 463, when the reaction temperature increased from 150 to 245°C, a redshift of about 13 nm was observed from 448 to 461 nm; for the regular QDs, when the reaction temperature increased from 200 to 265°C, a redshift of about 30 nm was observed from ca. 570 nm to ca. 600 nm. It is clear that the regular QDs (with absorption from ca. 520 nm at 160°C to ca. 600 nm at 265°C) are larger than Family 463, implying that the thermal stability increases with the nanocrystal size. Family 463 exhibited much narrower bandgap PL emission than the regular QDs (see the Supporting Information, Figure S1).
Surprisingly, Family 463 exhibited its “growth” process, via the continuous redshift of it absorption peak positions as monitored during the increase of the reaction temperature from 150 to 245 °C. It is clear that the “growth” was so slow that such a redshift was monitored. With other MA-to-Cd feed molar ratios smaller than two, the “growth” seemed to be faster (as shown in Figure 2). It seems that with the 2MA-to-1Cd feed molar ratio there was a coexistence of the two Cd precursors, Cd(OAc)(MA) and Cd(MA)2, as
shown in eq 2a. When the acid-to-Cd feed molar ratio is larger than two, the Cd precursor is Cd(OOC-(CH2)n-CH3)2
(as shown in eq 2b); when the acid-to-Cd feed molar ratio is smaller than two, the Cd precursor is Cd(OAc)x(OOC-(CH2)n
-CH3)2-x (as shown in eq 2a). Cd(OAc)(MA) released Cd2+
relatively slowly in ODE, as compared to Cd(MA)2in the
temperature range studied. The slow release of Cd2+meets
the requirement of the thermodynamic growth of MSNs; due to the presence of regular QDs which consumed Cd2+, the
available Cd2+ for the “growth” of Family 463 might be
further limited. Therefore, the formation of Family 463 in batch 1a was so slow that the redshift from 448 to 461 nm was readily monitored.
Figure 1. Temporal evolution of the UV-vis absorption spectra (offset) of the growing CdSe nanocrystals from the two synthetic batches with the fixed feed molar ratio of 2MA-to-1Cd but different Cd-to-Se feed molar ratios of 2Cd-to-1Se (a) and 4Cd-to-1Se (b). The nanocrystals sampled with the different growth periods/temperature were indicated. The UV-vis absorption spectra are presented with 40µL crude product in 3 mL toluene (a, the y axis maximum of 0.4) and 20µL crude product in 3 mL toluene (b, the y axis maximum of 0.3). Batch 1b produced relatively high yield of Family 463, as compared to batch 1a. Figure S1 shows the example of emission of the two samples with 30-min growth at 200°C and 30-min growth at 265°C from batch 1a.
Cd(OAc)2+MA f Cd(OAc)(MA) f Cd 2+ f (CdSe)j (2a) Cd(OAc)(MA) + MA f Cd(MA)2f Cd 2+ f (CdSe)k (2b)
For batch 1b with the feed molar ratio of 4Cd-to-1Se instead of 2Cd-to-1Se, the presence of regular QDs was very much suppressed. When the Cd-to-Se feed molar ratio was further increased to 8Cd-to-1Se (data not shown), the thermal stability of Family 463 increased at 240°C, together with much more inhibition of the presence of regular QDs.14Therefore, with the
feed molar ratio of 2MA-to-1Cd, Family 463 coexisted with regular QDs; large Cd-to-Se feed molar ratios favor the formation of Family 463 with enhanced thermal stability during synthesis, while restraining the formation of regular QDs.
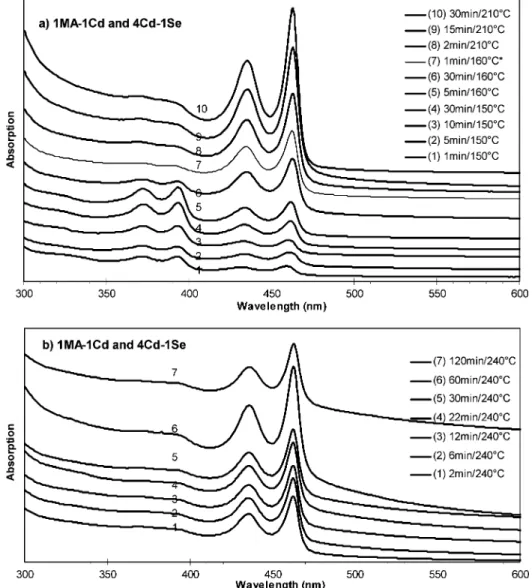
3.1.2. 1MA (C14)-to-(1 ∼ 4) Cd and 4Cd-to-1Se Feed Molar Ratios.With the fixed 4Cd-to-1Se feed molar ratio, the MA-to-Cd feed molar ratio was reduced to promote Family 463. Figure 2 shows the temporal evolution of the absorption spectra of the nanocrystals from two synthetic batches with the 1MA-to-1Cd and 4Cd-to-1Se feed molar ratios; the reaction
temper-ature was increase from room tempertemper-ature via stepwise heating (2a) and nonstop heating (2b). There were little regular QDs from both batches. The presence of Family 395 was detected in batch 2a, and the disappearance was after 30 min at 160°C. Family 463 in pure form was achieved afterward, namely after the decomposition of Family 395 which is smaller in size than Family 463. The formation of Family 463 continued after the decomposition of Family 395 into monomers beyond 160°C. With our noninjection experimental setup in batch 2a, CdSe MSN Family 395 and Family 463 were formed simultaneously. There was no sign of the development of Family 395 into Family 463; instead, the dissolution of Family 395 due to limited thermal stability provided monomers to the formation of more Family 463. Meanwhile, it is clear that the MA-to-Cd feed molar ratios are crucial: excess acid (more than equivalent) leads to the formation of regular QDs, while deficient acid promotes the formation of CdSe MSNs.14 The deficient amount of acid
results in the different Cd precursors as addressed in eq 2a.
Figure 2. Temporal evolution of the UV-vis absorption spectra (offset) of the growing CdSe nanocrystals from the two synthetic batches with the same feed molar ratios of 1MA-to-1Cd and 4Cd-to-1Se but different temperature increase pattern of stepwise (a) and nonstop (b). The nanocrystals sampled with the different growth periods/temperature were indicated. Sample 2a-7 was after the reaction flask stored overnight at room temperature and reheated to 160°C. The UV-vis absorption spectra are presented with 20µL of crude product in 3 mL of toluene for both a (the y axis maximum of 0.79) and b (the y axis maximum of 0.9). Figure S2 shows the summary of the optical properties of the nanocrystals from batch 2b. Also, Figure S3 shows the temporal evolution of the UV-vis absorption spectra of the growing CdSe nanocrystals from the synthetic batch with the feed molar ratios of 1MA-to-2Cd and 4Cd-to-1Se and the nonstop temperature increase pattern from 120 to 240°C at a rate of 20°C/min. The growth similarity of the nanocrystals from batches 2b and S3 is worthy of notice.
The coexistence of Family 395 and Family 463 below 160
°C encouraged us to perform nonstop heating, as shown in Figure 2b. The formation of Family 463 was in pure form from batch 2b; therefore, nonstop heating was used to study the nature of acids affecting the formation of Family 463 presented in section 3.1.3. Figure S2 in the Supporting Information shows that Family 463 exhibits an absorption doublet peaking at 435 and 463 nm.
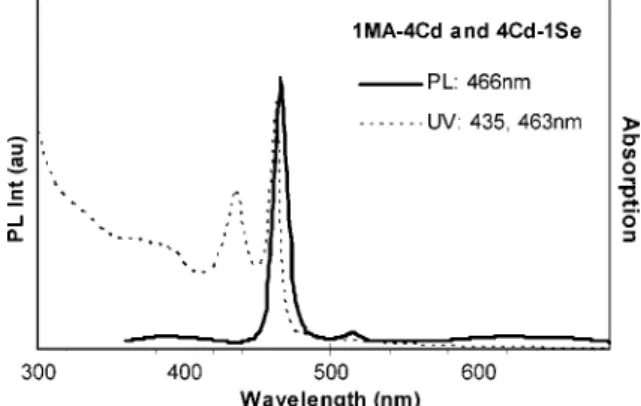
Further reduction of the acid amount to the 1MA-to-2Cd feed molar ratio resulted in the very much similar outcome shown in Figure 2; the temporal evolution of the absorption spectra of the nanocrystals from the synthetic batch with the 1MA-to-2Cd and 4Cd-to-1Se feed molar ratios is shown in the Supporting Information, Figure S3. Also, the growth of Family 463 in pure form with an increase in number went on for 60 min at 240°C, similar to that shown in Figure 2b. Such similarity in the growth kinetics of the nanocrystals from the batches with the fixed 4Cd-to-1Se feed molar ratio but to-1Cd (batch 2b) and 1acid-to-2Cd (batch S3) led us to use the fixed 1acid-to-1.5Cd and 4Cd-to-1Se feed molar ratios to study the nature of acids affecting the formation of Family 463 presented in section 3.1.3. Figure 3 shows the optical spectra of Family 463 from the batch with the 1MA-to-4Cd and 4Cd-to-1Se feed molar ratios and the growth/annealing temperature at 220°C.
3.1.3. Various Acids with 1Acid-to-1.5Cd and 4Cd-to-1Se Feed Molar Ratios.Acids HOOC-(CH2)n-CH3, with different
carbon chain length, have different solubility, mobility, and binding strength to Cd in ODE. Thus, the nature of acids affecting the formation of Family 463 was investigated, with the fixed 1acid-to-1.5Cd and 4Cd-to-1Se feed molar ratios and the nonstop heating approach to increase the reaction temper-ature from 120 to 240°C at a heating rate of 20°C/min. The effect of the ligand length on the growth of nanocrystals has been acknowledged in other systems, such as CdS RQDs19and
InP RQDs.20
Figure 4 shows the absorption spectra of the nanocrystals from the 10 synthetic batches with the use of C2-24 acids; the reaction temperature was at 240°C with the growth period of 8 min. As addressed in the Experimental Section, for the batches with the nonstop heating from 120 up to 240°C, small amount of aliquots were taken at 0 min/200 °C, 0min/220°C, and at 240°C with the growth periods of 0-90 min. Figure S4 in the Supporting Information summarizes the optical density at 463 nm of the growing nanocrystals sampled from the ten batches. It is clear that Family 463 was produced with the 10 batches. The C2-10 and C22-24 acids bestowed relatively low yields of Family 463, as compared with the C12-20 acids. The
presence of Family 513 was noticed with the acids longer than C18; furthermore, for the acids longer than C24, they resulted in Family 513 in non-negligible amounts under the same synthetic conditions.14The present study addresses the synthesis
of Family 463 in pure form, and the C12-18 acids are the optimal choices. For the short acids such as C2-10, the release of Cd2+is slow due to the low solubility of the Cd precursor in
ODE; for the long acids such as C22-24, the steric hindrance of the long carbon chain slows down the formation of Family 463, together with the consumption of Cd2+ by Family 513.
Accordingly, the growth of the CdSe MSNs via the present noninjection one-pot approach is controlled mainly by the rate of the release of Cd2+from the Cd precursor in ODE; this rate
is affected by the nature and amount of the acid.
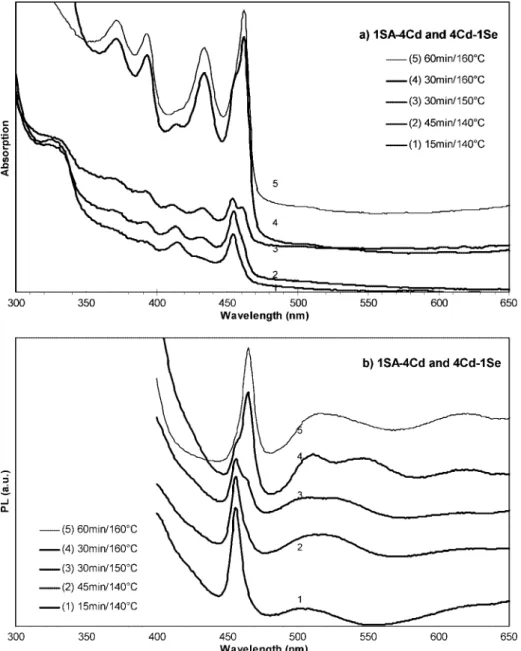
3.1.4. Initial Stage of the Formation of Family 463. As mentioned above, about 13 nm redshift of Family 463 in batch 1a was observed from 448 to 461 nm, when the reaction temperature increased from 150 to 245°C. Using another fatty acid, stearic acid (SA, C18), we performed the synthesis with stepwise heating and the 1SA-to-4Cd and 4Cd-to-1Se feed molar ratios to further explore the initial stage of the formation of Family 463. Figure 5 shows the temporal evolution of the absorption (5a) and emission (5b) spectra of the nanocrystals from this batch, with the reaction temperature of 140-160°C, i.e., in the initial stage of the growth of Family 463. Figure S5 in the Supporting Information shows the temporal evolution of the absorption spectra of the nanocrystals from this batch but with the reaction temperature of 160-220°C, namely the later stage of the growth of Family 463.
As shown in Figure 5, Family 463 at 15 min/140°C (curve 1) exhibited absorption peaking at 454 nm and emission at 456 nm. Afterward, Family 463 at 30 min/150°C (curve 3) exhibited absorption peaking at 454 and 460 nm and emission at 456 and ca. 465 nm. Family 463 at 60 min/160°C (curve 5) exhibited absorption peaking at 462 nm and emission at 465 nm. The present study does not address the presence of other species
Figure 3. Absorption (thin dashed line) and photoemission (thick black line, excited at 350 nm) spectra of the CdSe MSQDs, Family 463 from the synthetic batch with the 1MA-to-4Cd and 4Cd-to-1Se feed molar ratios and 50-min growth at 220°C.
Figure 4. UV-vis absorption spectra (offset) of the growing CdSe nanocrystals from the 10 synthetic batches with the same feed molar ratios of 1acid-to-1.5Cd and 4Cd-to-1Se and the nonstop temperature increase pattern from 120 to 240°C. The nanocrystals were synthesized with the acids indicated and sampled at 8-min growth at 240°C. The UV-vis absorption spectra are presented with 10µL of crude product in 3 mL of toluene, except for C02 acid with 100µL of crude product in 3 mL of toluene. Figure S4 summarizes the optical density at 463 nm of the nanocrystals from the ten batches but sampled at different growth temperature and periods.
such as Family 395 and Family 414. The presence of Family 414 without bandgap emission is worthy of notice; Family 414 was reported before by other groups.10 Both Family 395 and
Family 414 disappeared at 170°C, whereas Family 513 showed up at 220°C (as shown in Figure S5).
Let us turn our attention back to Family 463. Interestingly, from 15 min/140°C to 45 min/140°C, a shoulder appeared at the lower energy side of the absorption peak at 454 nm. This shoulder developed with the growth periods and temperature and became the predominant peak at 30 min/160°C peaking at 462 nm, overruling the original peak at 454 nm as a shoulder. At 60 min/160°C, this peak at 462 nm became symmetric with the disappearance of the shoulder. A similar trend is obvious with the corresponding PL emission spectra shown in Figure
5b. Thus, in the initial stage of the formation of Family 463 as shown in Figure 5, the nanocrystals at 15 min/140°C exhibiting absorption peaking at 454 nm and emission at 456, are, likely, a structural isomer, of those at 60 min/160 °C exhibiting absorption peaking at 462 nm and emission at 465 nm. These two ensembles, coexisting during the reaction between 15 min/ 140 °C and 60 min/160°C, may be isomers with very much similar atomic composition, but different thermal stability. Such an “isomer competing” process may explain, partially, the observed red-shifting of the bandgap PL during the growth of CdSe MSN Family 463 shown in Figure 1a. Figure S5 in the Supporting Information shows a similar “isomer competing” phenomenon of Family 463 from another synthetic batch with different synthetic conditions.
Figure 5. Temporal evolution of the UV-vis absorption spectra (a, offset) and photoemission spectra (b, offset) of the growing CdSe nanocrystals from the synthetic batch with the 1SA-to-4Cd and 4Cd-to-1Se feed molar ratios. The five nanocrystal ensembles sampled with the different growth periods/temperature were indicated (from 15 min/140°C to 60 min/160°C). The UV-vis absorption spectra are presented with 30µL of crude product in 3 mL of toluene (a, the y axis maximum of 0.12) and b (the y axis maximum of 7.5 × 10⁵). Also, Figure S5 shows the temporal evolution
of the UV-vis absorption spectra of the growing CdSe nanocrystals from the same synthetic batch but sampled afterward, from 60 min/160°C (sample 5) to 90 min/220°C (sample 12) and overnight/220°C (sample 13). Thus, Figures 5 and S5 describe the temporal evolution of the optical properties of the growing CdSe nanocrystals from the same synthetic batch, with the growth temperature for Figure 5 of 140-160°C (of samples 1-5) and for Figure S5 of 160-220°C (of samples 5-13). The possible “isomer competing” is worthy of notice in the initial stage of the formation of Family 463; another example of such process is shown in Figure S6.
3.2. Characterization of CdSe MSN Family 463.
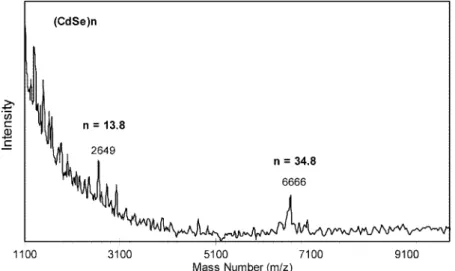
3.2.1. Mass Spectrometry. Mass spectrometry was employed for the information on the composition and structure of magic-sized nanoclusters.10Figure 6 shows the mass spectrum acquired
with our Family 463. In the range of mass number (m/z) greater than 2100, the two outstanding peaks at 2649 and 6666 correspond to (CdSe)nwith n ) 13.8 and 34.8, respectively. In
the range of mass number (m/z) smaller than 2100, the presence of particles with n < 13.8 is also noticed. It is noteworthy that literature reported n ) 13, 33, and 34;10 thus, similar stable
species are indicated by our mass spectrometric measurement. We would like to point out that MS suggests the presence of relatively stable species during the measurement; efforts are underway to clarify the composition and structure of our CdSe MSN Family 463.
3.2.2. TEM.Figure 7 shows one typical TEM image of our purified Family 463; the TEM sample grid was prepared from air-dying purified nanocrystal dispersion in toluene. Interest-ingly, wire-like aggregates are present with the width of ca. 2-4 nm. With the scale bar of 20 nm, the inset demonstrates clearly the presence of crystal lattices in the area labeled by the dashed square. Another example of the wire-like aggregates is shown in the Supporting Information, Figure S7.
It has been reported that single-sized nanocrystals have a strong tendency to aggregate/coalesce due to their highly uniform size and high surface energy.21For our CdSe MSNs, such a tendency
could be demonstrated by the presence of a muddy mixture in a synthetic batch at elevated reaction temperature; the muddy appearance has become our experimental indicator for the formation of MSNs. When the as-synthesized MSNs are dispersed in organic solvents such as hexane, toluene, and chloroform, they tend to aggregate and precipitate out of the resulting dilute dispersions; gentle shaking would easily break up the aggregation and bring them back in the solvents. After purification, they are easier to agglomerate, as judged from the cloudiness of their dilute disper-sions; still, shaking or sonication can break up the aggregation and result in clear dispersions exhibiting bandgap absorption and emission. For TEM and XRD characterization, the purified CdSe MSNs were dispersed in a solvent (such as toluene) and dried afterward on TEM copper grids or XRD quartz plates. During the drying process, the aggregation/coalescence of the purified MSNs took place and became irreversible. The present study does not address such an interesting issue, namely the self-assembly of single-sized nanocrystals; it helps to point out that various mor-phologies were observed, including spherical-like, wire-like, and
sheet-like assembles. The spherical-like aggregates are larger than Family 463, the size of which is estimated as 2.05 nm based on the absorption peak at 463 nm.5cThe wire-like aggregates could
be up to 100 nm long with their width slightly larger than the size of Family 463. Note that the degree of aggregation depends on the detailed preparation of the TEM and XRD samples; the solvent/ nonsolvent pair used (such as toluene/methanol) for the purification and repeating rounds, together with the dispersion media of the purified nanocrystals play important roles. It was reported that the dipole-dipole interactions were the driving force for the formation of the CdSe22and CdTe23nanowires in solution (via the aggregation
of QDs).
3.2.3. 1H-DOSY-NMR.As shown above, for the size
deter-mination of ultrasmall nanocrystals and single-sized nanocrys-tals, the analysis of XRD and TEM results is problematic because of the spontaneous aggregation during the sample preparation. Meanwhile,1H-DOSY-NMR was introduced as a
Figure 6. Laser-desorption-ionization (LDI) mass spectrum acquired in a positive ion mode from our CdSe MSQD Family 463 in toluene.
Figure 7. One typical TEM image of our purified Family 463. The Family 463 was from a batch with the 1MA-to-4Cd and 4Cd-to-1Se feed molar ratios and the growth of 60 min/220°C. Obviously, the ready aggregation/self-assembly of the single-sized nanocrystals, such as CdSe Family 463, during the TEM sample preparation, challenges TEM on the size characterization.
powerful tool in the determination of the size of colloidal nanocrystals with capping ligands.24It is known that based on
translational diffusion rates, DOSY-NMR is a powerful tech-nique to investigate materials, with typical applications including polymers, micelle formation, and protein bindings.25
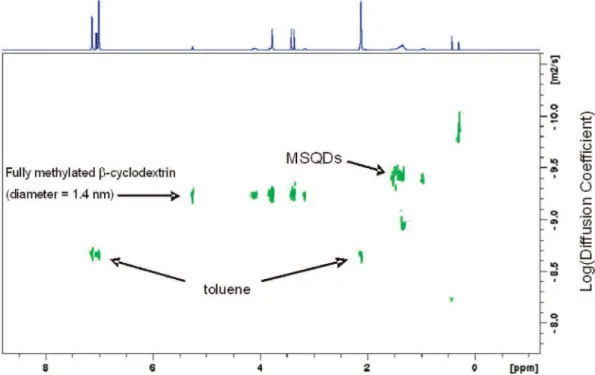
Figure 8 shows a proton 2D DOSY-NMR spectrum of Family 463 in toluene-d8, with chemical shift versus diffusion
coef-ficient. All toluene resonances (7.10-6.95 and 2.09 ppm) appear at a diffusion coefficient of 10-8.67 m2s-1, which is the
self-diffusion coefficient of toluene. With Stokes-Einstein equation, the diffusion coefficient of a species can be related to its hydrodynamic diameter dHin solution (eq 3)
dH)k
BT⁄ 3πηD (3)
where kB is the Boltzmann constant and η is the dynamic
viscosity of the liquid. In the case of a hard-sphere particle, dH
is equal to the true diameter of the particle.24a For colloidal
nanocrystals, dHis systematically larger than dNCbecause the
hydrodynamic diameter corresponds to the sum of dNCand the
contribution of the capping layer. In order to obtain accurate data, an internal standard heptakis(2,3,6-tri-o-methyl)-β-cyclo-dextrin, with an average diameter of 1.4 nm, was used to eliminate the effects of several factors such as sample viscosity and temperature. The hydrodynamic effect can not be completely eliminated because it is size-dependent; large particles have small hydrodynamic effect. According to Figure 8, the size of CdSe MSN Family 463 was determined to be 1.4 × (10-9.229
/ 10-9.399) ) 2.1 nm, which is close to 2.05 nm estimated from
the first excitonic absorption peak position at 463 nm.5c
In future work, the diffusion coefficients of well-characterized QD ensembles will be measured by DOSY-NMR and their sizes will be calculated. The DOSY-NMR size will be compared to the sizes obtained by other techniques, such as Raman scatter-ing,26 in order to further validate the DOSY approach. Also,
for CdSe QD ensembles exhibiting the same bandgap absorption peak positions but with different surface ligands, DOSY-NMR
will be performed to investigate the surface ligand effect. After the measurements of a series of QDs in toluene-d8at a constant
concentration, the size of an unknown spherical QD sample should be deduced easily, with calibration curves constructed. 3.2.4. Solid-state NMR.As shown in Figure 9a, the normal
1H-13C cross-polarization CP/MAS NMR spectrum of pure
myristic acid (CH3-(CH2)12-COOH) shows resonances in four
main regions: COOH at 181.7 ppm, CH3at 15.0 ppm, CH2
adjacent to CH3at 25.0 ppm and all the other CH2groups in
the range 30-36 ppm with the main peak at 33.0 ppm. The dipolar-dephased spectrum, Figure 9b, shows only those C atoms that are not strongly dipolar-coupled to1H, namely quaternary
carbons, in this case the COOH, and any proton-bearing carbons that are in motion so that their dipolar coupling is reduced, in this case the CH3group.27This shows that the myristic acid is
rigidly fixed in the solid and the only dynamics possible is the internal rotation of CH3. On the other hand the13C CP/MAS
NMR spectrum of Family 463, Figure 9c, which presumably now represents anions rather than acid, shows two carboxylate (-COO
-) peaks (182.3 and 184.3 ppm-), a CH3peak (14.7 ppm),
and the CH2regions (22.5-25.2 and 29-36 ppm) are more
complex than in the acid. The splitting of the carboxylate resonance may indicate different coordination sites or possibly the presence of acetate as well as myristate. The dipolar dephased spectrum, Figure 9d, again shows the COO
-and CH3
resonances, and also several but not all of the CH2groups. The
logical interpretation is that the carboxylate is attached to the Cd of the surface and the CH2closest to this are not mobile,
whereas the ones closer to the end of the chain become increasingly mobile due to wagging and twisting motions (reducing the C-H dipolar coupling and thus making these visible in the dephased spectrum).
The fact that the carboxylate anions are firmly attached to the surface makes it possible to cross-polarize from1H to113Cd,
and obtain a CP/MAS NMR spectrum, Figure 10d, in which signals from any Cd at or close to the surface should show
Figure 8. Proton 2D DOSY-NMR spectrum of Family 463 in toluene-d8. Heptakis(2,3,6-tri-o-methyl)-β-cyclodextrin with an average diameter of
1.4 nm was used as an internal standard; its diffusion coefficient was measured as 10-9.229m2s-1. Toluene exhibited its resonances at 7.10-6.95
and 2.09 ppm with a diffusion coefficient of 10-8.67m2s-1. An average diffusion coefficient of CdSe MSN Family 463 was measured as 10-9.399
m2s-1; thus, the size was determined to be 1.4 × (10-9.229/10-9.399) ) 2.1 nm.
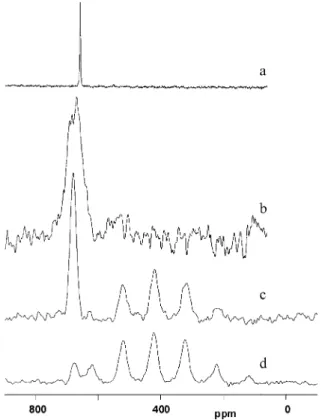
strongly relative to Cd deeper in the particle. Conversely, the
113Cd MAS NMR spectrum, Figure 10c, obtained with single
pulse excitation without CP but with high power1H decoupling
(HPDEC) should show all Cd. There are resonances from only two types of Cd visible: (i) a relatively sharp line at 680 ppm (fwhm ) 1280 Hz) close to that of bulk CdSe at 657.7 ppm (fwhm ) 138 Hz),17 as shown in Figure 10a, or CdSe/TOP
3.5nm QDs at 676 ppm (fwhm ) 3750 Hz),17as shown in Figure
10b, with little if any chemical shift anisotropy (csa). This line shows strongly in the HPDEC spectrum and weakly in the CP/ MAS spectrum and therefore corresponds to core Cd tetrahe-drally coordinated by 4 Se. Note that this line is significantly narrower than that of the 3.5 nm QD studied previously, indicative of a smaller distribution of Cd environments; (ii) a second line at isotropic shift of 422 ppm (fwhm ∼ 1750 Hz) with numerous spinning sidebands, which indicate a large csa arising from an anisotropic environment. This resonance is enhanced relative to the 680 ppm line in the CP spectrum and therefore can be assigned to the surface Cd, to which the carboxylates presumably are attached. The large decrease in chemical shift relative to the core Cd line is consistent with increased O and reduced Se coordination: we observed Cd resonances for bulk Cd acetate and Cd myristate in the 0-60 ppm region. A similar spectral pattern was observed in studies of ZnCdS nanoparticles and our magic-sized QDs such as CdTe and CdTeSe but with the two principal resonances at varied shifts.18
It is quite surprising that there are only two prominent reso-nances, as this implies that there is no transition zone between core and surface, but this should help restrict the number of possible models for the structure of these nanoparticles. Under high power
1H decoupling (HPDEC), provided the recycling time is long
enough, the integrated intensities of the lines (including spinning sidebands) give quantitative information about the two types of Cd; that is, the core:surface ratio is found to be ∼0.81. Once a suitable model of the core and surface structure has been developed it should be possible to estimate the particle size, excluding the organic coating, from this ratio.
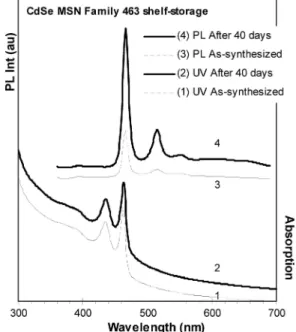
3.3. Storage Stability. The storage stability of CdSe MSN Family 463 was explored. Figure 11 shows the optical spectra of the as-synthesized Family 463 in toluene and after a 40-day storage period in the dark at ca. 10°C. With such storage, the Family 463 dispersion in toluene exhibited a significant enhancement in its emission efficiency with little change in its absorption. Such enhancement of the emission efficiency after storage was observed in other QD dispersions and was argued to be resulted from surface passivation by small molecules such as oxygen and moisture.6b,28,29
Thus, the Family 463 dispersion in toluene had good storage stability. For purified Family 463, it also had good shelf-storage stability, as shown in Supporting Information Figure S8, which shows the absorption and emission spectra of the purified Family 463 after eight-month storage at room temperature in the dark and then dispersed in toluene for the optical measurement.
4. Conclusions
CdSe single-sized nanocrystal Family 463, exhibiting bandgap absorption and emission peaking at ca. 463 and 465 nm, respectively, was readily synthesized via a noninjection one-pot approach. The synthetic parameters, such as acid-to-Cd and Cd-to-Se feed molar ratios, reaction temperature, and the nature of the acid HOOC-(CH2)n-CH3were investigated in detail.
Low acid-to-Cd and high Cd-to-Se feed molar ratios are crucial to get high-quality CdSe MSN Family 463 in pure form. With the acid-to-Cd feed molar ratio smaller than two, the Cd
Figure 9. 13C CP/MAS NMR spectra of myristic acid (a) normal CP
and (b) with dipolar dephasing, and of Family 463 CdSe nanocrystals capped with myristic acid (c) normal CP and (d) with dipolar dephasing.
Figure 10. 113Cd MAS NMR spectra of (a) bulk hexagonal CdSe,17(b)
CdSe regular quantum dots with TOP/TOPO capping agent (also hexagonal structure),17(c) Family 463 with high power decoupling (HPDEC, spin
rate 6.6 kHz), and (d) Family 463 using CP/MAS (CP time ) 1 ms, spin rate ) 6.6 kHz). Spectra (c) and (d) are normalized on the 422 ppm line.
precursor is in the form of Cd(OAc)x(OOC-(CH2)n-CH3)2-x,
which releases Cd2+in ODE relatively slowly as compared with
Cd(OOC-(CH2)n-CH3)2formed with the acid-to-Cd feed molar
ratio larger than two. The rate of the Cd2+ release from
Cd(OAc)x(OOC-(CH2)n-CH3)2-xdominates the formation of
Family 463. The C12-18 acids are optimum choices for Family 463 with high yield and in pure form with the reaction temperature of ca. 220°C. In the initial stage of the formation, an “isomer competing” process may exist. The Family 463 was characterized by MS, TEM, XRD, DOSY-NMR, and solid-state NMR. During the TEM and XRD sample preparation, significant aggregation/coalescence occurred due to the small and highly uniform dimension of Family 463 and high surface energy. DOSY-NMR bestowed the size of 2.1 nm. Our Family 463 has good shelf-storage stability.
Supporting Information Available: The optical properties of the two samples with 30-min growth at 200°C and 30-min growth at 265°C from batch 1a (Figure S1), the summary of the optical properties of the growing nanocrystals from batch 2b (Figure S2), the temporal evolution of the UV-vis absorption spectra of the growing CdSe nanocrystals from the synthetic batch with the feed molar ratios of 1MA-to-2Cd and 4Cd-to-1Se and the nonstop temperature increase pattern from 120 to 240°C at a rate of 20°C/min (Figure S3), the optical density at 463 nm of the nanocrystals from the ten batches shown in Figure 4 but sampled at different growth temperature and periods (Figure S4), the temporal evolution of the UV-vis absorption spectra of the growing CdSe nanocrystals from the synthetic batch shown in Figure 5 but sampled from 60 min/160 °C (sample 5) to 90 min/220 °C (sample 12) and overnight/220
°C (sample 13) (Figure S5), another example of the “isomer competing” in the initial stage of the formation of Family 463 (Figure S6), the problems of the traditional characterization with TEM and XRD for MSQD CdSe Family 463 (Figure S7), and
8-month storage stability (Figure S8). This material is available free of charge via the Internet at http://pubs.acs.org.
References and Notes
(1) (a) Bruchez, M., Jr.; Moronne, M.; Gin, P.; Weiss, S.; Alivisatos, A. P. Science 1998, 281, 2013. (b) Chan, W. C. W.; Nie, S. Science 1998, 281, 2016. (c) Michalet, X.; Pinaud, F. F.; Bentolila, L. A. J.; Tsay, M.; Doose, S.; Li, J. J.; Sundaresan, G.; Wu, A. M.; Gambhir, S. S.; Weiss, S. Science 2005, 307, 538–544. (d) Medintz, I. L.; Uyeda, H. T.; Goldman, E. R.; Mattoussi, H. Nat. Mater. 2005, 4, 435. (e) Lin, S.; Xie, X.; Patel, M. R.; Yang, Y.-H.; Li, Z.; Cao, F.; Gheysens, O.; Zhang, Y.; Gambhir, S. S.; Rao, J. H.; Wu, J. C. BMC Biotechnol. 2007, 7, 67. (f) Liu, W.; Howarth, M.; Greytak, A. B.; Zheng, Y.; Nocera, D. G.; Ting, A. Y.; Bawendi, M. G. J. Am. Chem. Soc. 2008, 130, 1274.
(2) (a) Coe-Sullivan, S.; Woo, W.-K.; Steckel, J. S.; Bawendi, M.; Bulovic, V. Org. Electron. 2003, 4, 123–130. (b) Achermann, M.; Achermann, M.; Petruska, M. A.; Kos, S.; Smith, D. L.; Koleske, D. D.; Klimov, V. I. Nature 2004, 429, 642–646. (c) Chan, Y.; Steckel, J. S.; Snee, P. T.; Caruge, J.-M.; Hodgkiss, J. M.; Nocera, D. G.; Bawendi, M. G. Appl. Phys. Lett. 2005, 86, 073102. (d) Zhao, J.; Bardecker, J. A.; Munro, A. M.; Liu, M. S.; Niu, Y.; Ding, I-K.; Luo, J.; Chen, B.; Jen, A. K.-Y.; Ginger, D. S. Nano Lett. 2006, 6, 463–467. (e) Rizzo, A.; Li, Y.; Kudera, S.; Della, S. F.; Zanella, M.; Parak, W. J.; Cingolani, R.; Manna, L.; Giglic, G. Appl. Phys. Lett. 2007, 90, 051106. (f) Bardelang, D.; Zaman, M. B.; Moudrakovski, I.; Pawsey, S.; Margeson, J. C.; Wang, D.; Ripmeester, J. A.; Ratcliffe, C. I.; Yu, K. AdV. Mater. 2008, 20, 4517. (g) Zaman, Md., B.; Baral, T.; Zhang, J.; Whitfield, D.; Yu, K. J. Phys. Chem. C 2009, 113, 496-499.
(3) Hernandez-Calderon, I. II-VI Semiconductor Materials and Their Applications. In Optoelectronic Properties of Semiconductors and Super-lattices, Tamargo, M. C. Manasreh, M. O., Eds.; Taylor & Francis Inc.: New York, 2002; p 136-138, Vol. 12.
(4) Murray, C. B.; Norris, D. J.; Bawendi, M. G. J. Am. Chem. Soc. 1993, 115, 8706–8715.
(5) (a) Talapin, D. V.; Rogach, A. L.; Shevchenko, E. V.; Kornowski, A.; Haase, M.; Weller, H. J. Am. Chem. Soc. 2002, 124, 5782. (b) Li, J. J.; Wang, A.; Guo, W.; Keay, J. C.; Mishima, T. D.; Johnson, M. B.; Peng, X. J. Am. Chem. Soc. 2003, 125, 12567. (c) Yu, W.; Qu, L.; Guo, W.; Peng, X. Chem. Mater. 2003, 15, 2854–2860.
(6) (a) Yu, K.; Singh, S.; Patrito, N.; Chu, V. Langmuir 2004, 20, 11161. (b) Yu, K.; Zaman, M. B.; Singh, S.; Wang, W.; Ripmeester, J. A. J. Nanosci. Nanotechnol. 2005, 4, 659. (c) Yu, K.; Zaman, M. B.; Ripmeester, J. A. J. Nanosci. Nanotechnol. 2005, 4, 669.
(7) (a) Herron, N.; Calabrese, J. C.; Farneth, W. E.; Wang, Y. Science 1993, 259, 1426–1428. (b) Vossmeyer, V.; Reck, G.; Katsikas, L.; Haupt, E. T. K.; Schulz, B.; Weller, H. Science 1995, 267, 1476–1479. (c) Zheng, N.; Bu, X.; Lu, H.; Zhang, Q.; Feng, P. J. Am. Chem. Soc. 2005, 127, 11963.
(8) (a) Soloviev, V. N.; Eichhofer, A.; Fenske, D.; Banin, U. J. Am. Chem. Soc. 2000, 122, 2673. (b) Soloviev, V. N.; Eichho¨fer, A.; Fenske, D.; Banin, U. J. Am. Chem. Soc. 2001, 123, 2354.
(9) (a) Weiss, S. Nat. Struct. Biol. 2000, 7, 724–729. (b) Rosenthal, S. J. Nat. Biotechnol. 2001, 19, 621–622.
(10) Kasuya, A. S. R.; Barnakov, Y. A.; Dmitruk, I. M.; Nirasawa, T.; Romanyuk, V. A.; Kumar, V.; Mamykin, S. V.; Tohji, K.; Jeyadevan, B.; Shinoda, K.; Kudo, T.; Terasaki, O.; Liu, Z.; Belosludov, R. V.; Sundarara-jan, V.; Kawazoe, Y. Nat. Mater. 2004, 3, 99–102.
(11) (a) Landes, C.; Braun, M.; Burda, C.; El-Sayed, M. A. Nano Lett. 2001, 1, 667–670. (b) Deglmann, P.; Ahlrichs, R.; Tsereteli, K. J. Chem. Phys. 2002, 116, 1585. (c) Bowers, M. J.; McBride, J. R.; Rosenthal, S. J. J. Am. Chem. Soc. 2005, 127, 15378–15379.
(12) Sanville, E.; Burnin, A.; Belbruno, J. J. J. Phys. Chem. A 2006, 110, 2378.
(13) Kudera, S.; Zanella, M.; Giannini, C.; Rizzo, A.; Li, Y.; Gigli, G.; Cingolani, R.; Ciccarella, G.; Spahl, W.; Parak, W. J.; Manna, L. AdV. Mater. 2007, 19, 548.
(14) Ouyang, J.; Zaman, B.; Yan, F.; Johnston, D.; Li, G.; Wu, X.; Leek, D.; Ratcliffe, C. I.; Ripmeester, J. A.; Yu, K. J. Phys. Chem. C 2008, 112, 13805–13811.
(15) (a) Empedocles, S. A.; Neuhauser, R.; Shimizu, K.; Bawendi, M. G. AdV. Mater. 1999, 11, 1243–1256. (b) Schlegel, G. G.; Bohnenberger, J.; Potapova, I.; Mews, A. Phys. ReV. Lett. 2002, 88, 137401.
(16) Yang, Y. A.; Wu, H.; Williams, K. R.; Cao, Y. C. Angew. Chem., Int. Ed. 2005, 44, 6712–6715.
(17) Ratcliffe, C. I.; Yu, K.; Ripmeester, J. A.; Zaman, M. B.; Badarau, C.; Singh, S. Phys. Chem. Chem. Phys. 2006, 8, 3510–3519.
(18) (a) Ouyang, J.; Ratcliffe, C. I.; Kingston, D.; Wilkinson, B.; Kuijper, J.; Wu, X.; Ripmeester, J. A.; Yu, K. J. Phys. Chem. C 2008, 112, 4908– 4919. (b) Wang, R.; Ouyang, J.; Nikolaus, S.; Brestaz, L.; Zaman, Md. B.; Wu, X.; Leek, M. D.; Ratcliffe, C. I.; Yu, K. Chem. Comm. 2009, DOI: 10.1039/<B818967F>. (c) Wang, R.; Calvignanello, O.; Ratcliffe, C. I.; Figure 11. Absorption (curve 1) and photoemission (curve 3, excited at
350 nm) spectra of the as-synthesized CdSe MSQDs, Family 463 from a synthetic batch with the 1MA-to-2Cd and 4Cd-to-1Se feed molar ratios and 18-min growth at 240°C. The dispersion in toluene was stored 40 days in the dark at ca. 10°C; afterward, optical measurements were carried out at room temperature, namely absorption (curve 2) and emission (curve 4 with excitation at 350 nm). Figure S8 shows the storage stability also, but with purified CdSe MSQD Family 463 after eight months.
Wu, X.; Leek, D. M.; Zaman, Md. B.; Kingston, D.; Ripmeester, J. A.; Yu, K. J. Phys. Chem. C, DOI: 10.1021/jp810325z.
(19) Our forthcoming report on “High Quality Colloidal Photolumines-cent CdS Nanocrystals via Non-Injection One-Pot Synthesis in 1-Octadecene (II): Effects of Ligand Length and Concentration” by Ouyang, J., Yu, K. et al; J. Phys. Chem. C. Submitted. The results show the CdS QDs capped with C12-C18 feature high QYs and moderate growth rates as well as narrow size distributions, and relatively higher crystallite concentrations, thus C12-18 is the optimal choices for CdS QDs in our synthetic conditions.
(20) Battaglia, D.; Peng, X. Nano Lett. 2002, 2, 1027–1030. (21) Jose, R.; Zhanpeisov, N. U.; Fukumura, H.; Baba, Y.; Ishikawa, M. J. Am. Chem. Soc. 2006, 128, 629–636.
(22) Pradhan, N.; Xu, H.; Peng, X. Nano. Lett. 2006, 6, 720–724. (23) Tang, Z.; Kotov, N. A.; Giersig, M. Science 2002, 297, 237–240. (24) (a) Hens, Z.; Moreels, I.; Martins, J. C. Chem. Phys. Chem. 2005, 6, 2578–2584. (b) Moreels, I.; Martins, J.; Hens, Z. Sens. Actuators B 2007, 126, 283–288.
(25) (a) Viel, S.; Capitani, D.; Mannina, L.; Segre, A. Biomacromolecules 2003, 4, 1843–1847. (b) Sˇmejkalova´, D.; Piccolo, A. EnViron. Sci. Technol. 2008, 42, 699–706. (c) Tiziani, S.; Schwartz, S. J.; Vodovotz, Y. Food Chem. 2008, 107, 962–969.
(26) Nien, Y.-T.; Zaman, B.; Ouyang, J.; Chen, I.-G.; Hwang, C.-S.; Yu, K. Mater. Lett. 2008, 62, 4522–4524.
(27) Opella, S. J.; Frey, M. H. J. Am. Chem. Soc. 1979, 101, 5854. (28) (a) Becerra, L. R.; Murray, C. B.; Griffin, R. G.; Bawendi, M. G. J. Chem. Phys. 1994, 100, 3297. (b) Katari, J. E. B.; Colvin, V. L.; Alivisatos, A. P. J. Phys. Chem. 1994, 98, 4109. (c) Alivisatos, A. P. J. Phys. Chem. 1996, 100, 13226. (d) Cordero, S. R.; Carson, P. J.; Estabrook, R. A.; Strouse, G. F.; Buratto, S. K. J. Phys. Chem. B 2000, 104, 12137. (e) Myung, N.; Bae, Y.; Bard, A. J. Nano Lett. 2003, 3, 747. (f) Derfus, A. M.; Chan, W. C. W.; Bhatia, S. N. Nano Lett. 2004, 4, 11.
(29) Yu, K.; Zaman, B.; Singh, S.; Wang, D.; Ripmeester, J. A. Chem. Mater. 2005, 17, 2552.
JP809990A