ORIGINAL PAPER
Assessment of body mapping sportswear using a manikin
operated in constant temperature mode and thermoregulatory
model control mode
Faming Wang&Simona Del Ferraro&
Vincenzo Molinaro&Matthew Morrissey&René Rossi
Received: 25 September 2013 / Revised: 26 November 2013 / Accepted: 1 December 2013 / Published online: 20 December 2013 # ISB 2013
Abstract Regional sweating patterns and body surface tem-perature differences exist between genders. Traditional sports-wear made from one material and/or one fabric structure has a limited ability to provide athletes sufficient local wear comfort. Body mapping sportswear consists of one piece of multiple knit structure fabric or of different fabric pieces that may provide athletes better wear comfort. In this study, the ‘modu-lar’ body mapping sportswear was designed and subsequently assessed on a‘Newton’ type sweating manikin that operated in both constant temperature mode and thermophysiological model control mode. The performance of the modular body mapping sportswear kit and commercial products were also compared. The results demonstrated that such a modular body mapping sportswear kit can meet multiple wear/thermal com-fort requirements in various environmental conditions. All body mapping clothing (BMC) presented limited global thermophysiological benefits for the wearers. Nevertheless, BMC showed evident improvements in adjusting local body heat exchanges and local thermal sensations.
Keywords Body mapping . Sweating patterns . Local thermal comfort . Thermoregulation . Sportswear
Introduction
In recent years, knowledge of sweat distribution over the entire human body has increased substantially. It is well recognized that regional sweating differences exist between genders. Havenith et al. (2008) found that both genders showed similar sweat distribution patterns over the upper body with some exceptions: females, compared with males, showed higher sweat rates on the upper arm, lateral lower back, and upper central back; sweating in both genders was the highest along the spine and higher on the back as a whole than the chest as a whole; the sweat rate on the upper arm was the lowest of all torso sites. Machado-Moreira (2011) studied sweat secretion from the human torso during passively in-duced and exercise-related hyperthermia in hot environments. Mean regional sweat rates over the whole exercise duration from high to low were lower back, upper back, shoulders, chest, abdomen and lateral torso. The sweat rate at the lateral torso was about 50 % of that on the lower back, 53 % of that on the upper back, 61 % of shoulder sweating, 64 % of that on the chest and 74 % of that on the abdomen. More recently, Smith and Havenith (2011, 2012) carried out a series of studies on body mapping of sweating patterns in both male and female Caucasian athletes. Whole body maps of regional sweating rates of both male and female athletes were devel-oped. The aforementioned systematic studies provide detailed knowledge on human sweat distributions over the Caucasian population; Park and Yoo (2012) investigated the upper body sweat rate of ten male Koreans. Consistent with Smith and Havenith (2011,2012), they found that local sweat rate in the anterior upper body was lower than the posterior upper body. The central upper body locations have a higher sweat rate than lateral upper body sites.
Since sweat production and evaporative cooling varies across the body, the skin temperature will also vary regionally in warm and hot conditions (Fournet et al.2012; Ouzzahra et al. F. Wang
:
M. Morrissey:
R. RossiLaboratory for Protection and Physiology, EMPA-Swiss Federal Laboratories for Materials Science and Technology, St. Gallen, Switzerland
F. Wang (*)
Department of Human Ecology, University of Alberta, 329 Human Ecology Building, Edmonton, AB T6G 2N1, Canada
e-mail: faming.wong@gmail.com S. Del Ferraro
:
V. MolinaroDepartment of Occupational Medicine, INAIL-Research Area, Via Fontana Candida 1, 00040 Monte Porzio Catone, RM, Italy
2012; Fournet et al.2013). This has been confirmed by many studies using the infrared thermography technology (Clark et al. 1977; Hunold et al. 1992; Choi et al.
1997). In such cases, traditional clothing made from the same material and the same weave/knit structure has a limited ability to provide sufficient comfort for local body parts. In order to improve local wear comfort and thermal comfort, special textiles with different properties may be used for different clothing parts (Kitteringham
2006). In particular, as textile and clothing technology advances and due to a growing interest in the tempera-ture and sweat distribution of the human body, the de-velopment of body mapping clothing (BMC) is possible. The constructions of such BMC are more complicated than traditional clothing. BMC may be developed in three ways (Kitteringham 2006, Kinnicutt et al. 2010, Wang et al.2012):
(a) Using and placing different fabric materials on different clothing parts;
(b) Changing fabric weave/knit structures within one piece of target fabric (i.e. multiple weave/knit structure fabric); and
(c) A combination of approaches (a) and (b).
Furthermore, the skin temperature and sweat production are dependent on the clothing properties (Havenith et al.
2002). How to couple such human physiological characteris-tics as regional body sweat production rates, regional evaporation patterns and skin temperature distributions with complicated clothing patterns is a great challenge to textile and clothing engineers. Although several com-mercial products exist (Adidas 2012; Craft Sweden
2012), the performance implications of wearing BMC are still unclear. Besides, the scientific knowledge on BMC engineering has lagged far behind commercial practices (Kicklighter et al. 2011).
In this study, a novel ‘modular’ body mapping sportswear kit was designed and assessed on a sweating manikin. Comparisons with commercial BMC, tradition-al sportswear and the novel BMC kit were made. Loctradition-al heat exchanges and clothing microclimate conditions in the constant temperature mode were also investigated. Recent developments on thermoregulatory model con-trolled sweating manikins have shown that they have the potential to replace human subjects to simulate both human physiological and psychological responses over a range of test scenarios (McGuffin et al. 2002; Psikuta et al. 2008; Foda and Sirén 2012). Thus, to examine the benefits of wearing BMC, the thermoregulatory model controlled manikin was also used to predict physiolog-ical responses and subjective perceptions during a sim-ulated 1 h exercise-rest cycle.
Methods
Body mapping T-shirt
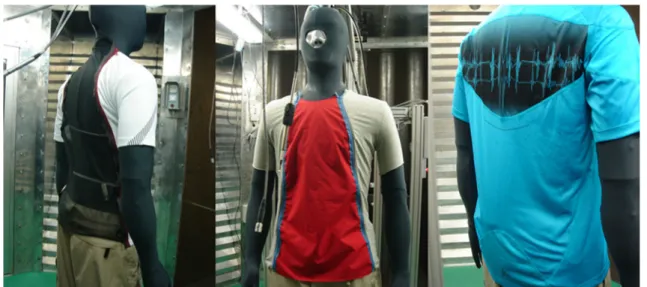
In this study, a novel modular BMC design (Wang and Rossi
2013) was developed to evaluate body mapping sportswear (Fig. 1). The modular BMC features four zippers, two of which are placed at the front and the remaining two on the back. Based on human sweating patterns and the intended condition of use, the front and back fabric pieces can be exchanged. In the kit, five common textile materials were selected: cotton fabric with a hydrophobic surface treatment (code: C), net fabric with high air permeability (code: N), thin impermeable polyester fabric coated with PU (polyurethane, code: P), thick merino wool fabric (code: W) and‘moisture management’ polyester fabric (code: M). The traditional cot-ton (C) and moisture management garments (M), six body mapping sportswear combinations (i.e. CN, CW, CP, MN, MW and MP) and two commercial BMC products (i.e. BMC1and BMC2) were assessed on a‘Newton’ type sweat-ing manikin. The side panels of sportswear CN, CW and CP are hydrophobic cotton fabrics. For sportswear MN, MW and MP, the side panels are moisture management polyester fab-rics. To present how much clothing resistance has been added to each upper torso segment, the nude tests (i.e. NUDE) were also performed. The characteristics of all clothing fabric ma-terials are presented in Table1.
Thermal manikin
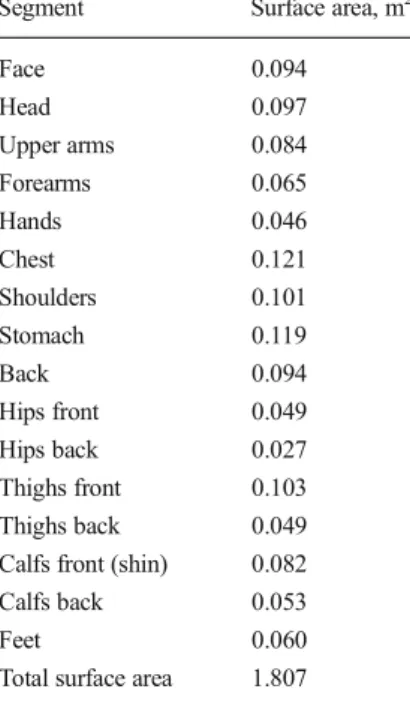
A 26-segment Newton type sweating manikin (MTNW, Seattle, WA) was used in this study. The segmental surface area of the manikin is displayed in Table2. The manikin can measure and record segmental heat loss and segmental surface temperature (Wang et al.2012). It has four operation modes: constant temperature mode, constant power mode, comfort mode and thermoregulatory model control mode (Burke et al.
2009). In this study, the constant temperature mode and the thermoregulatory model control mode were used. For the constant temperature mode, the manikin surface temperature Tmanikinwas set to 34 °C. Before running the thermoregulatory
model control mode, the manikin was preheated to a defined thermal natural condition. The manikin surface temperature and sweating rate are controlled in analogy to the prediction of the Fiala human thermoregulatory model (Psikuta 2009, Psikuta et al. 2013). The human thermoregulatory model software was commercially available from the MTNW com-pany (Seattle, WA). This model is based on a finite difference thermal analysis program called RadTherm (ThermoAnalytics Inc., Calumet, MI). RadTherm resolves both steady state and transient heat transfer solutions. All physiological responses are based on the Fiala model (Fiala et al.1999; Burke et al.
the air temperature and relative humidity and then subtracted from the whole body energy balance. The resultant heat flux measured on the manikin is used as the feedback for the thermoregulatory model to generate physiological prediction outputs for the next time interval. The manikin's segmental surface temperature under the defined thermal neutral condi-tion is presented in Table3. In this mode, the prediction of subjective perception (i.e. thermal sensation and comfort sen-sation) is calculated from the predicted core temperature and measured skin temperatures based on the Berkeley thermal comfort model (Zhang et al.2001).
Test conditions
Constant temperature mode measurements were performed in two ambient conditions in a climatic chamber: a hot condition
(Ta=Tr=34±0.5 °C, RH=38±5 %, va=0.5±0.1 m/s) and a
warm condition (Ta= 30 ± 0.5 °C, RH= 47 ± 5 %; va= 0.5 ±
0.1 m/s). Segmental sweating rate was set to a value to ensure the‘skin’ fully wet. The manikin segmental heat loss and the microclimatic relative humidity (MSR® 145B4 type datalogger, Seuzach, Switzerland) of all 11 clothing scenarios (including the nude scenario NUDE) are presented. The thermophysiological measurements were performed in a warm condition, where the ambient temperature was 30± 0.5 °C, relative humidity 47±5 % and air velocity vawas 0.5
±0.1 m/s. For all testing conditions, the partial water vapour pressure in the climatic chamber was controlled at 2.0 kPa. The air inside the climatic chamber flows through a mesh wall that faces the front side of the manikin and exits through the back wall. The air flow inside the chamber is treated to be pseudolaminar accordingly. Under the thermoregulatory Fig. 1 The modular body mapping T-shirt (left and middle) and the commercial product (right)
Table 1 Characteristics of clothing fabric materials
Code Material Rcl °C m2W−1 Recl Pa m2W−1 OMMC AP l m−2s−1 d mm BMC1 100 % polyester 0.011 1.59 0.37 869.9 0.516 BMC2 100 % polyester 0.009 1.72 0.38 1063.0 0.508 M 100 % polyester 0.010 1.81 0.30 1204.2 0.628
C 100 % cotton, hydrophobic treatment 0.019 2.87 0.00 467.6 0.615
W 100 % merino wool 0.043 4.81 0.68 1307.4 1.205
N 100 % polyester net fabric 0.006 0.81 –a ∞ 0.254
P 87 % polyester, 13 % PU 0.004 14.76 –a 0 0.222
Clothing fabric intrinsic thermal resistance Rcland intrinsic water-vapour resistance Reclwere measured on a sweating guarded hotplate according to ISO
11092 (1993)
AP air permeability was measured on an air permeability tester according to ISO 9237(1995) with the area of the circular specimen holder of 50 cm2and a pressure drop of 100 Pa, OMMC the overall moisture management capability which was determined on a moisture management tester (MMT) according to AATCC 195 (2012), d fabric thickness was measured on a thickness tester according to ISO 5084 (1996) with the pressure of 10.2 g cm−2 and the diameter of the pressure foot of 50.8 mm, P is impermeable and the structure of N is too open
a
model control mode, a 40-min exercise (4.3 METs) and a 20-min rest (1.2 METs) were simulated. The prediction of mean skin temperature Tsk, core body temperature (i.e. hypothalam-ic temperature Thy), whole body thermal sensation and local thermal sensations at the chest and back in sportswear BMC1, C, M and MN over time are reported.
Statistical analyses
Data are presented as mean ± SD. Dependent variables such as the local heat loss, microclimatic relative humidity, core body temperature, mean skin temperature and thermal sensations
were analyzed by a two-way ANOVA and followed with Turkey's honestly significant difference post hoc tests. The independent factors are the test condition and sportswear sample. Statistical analyses were performed using SPSS Statistics version 19.0 (IBM, Armonk, NY, USA). The level of significance was set to p<0.05.
Results and discussion Segmental heat loss
This study is the first documented systematic research to investigate the design principle and evaluation methods of the next generation functional sportswear—body mapping sportswear. Segmental heat losses at the upper arms, chest, shoulders, stomach and back under two different environmen-tal conditions are displayed in Fig.2.
It is evident that all sportswear, as a thermal and moisture barrier, reduces the dissipation of body heat to the surrounding environment. For all four segments represented in Fig.2 in both hot and warm conditions, local heat losses in NUDE were significantly higher than other 10 clothing scenarios (p<0.01). It was also found that commercial products BMC1 and BMC2 did not allow the dissipation of more heat com-pared to the non-body mapping sportswear made from pure cotton and moisture management polyester fibres (p>0.05). If net fabrics were used, segmental heat losses at the back in clothing CN and MN showed significant higher values than the commercial products BMC1 and BMC2 (p1<0.05; p2<0.05);
similarly, the heat losses at the chest in clothing CN and MN also showed significant higher values than the commercial product BMC1(p1<0.05), but not the BMC2. In contrast, when
impermeable coated fabrics or thick wool fabrics were used in sportswear CP, MP, CW and MW, local heat losses at the chest and back showed the lowest values of all 11 clothing scenarios. Thus, local heat exchanges can be adjusted by matching fabrics with different thermal and moisture transfer properties with certain body parts. Properly designed BMC can improve local thermal conditions of the human body. For example, the im-permeable fabrics or wool fabrics may be used when the wearers move from a hot environmental condition to a cooler and/or windy environment in order to avoid excessive body cooling at rest.
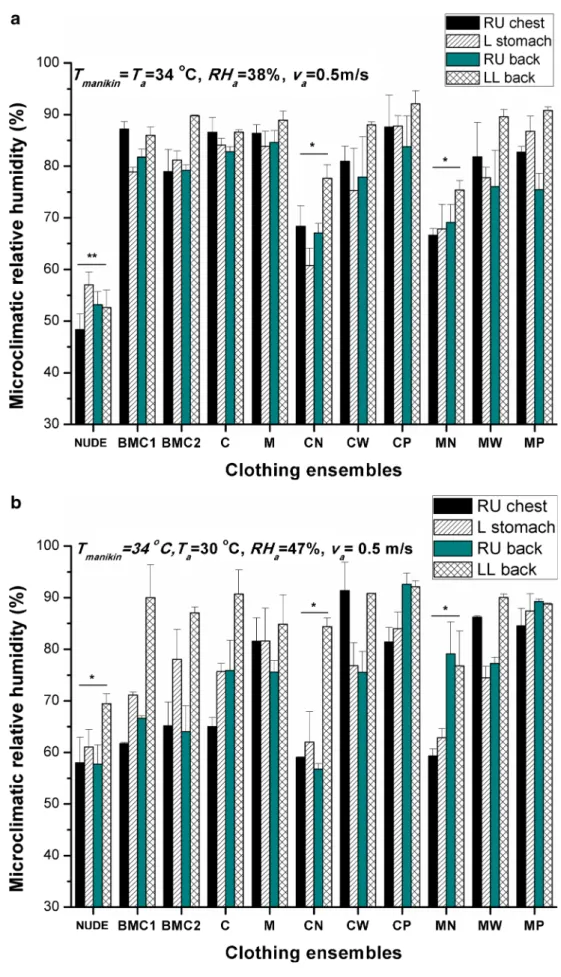
With regard to the microclimate relative humidity (Fig.3), it was found that, compared with the scenario NUDE, all sportswear significantly caused, as expected, an increase in local microclimatic relative humidity at all measured body sites (p1<0.05, p2<0.05). It should be noted that the ambient
relative humidity in NUDE could cause the measured RH values slightly lower because RH sensors are nakedly exposed to the environment. For some clothing scenarios, the observed relative humidity showed big variations, which is mainly due Table 2 Segmental
sur-face area of the 26-seg-ment Newton manikin (manikin height: 1.75 m)
Segment Surface area, m2
Face 0.094 Head 0.097 Upper arms 0.084 Forearms 0.065 Hands 0.046 Chest 0.121 Shoulders 0.101 Stomach 0.119 Back 0.094 Hips front 0.049 Hips back 0.027 Thighs front 0.103 Thighs back 0.049
Calfs front (shin) 0.082
Calfs back 0.053
Feet 0.060
Total surface area 1.807
Table 3 Segmental surface temperatures of the manikin under the ther-mal neutral condition
Segment name Temperature, °C Segment name Temperature, °C
Face 35.5 Right hip back 34.8
Head 35.3 Left hip front 33.9
Right upper arm 33.3 Left hip back 34.7 Left upper arm 33.3 Right thigh front 33.9 Right forearm 33.5 Right thigh back 33.9 Left forearm 33.3 Left thigh front 33.8 Right hand 34.7 Left thigh back 34.1
Left hand 34.6 Right shin 33.8
Chest 34.8 Right calf 33.7
Shoulders 34.9 Left shin 34.1
Stomach 34.5 Left calf 33.5
Back 34.7 Right foot 30.9
to the difficulties in measuring relative humidity (e.g. sensor inaccuracy). Nevertheless, we observed that there was no significant difference in the microclimate relative humidity
between the commercial body mapping sportswear BMC1 and BMC2 and non-body mapping sportswear such as C and M (p> 0.05). It is also evident that the use of net Fig. 2 Local heat losses of 11
clothing scenarios at two different ambient conditions. U Arms upper arms; **p<0.01, *p<0.05
Fig. 3 Local microclimatic relative humidity at the right upper chest (RU chest), left stomach (L stomach), right upper back (RU back) and left lower back (LL back) of 11 clothing scenarios at two different ambient conditions. **p<0.01, *p<0.05
fabric (i.e. the modular body mapping sportswear CN and MN) could significantly reduce the microclimate relative humidity at all four measured body sites (p> 0.05). Hence, appropriate selection of fabrics with
good permeability and low insulation can contribute to reducing the microclimatic relative humidity underneath the sportswear and thereby can improve the wearer's rated humidity sensation.
Fig. 4 Development of the hypothalamic (Thy) and mean skin temperatures (Tsk) over time in BMC1 (commercial product), C (traditional sportswear), M (traditional sportswear) and MN (BMC)
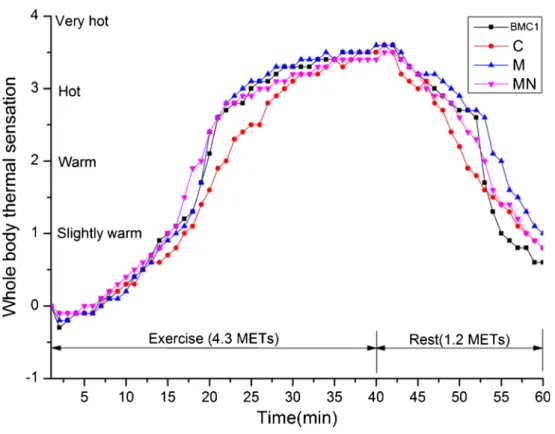
Fig. 5 Development of the whole body thermal sensation over time in BMC1 (commercial product), C (traditional sportswear), M (traditional sportswear) and MN (BMC)
Physiological response and whole body thermal sensation Based on the performance presented in the aforepresented measurements, we selected four of these sportswear T-shirts (i.e. BMC1, C, M and MN) to further examine their perfor-mance using the thermoregulatory model controlled manikin.
The predicted development of the body core temperature (i.e. hypothalamic temperature) and the mean skin temperature over time is presented in Fig. 4. The core temperature rose to 38.3 °C after 40 min exercise and then dropped to 37.7 °C after the 20-min resting period. For all the studied sportswear, BMC1, C, M and MN, there was no significant difference in Fig. 6 Development of the local
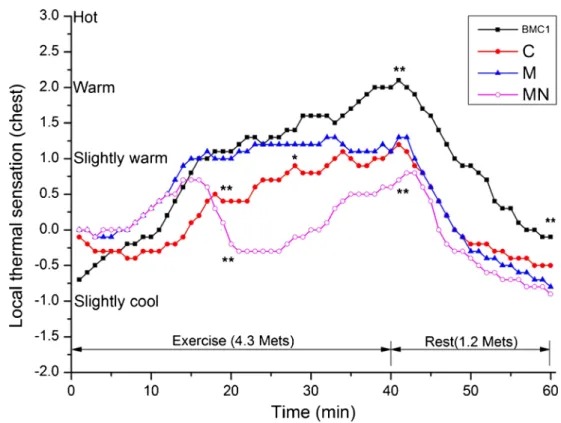
thermal sensation over time at the chest of the manikin. **p<0.01, *p<0.05
Fig. 7 Development of the local thermal sensation over time at the back of the manikin. *p<0.05
both core temperature and mean skin temperature throughout the simulated 1 h activities. Thus, it may be argued that such body mapping clothing has a limited global thermophysiological ben-efit for the wearers in the simulated conditions.
The predicted development of the whole body thermal sensation over time for sportswear BMC1, C, M and MN is presented in Fig.5. The predicted whole body thermal sensa-tion increased continuously throughout the 40 min exercise. The post-exercise thermal sensation in all four sportswear was close to 4.0, a rating denoting a thermal sensation of‘very hot’. After 20 min rest, the whole body thermal sensation was dropped to a range of 0.5 (between neutral and slightly warm) and 1.0 (slightly warm). These ratings are in line with the observed mean skin temperatures showed in Fig.4. In this study, all body mapping sportswear cover only about 40 % of the whole body surface area. The whole body thermal sensa-tion in these four clothing scenarios had no significant differ-ence throughout the 1-h simulation. To further distinguish the performance of all four sportswear in terms of thermal sensa-tion ratings, it is meaningful to investigate local thermal sensations at the torso area such as the chest and the back. Local thermal sensation
Local thermal sensations at the chest and back of the manikin are described in Figs.6and7, respectively. Compared with the whole body thermal sensation presented in Fig.5, the post-exercise local thermal sensations at the chest and back were rated as‘warm’, which is better than the rated post-exercise whole body thermal sensation. In particular, the local thermal sensation at the chest at the end of the resting period was rated as‘slightly cool’ because of the wind. Thus, such sportswear does contribute to improving local thermal sensations. The thermal sensation ratings in BMC1, C and M increase contin-uously throughout the 40-min moderate exercise while de-creasing during the last 20 min resting period. For the MN, the predicted local thermal sensation showed a 5-min reduction after a 15-min exercise, which is mainly due to the initial sweating and the open fabric structure: it allowed a much greater evaporation compared with other three clothing sce-narios. Prior to resting, the thermal sensation rating in BMC1, C, M and MN was 2.0, 1.0, 1.2 and 0.6, respectively. During the 20-min resting period, all clothing scenarios showed a similar reduction, and the post-rest thermal sensation rating in BMC1, C, M and MN was −0.1, −0.5, −0.8 and −0.9 (slightly cool), respectively. It can be deduced that the body mapping sportswear MN showed much lower ratings than the commercial product BMC1 both at the chest and at the back during the 40-min exercise. The reason for this is because of the use of the highly permeable net fabric. The net fabric allows better heat and moisture exchanges between the body and the ambient environment. Nevertheless, body mapping sportswear MN showed a rating of−0.9 at the end of the
resting period, which indicated that the wearers may feel slightly cool due to the after-exercise chill effect (Spencer-Smith1978, Farnworth1986). Therefore, it is suggested that the front fabric piece should be replaced with C or BMC1 to reduce local thermal discomfort during the rest period.
For local thermal sensation ratings at the back, the incre-ment was slower throughout the 40-min exercise, and the reduction during the rest period was also slower compared with the chest. This is mainly because of the wind (i.e. the wind flows towards the anterior body of the manikin). Since the wind had a limited influence on the back, the thermal sensation ratings at the end of the simulation in the four clothing scenarios were close. Finally, it is evident that some of the modular body mapping sportswear improved the wear comfort perception, and thus, the predicted model rated better subjective local thermal/comfort sensations.
Further, the commercial products used in this study did not show superior performance than non-BMC. The reasons are complex, for instance, the commercial products may only be used in certain environmental conditions and were therefore not adapted for the scenarios chosen in this study. Another reason might be that these commercial products are not spe-cially designed for the manikin while the modular body map-ping sportswear is specially designed to fit well to the manikin body shape. Further, it is difficult to find well-fitted (means no air gap or minimal air gap) sportswear for a specific consumer from sportswear stores. Thus, air gaps exist widely underneath the body mapping sportswear. It is thus meaningful to inves-tigate the effect of air gap on the overall performance of body mapping sportswear. It seems that these commercial products have limited applications. The modular body mapping sports-wear kit developed in this study showed better application potentials than the commercial products in all test conditions. Therefore, the modular body mapping sportswear kit is rec-ommended to use instead of changing clothing in different environmental conditions. The whole kit is lighter, easy change, less expensive and less spacious compared with tra-ditional ensembles. Future human trial studies are required to explore the performance of this modular body mapping cloth-ing kit however.
Conclusions
In this study, we found that commercial products BMC1 and BMC2 due to some reasons did not show better performance in terms of regional heat loss and microclimatic condition than selected non-body mapping clothing such as C and M. Nevertheless, we observed that local thermal body status can be adjusted by wearing appropriate body mapping sportswear. For instance, the body mapping sportswear MN showed much lower thermal sensation ratings than BMC1 and M. On the other hand, although such BMC may have a limited global
thermophysiological benefit for the wearers, they show evi-dent improvements in adjusting local body heat exchanges, and thus, the local thermal/comfort sensations can be im-proved by using such body mapping sportswear. Finally, the modular body mapping sportswear kit developed in this study has the potential to meet multiple wear/thermal comfort re-quirements in various environmental conditions.
Acknowledgments This study was financially supported by a Europe-an Union Marie Curie project (project number: 209369) Europe-and FW was supported by the Killam Trusts at the University of Alberta.
Conflict of interest The authors declare that they have no conflict of interest.
References
AATCC (2012) AATCC 195 Liquid moisture management properties of textile fabrics. American Association of Textile Chemists and Colorists. Research Triangle Park, NC
Adidas AG (2012) Available from:http://www.adidas.com. Accessed 1 Mar 2013
Burke R, Curran A, Hepokoski M (2009) Integrating an active physio-logical and comfort model to the Newton sweating thermal manikin. Proceedings of the 13th International Conference on Environmental Ergonomics (ICEE). University of Wollongong, Wollongong, pp 313–317
Choi JK, Miki K, Sagawa S, Shiraki K (1997) Evaluation of mean skin temperature formulas by infrared thermography. Int J Biometeorol 41:68–75
Clark RP, Mullan BJ, Pugh LG (1977) Skin temperature during running-a study using infrrunning-a-red colour thermogrrunning-aphy. J Physiol 591:53–62 Craft Sweden AB (2012) Available from: http://www.craft.se/en.
Accessed 1 Mar 2013
Farnworth B (1986) A numerical model of the combined diffusion of heat and water vapor through clothing. Text Res J 56:653–665 Fiala D, Lomas KJ, Stohrer M (1999) A computer model of human
thermoregulation for a wide range of environmental conditions: the passive system. J Appl Physiol 87:1957–1972
Foda E, Sirén K (2012) A thermal manikin with human thermoregulatory control implementation and validation. Int J Biometeorol 56:959–971 Fournet D, Redortier B, Havenith G (2012) A method for whole-body
skin temperature mapping in humans. Thermol Int 22:157–159 Fournet D, Ross L, Voelcker T, Redortier B, Havenith G (2013) Body
mapping of thermoregulatory and perceptual responses of males and females running in the cold. J Therm Biol 38:339–344
Havenith G, Fogarty A, Bartlett R, Smith CJ, Ventenat V (2008) Male and female upper body sweat distribution during running measured with technical absorbents. Eur J Appl Physiol 104:245–255
Havenith G, Holmér I, Parsons K (2002) Personal factors in thermal comfort assessment: clothing properties and metabolic heat produc-tion. Energy Buildings 34:581–591
Hunold S, Mietzsch E, Werner J (1992) Thermographic studies on patterns of skin temperature after exercise. Eur J Appl Physiol Occup Physiol 65:550–554
ISO (1993) ISO 11092 textiles-physiological effects-measurement of thermal and water-vapour resistance under stead-state conditions (sweating guarded-hotplate test). International Organization for Standardization, Geneva
ISO (1996) ISO 5084 textiles-determination of thickness of textiles and textile products. International Organization for Standardization, Geneva
ISO (1995) ISO 9237 textiles-determination of the permeability of fabrics to air. International Organization for Standardization, Geneva Kicklighter TH, Edsall JR, Martin M (2011) Effect of moisture-wicking
garments on temperature regulation during exercise. Int J Athl Ther Trai 16:9–13
Kinnicutt P, Domina T, MacGillivray M, Lerch T (2010) Knit-in 3D mapping's effect on thermoregulatory: preliminary results. J Text I 101:120–127
Kitteringham G (2006) Outdoor clothing now matches insulation to specific zones. Tech Text Int 15:21–22
Machado-Moreira CA (2011) The regional distribution of human sudomotor function and its neuropharmacological control. University of Wollongong, Wollongong
McGuffin R, Burke R, Huizenga C, Zhang H, Vlahinos A, Fu G (2002) Human thermal comfort model and manikin. The SAE (Society of Automotive Engineers) Future Car Congress, Arlington, VA, June 2002, SAE Paper Number 2002-01-1955
Ouzzahra Y, Havenith G, Redortier B (2012) Regional distribution of thermal sensitivity to cold at rest and during mild exercise in males. J Therm Biol 37:517–523
Park JH, Yoo SJ (2012) Upper body mapping of sweat rate for develop-ment of cycle wear. J Korean Soc Living Environ Syst 19:171–177 (in Korean)
Psikuta A (2009) Development of an ‘artificial human’ for clothing research. De Montfort University, Leicester
Psikuta A, Richards M, Fiala D (2008) Single-sector thermophysiological human simulator. Physiol Meas 29:181–192
Psikuta A, Wang LC, Rossi RM (2013) Prediction of the physiological response of humans wearing protective clothing using a thermophysiological human simulator. J Occup Environ Hyg 10: 222–232
Smith CJ, Havenith G (2011) Body mapping of sweating patterns in male athletes in mild exercise-induced hyperthermia. Eur J Appl Physiol 111:1391–1404
Smith CJ, Havenith G (2012) Body mapping of sweating patterns in athletes: a sex comparison. Med Sci Sport Exer 44:2350–2361 Spencer-Smith JL (1978) The physical basis of clothing comfort, Part 6:
application of the principles of the design of clothing for special conditions. Cloth Res J 6:61–67
Wang F, Del Ferraro S, Lin LY, Mayor TS, Molinaro V, Ribeiro M, Gao C, Kuklane K, Holmér I (2012a) Localised boundary air layer and clothing evaporative resistances for individual body segments. Ergonomics 55:799–812
Wang F, Psikuta A, Aeberhart M, Wang LC, Weder M, Rossi RM (2012b) Effects of body motion and wind on thermal comfort properties evaluated using a manikin with realistic gait patterns. Proceedings of the 9th International Meeting on Thermal Manikin and Modeling (9I3M). Waseda University, Tokyo, pp 1–5
Wang F, Rossi RM (2013) A novel‘modular’ body mapping clothing (BMC) kit. US Design Patent, pending
Zhang H, Huizenga C, Arens E, Yu T (2001) Considering individual physiological differences in a human thermal model. J Therm Biol 26:401–408