To link to this article : DOI: 10.1016/S0021-9290(12)70036-2
http://dx.doi.org/10.1016/S0021-9290(12)70036-2
To cite this version : Roman, Sophie and Lorthois, Sylvie and Duru, Paul
and Risso, Frederic An optimized technique for red blood cells velocity
measurement in microvessels. (2012) Journal of Biomechanics, vol. 45 (sup.
1). pp. S35. ISSN 0021-9290
OATAO is an open access repository that collects the work of Toulouse researchers
and makes it freely available over the web where possible.
This is an author-deposited version published in : http://oatao.univ-toulouse.fr/
Eprints ID : 10161
Any correspondance concerning this service should be sent to the repository
administrator: [email protected]
AN OPTIMIZED TECHNIQUE FOR RED BLOOD CELLS
VELOCITY MEASUREMENT IN MICROVESSELS
Sophie Roman (1), Sylvie Lorthois (1), Paul Duru (1), Frédéric Risso (1)
1. Institut de Mécanique des Fluides de Toulouse, UMR CNRS 5502, France
Introduction
Oxygen and nutrient delivery to living tissues, as well as metabolic waste removal, are essentially determined by the dynamics of blood flow in microvascular networks. In these vessels, measuring the velocity distribution of red blood cells (RBCs) is still challenging. One of the most popular techniques used for that purpose is the Dual-Slit (DS), a temporal correlation technique, first introduced by Wayland and Johnson (1967): the vessel under study is trans-illuminated and two photo-sensors (slits) are positioned, separated by a known distance, Ls, along the vessel axis. The time
modulation of light is recorded at both positions. A cross-correlation velocity, Vds=Ls/Td, is obtained,
where Td is the time delay for which the
cross-correlation between the two signals is maximum. However, RBCs are positioned at different depths within the channel and thus move at different velocities. Baker and Wayland (1974) suggested that Vds is related to a dynamic averaged velocity,
but this has never been proved.
The aim of this work is to determine the relationship between the measured velocity Vds and
the actual velocity scales of the flow. For that purpose, the DS technique is first optimized using sequences of synthetic images representing RBCs flow. By this way, all the parameters characterizing the RBCs flow, including the shape of their velocity profile in the direction parallel to the incident light beam, which is inaccessible to the observer in real experiments, are controlled. The DS is then applied to in vitro RBCs flows in microchannels.
Methods
Synthetic image sequences are computer generated by simulating the flow of elliptical particles representing RBCs for various flow parameters: channel depth D, velocity Vmax at the
centre of the channel, shape of the velocity profile (from flat to parabolic) and RBCs volume fraction H. The parameters characterizing the technique are: spatial resolution (!), frame rate (F), number of images in the sequence (M), slits width (w) and height (h), and distance between the slits (Ls).
In vitro RBCS flows image sequences are recorded
using square and rectangular PDMS micro-channels and human RBCs washed suspensions.
Results
The parametric study performed on synthetic images shows that, when Ls increases, the measured
velocity Vds approaches Vmax, whatever the flow
parameters. Thus, in optimal conditions (see Tab. 1), the measured velocity corresponds to Vmax. The
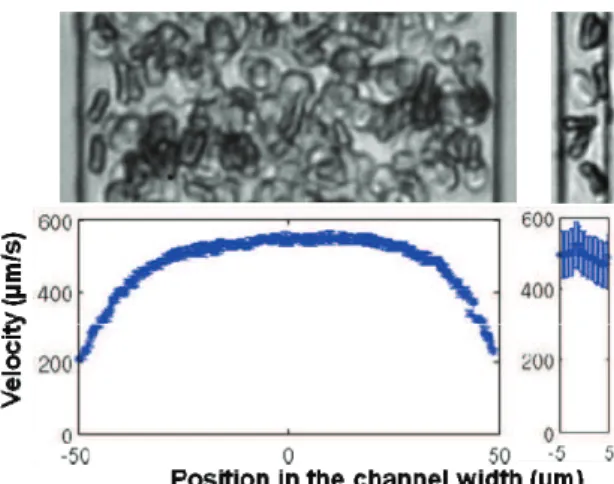
DS is then applied on in vitro image sequences for every position in the width of the channel, which leads to velocity profiles where each point represents the maximal velocity in the depth of the channel, see Fig. 1.
Vim (pixels/frame) M w and h(pixels) Ls (RBCs size) 15 . 0 max < = F V Vim δ VimM>9000 w=h=1 5 to10
Table 1: Operational parameters for an optimal use of the DS. Vim represents the maximal displacement of RBCs from one image to the other.
Figure 1: Typical images (bottom) and transverse velocity profiles (top) obtained for RBCs flow in a 20x100µm2 (left) and a 10x10µm2 (right) channel.
Discussion
We showed that, contrarily to previous thinking, the velocity measured by the Dual-Slit technique is the maximal velocity in the depth of the channel, provided that suitable conditions (Tab. 1) are applied. Therefore, many previous experimental results obtained by this technique might need to be revisited, with potential consequences on the phenomenology of microvascular flows.