Publisher’s version / Version de l'éditeur:
Vous avez des questions? Nous pouvons vous aider. Pour communiquer directement avec un auteur, consultez la première page de la revue dans laquelle son article a été publié afin de trouver ses coordonnées. Si vous n’arrivez pas à les repérer, communiquez avec nous à [email protected].
Questions? Contact the NRC Publications Archive team at
[email protected]. If you wish to email the authors directly, please see the first page of the publication for their contact information.
https://publications-cnrc.canada.ca/fra/droits
L’accès à ce site Web et l’utilisation de son contenu sont assujettis aux conditions présentées dans le site LISEZ CES CONDITIONS ATTENTIVEMENT AVANT D’UTILISER CE SITE WEB.
29th International Cement Microscopy Association Conference [Proceedings], pp. 472-489, 2007-05-21
READ THESE TERMS AND CONDITIONS CAREFULLY BEFORE USING THIS WEBSITE.
https://nrc-publications.canada.ca/eng/copyright
NRC Publications Archive Record / Notice des Archives des publications du CNRC :
https://nrc-publications.canada.ca/eng/view/object/?id=b6432284-03d9-4295-b191-1616e72e1361 https://publications-cnrc.canada.ca/fra/voir/objet/?id=b6432284-03d9-4295-b191-1616e72e1361
NRC Publications Archive
Archives des publications du CNRC
This publication could be one of several versions: author’s original, accepted manuscript or the publisher’s version. / La version de cette publication peut être l’une des suivantes : la version prépublication de l’auteur, la version acceptée du manuscrit ou la version de l’éditeur.
Access and use of this website and the material on it are subject to the Terms and Conditions set forth at High resolution cold field emission scanning electron microscopy of cements
http://irc.nrc-cnrc.gc.ca
H i g h r e s o l u t i o n c o l d f i e l d e m i s s i o n s c a n n i n g
e l e c t r o n m i c r o s c o p y o f c e m e n t s
N R C C - 4 9 4 7 6
M a k a r , J .
A version of this document is published in / Une version de ce document se trouve dans: 29th International Cement Microscopy Association Conference, Quebec City, May 21-22, 2007, pp. 472-489
The material in this document is covered by the provisions of the Copyright Act, by Canadian laws, policies, regulations and international agreements. Such provisions serve to identify the information source and, in specific instances, to prohibit reproduction of materials without written permission. For more information visit http://laws.justice.gc.ca/en/showtdm/cs/C-42
Les renseignements dans ce document sont protégés par la Loi sur le droit d'auteur, par les lois, les politiques et les règlements du Canada et des accords internationaux. Ces dispositions permettent d'identifier la source de l'information et, dans certains cas, d'interdire la copie de documents sans permission écrite. Pour obtenir de plus amples renseignements : http://lois.justice.gc.ca/fr/showtdm/cs/C-42
High Resolution Cold Field Emission Scanning Electron Microscopy of
Cements
Jon Makar
Institute for Research in Construction National Research Council Canada
1200 Montreal Road, Ottawa, Ontario K1G 2P5 Canada
Abstract:
Considerable attention has been paid in recent years to the use of environmental scanning electron microscopy and cryo-scanning electron microscopy for the study of hydrated cements. However, a different class of scanning electron microscopes (SEM), the high vacuum cold field emission (CFE) SEM also have applications in cement
microscopy, having a unique set of advantages and disadvantages compared to other forms of SEM. CFE-SEMs are capable of operating at very low accelerating voltages and can thus produce very high magnification images without requiring coating of samples. However, sample preparation is a key issue for the use of these instruments, as the high vacuum environment of the CFE-SEM will draw free water out of the samples under examination. This paper discusses the use of CFE-SEM for tricalcium silicate and ordinary Portland cement microscopy, with an emphasis on both the early stages of cement hydration and unhydrated samples. The recent discovery of nanoscale structures formed at the end of the induction period is described.
Introduction
The last fifteen years have seen significant changes in scanning electron
microscopy (SEM) technology with the development of new instruments and approaches to imaging. These changes have created new options for the imaging of cement and concrete. In particular, environmental scanning electron microscopy (ESEM) [1-4] and, more recently, cyro-SEM [4-6] have been used to study cement hydration processes, providing information that was impossible to obtain using older instruments.
Both techniques have known limitations. Although ESEM allows in-situ imaging, control of the water/cement ratio is difficult, possibly altering cement chemistry [4]. In addition, the presence of water vapour and the need for high electron accelerating voltages may obscure important details of hydrating cement structure. Cyro-SEM requires special equipment for cooling the samples inside the SEM and is limited by the need to coat samples with gold for imaging. A comparison of the two techniques [4] suggested that both have value, but may produce artifacts due to non-ambient conditions.
One approach to high resolution SEM on OPC and C3S that has not been
explored in detail in the literature is the use of low accelerating voltages in cold field emission scanning electron microscopy (CFE-SEM). This technique takes advantage of the high vacuum in CFE-SEM instruments to image samples at very high magnifications without the need for coatings. A potential limitation is that samples need to be prepared in advance in a manner similar to that used for traditional SEM work, through the use of freeze-drying or other methods. Recent work using this technique has shown that the induction period in cement hydration ends with the formation of nanoscopic pores and C-S-H growth on the surface of the grains of the hydrating cement [7,8]. These events correspond to a small peak in the conduction calorimetry curve at the end of the
induction period [7]. This paper describes some of the features that can be observed on both hydrated and unhydrated cements using CFE-SEM, with an emphasis on the first six hours of hydration. The results of the hydration studies are compared to those
produced by the other modern imaging techniques and the possible impact of the loss of water on the results is discussed.
Experimental Techniques
A type 10 OPC (manufactured by St. Laurence Cement in 2005) and pure C3S
(CTL, Inc., 2006) were investigated for the work reported here. Details of the
composition of the OPC can be found elsewhere [8]. Samples of the OPC were hydrated in a Thermometric Tam Air Isothermal Calorimeter (model 3114) using Accusolv
(Anachemia, Inc.) water with a maximum impurity level of 1 ppm at a w/c ratio of 0.5 by mass. The results of the conduction calorimetry measurements were then plotted and used to select specific times of hydration to be investigated by CFE-SEM.
Additional samples were then hydrated at the same water to cement ratio using the same water supply for each combination of cement and time to be investigated. The hydration reactions were halted at intervals ranging from a half hour to six hours by repeated washing in isopropanol. The samples were then dried in a vacuum oven at room temperature before being transferred to a vacuum dessicator, where they were held until needed. This procedure allowed for a slow removal of water from the samples, rather than the abrupt removal that would be produced by immediately placing the
samples in the high vacuum of the CFE-SEM. Additional samples at selected times were prepared by freeze drying.
There is debate in the literature as to whether solvent-based techniques for stopping hydration affected the microstructure of hydrated cement [9,10]. However, a comparison between the results of freeze-dried samples, believed to produce the best preservation of cement microstructure [10], and those dried by isoproponal showed that there were no visible differences between the observed structures on samples prepared by the two methods [8]. The question of the extent to which removal of water by either method affected the microstructure is discussed in more detail below.
Grains of the OPC at each hydration time were placed on carbon tape attached to SEM aluminum stubs for imaging. No coatings were used on the samples in order avoid obscuring fine detail of the cement structures. A minimum of 16 grains from each sample were imaged in a Hitachi S-4800 cold field emission scanning electron microscope at a 2
keV accelerating voltage with 4 μA emission current. Working distances ranged from 2.5
to 2.9 mm. For the purposes of comparison to past SEM and environmental SEM studies, selected grains of hydrated OPC were also imaged at both 2 keV and 20 keV,
with a 4 μA current and a 4.9 mm working distance, the minimum possible to use in the
instrument at the higher accelerating voltages. Most images were taken at 40,000x or 80,000x magnification, but lower or higher magnifications were used where appropriate.
In addition to the grains of hydrated OPC, grains of unhydrated OPC from the same source, type 10 OPC from a second source (Lafarge, 2004), aged normal Portland cement (NPC) (Maritime, 1974) and both new (CTL Inc., 2006) and aged (CTL Inc.,
1982) C3S were also imaged. A variety of imaging conditions, including high and low
accelerating voltages, the use of instrument filters and decelerating voltages were used as appropriate to obtain the best images. Samples were again uncoated to obtain the highest level of detail, although at the cost in some cases of the creation of charging artifacts.
Conduction Calorimetry Results
Figure 1 shows the conduction calorimetry results for the hydration of the St. Laurence 2005 OPC used to illustrate the early hydration behaviour of ordinary Portland cement. Most of the images were taken at the times marked in the inset, with additional samples prepared after four and six hours of hydration. The details of the behaviour shown in the inset between 1.5 and 2.5 hours are the primary reason for the hydration study.
Figure 1 – Conduction calorimetry results for St. Laurence 2005 OPC, showing times for obtained images.
SEM Imaging Results
High versus Low Voltage Comparisons
Most work with standard and environmental scanning electron microscopes is done at high accelerating voltages. A key feature of CFE-SEM imaging is the ability to operate at low keV. Figures 2 and 3 illustrate the differences in image resolution made possible by the lower operating voltage. Figure 2 showing a low magnification image of the Maritime NPC, chosen for the long rod structures (likely a form of calcium sulphate) on the grain surface. While major features are still visible, most of the details are lost at the higher accelerating voltage and smaller features may not be detected at all. Figure 3 shows higher magnification images of hydrated OPC. Only large, general shapes can be seen in the high voltage images, but the low keV images show fine detail of structures with sizes on the order of tens of nanometers. The difference is that in the case of the higher accelerating voltages, the emitted electrons penetrate more deeply into the
Figure 2 – Unhydrated Maritime 1974 NPC. Left image, 20 keV; right image 2 keV.
Figure 3 – St. Laurence 2005 OPC at 180 minutes hydration. Top images, 20 keV; bottom images, 2 keV.
imaged material. As a result, surface structures may be obscured or invisible. It is also worth noting that even at high accelerating voltages, the higher vacuum in a CFE-SEM allows for the capture of clearer images than were possible in previous generations of conventional SEMs.
Unhydrated C3S
Figures 4 to 6 show images of unhydrated C3S. Figure 4 shows an example of
new C3S with a Blaine surface area measurement of 3200 cm2/g. This material appears
rounded due to sintering during production, with some flat areas where the material has been broken off at necks during a subsequent grinding process. Many smaller particles can be seen attached to the surface of the grains. Unlike OPC, where high magnification
imaging can be possible with minimal charging, images of C3S have charging artifacts
even at comparatively low magnifications and low accelerating voltages (dark patches in the right image, Figure 4). As shown in Figure 5, the use of decelerating voltages and/or
helical filters (E x B filter in the Hitachi instrument) can allow imaging at significantly
higher magnifications with minimal charging, although at the cost of reduced apparent
depth of field. Surface textures can be observed on the C3S, but the surfaces appear to
be pore free.
High resolution scanning electron microscopy can also be useful in detecting the
contamination of C3S and other cement constituents. Figure 6 shows an example of a
particularly badly contaminated grain of C3S from a batch that had been manufactured in
1982. Although the observed structures were too fine to be analyzed using SEM based methods such as electron dispersive x-ray spectroscopy, a thermogravimetric analysis showed significant carbonation, but no evidence of hydration products, suggesting that the feathery structures in the image are formed of calcium carbonate.
Figure 5 - Unhydrated new C3S with additional surface texture revealed through decelerating voltage (left) or instrument filters (right)
Figure 6 - Unhydrated old C3S, showing possible carbonation structures
Unhydrated OPC
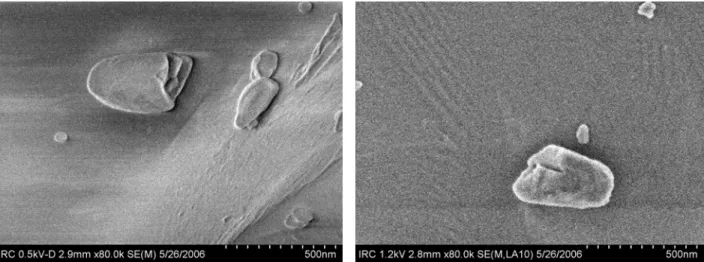
Figures 7 to 12 show examples of unhydrated OPC. The grains in Figure 7 are examples of the most commonly observed appearance of unhydrated OPC, with relatively smooth surfaces, some texture and numerous small particles adhered to the grain surfaces. The small particles disappear immediately after hydration, suggesting that they may be composed of a form of calcium sulphate or tricalcium aluminate.
While some charging effects can be seen at the higher magnifications (Figure 8),
they are not as problematic as in the imaging of C3S. A close examination of the
surfaces in these grains shows that they are smooth or have minimal surface roughness. Other grains show roughness (Figure 9, left image), damage from grinding (Figure 9, right image) or cracking (Figure 10, arrows). Pores are not evident in the surface of the unhydrated OPC grains.
Figure 7 - Unhydrated OPC, most common appearance. Left St. Laurence 2005, right Lafarge 2004
Figure 8 - Unhydrated St. Laurence 2005 OPC, most common appearance
Figure 9 - Examples of roughness in unhydrated OPC. Left image, grain surface, Lafarge 2004; right image, center of fractured area, with separated grain fragments, St. Laurence 2005.
Figure 10 – Cracking in unhydrated St. Laurence 2005 OPC.
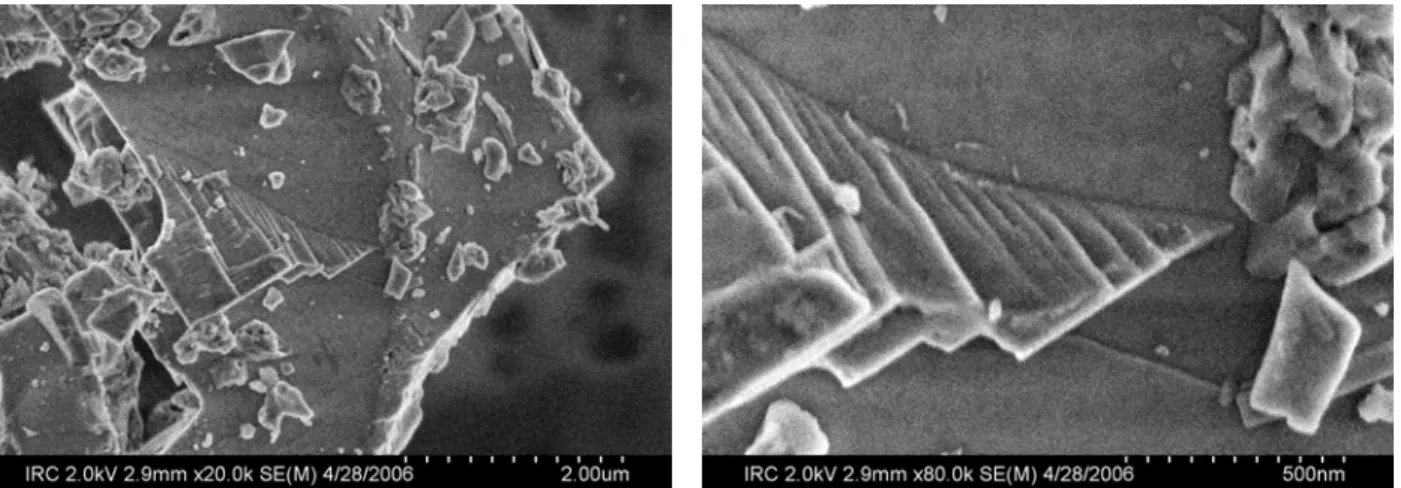
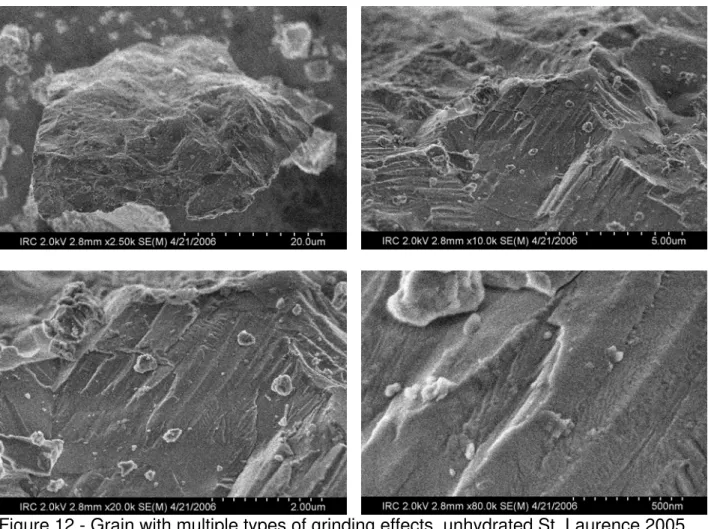
A relatively common feature in unhydrated OPC is evidence of layered structures in the grains. This may take the form of exposed steps (Figure 11) or a sequence of ridges in the grain, which can occur at multiple scales (Figure 12). These layers may be produced
by the clinker cracking at weak points in the structure of C3S in OPC. While pure C3S is
triclinic, contaminants in OPC tend to produce a monoclinic structure [11], which would tend to produce ridges and layers at lines of fracture.
Figure 11 - Layered structures exposed during grinding, unhydrated St. Laurence 2005 OPC
Early Hydration Behaviour
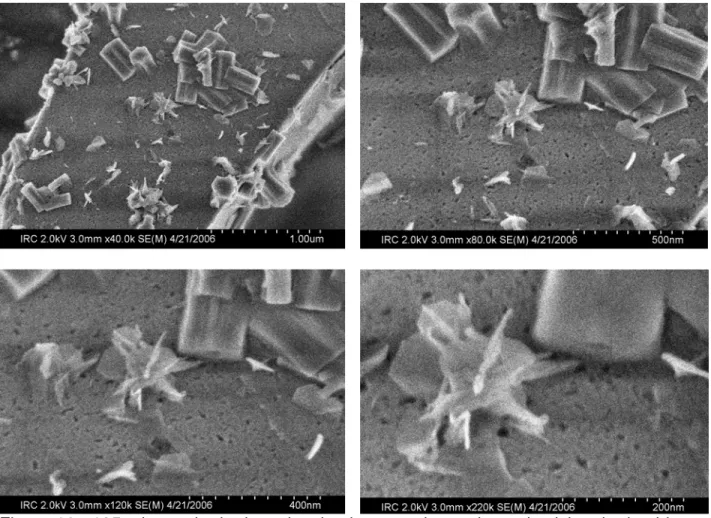
Figures 13 to 20 use images of St. Laurence 2005 OPC to show typical early hydration behaviour. The appearance shown in Figure 13 is typical for images taken during the induction period. The surface of OPC grain remains smooth, but new structures have formed on top of it. These include prismatic structures identified as ettringite [8] (solid arrows), flat, irregular structures that may be early examples of AFm
Figure 12 - Grain with multiple types of grinding effects, unhydrated St. Laurence 2005 OPC
(grey dashed arrow, left image), hexagonal calcium hydroxide crystals (white dashed arrows, right image) and a few examples of very fine, straight structures that may be C-S-H (dotted arrow, right image). In the case of images taken at 105 minutes, just before the onset of the primary hydration activity, a few fine pores can also be seen in some samples. The amount of ettringite on the surface of the OPC grains varies from the few prisms seen in the left image in Figure 13 to examples where the grains are almost completely coated.
By 120 minutes of hydration, just after the beginning of the small bump in the hydration heat flow curve (Figure 1 inset), many of the cement grains have the appearance shown in Figure 14, with pores visible across the surface of the grain. Typical pore sizes range from the resolution of the microscope (~4 nm in Figure 14) to about 20 nm. Most grains have a scattering of C-S-H hydration product across their surface, typically spiky in appearance and with a lighter colour than either the cement
grain or the C3A hydration products. A few grains show more extensive C-S-H hydration
Figure 13 – St. Laurence 2005 OPC at 105 minutes hydration
Figure 14 - St. Laurence 2005 OPC at 120 minutes hydration – pores formation in region of minimal ettringite
Figure 15 – St. Laurence 2005 OPC at 120 minutes hydration, pore formation in region of greater ettringite presence
Formation of both pores and C-S-H on the grain surface continues for the next hour, with different grains exhibiting different rates of reaction. At 135 minutes (Figure 16), most grains have increased porosity, but have similar levels of C-S-H formation as those examined at 120 minutes of hydration. Very high magnification images suggest that the extent of the porosity is higher than previously, even if there is still relatively minimal amounts of C-S-H on individual grains of OPC. Both Figures 14 and 16 show that there are numerous pores in the surface without attached C-S-H growth, a strong indication that the pores are forming from external attack, not internal osmotic pressure.
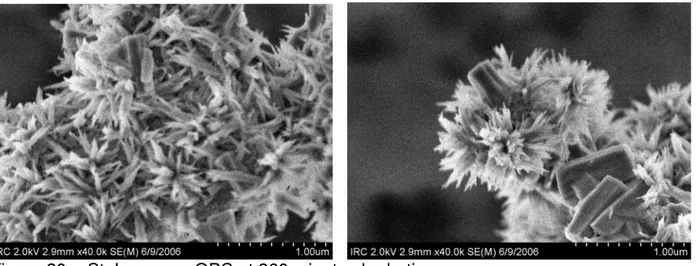
Between 135 minutes and 180 minutes, some grains are seen that are completely coated with fine spikes of C-S-H, 10 – 20 nm across and 200 – 300 nm in length (Figure 17, left image). While in some cases the C-S-H is clustered together, in others it is evenly distributed across the grain surface. Other grains show increased depth of
porosity. C-S-H formation can also be seen on ettringite prisms (white structures, center of Figure 17, right image). This image also shows the final detail in the ettringite prisms, which appear to have been formed from many sub-structures of high aspect ratio. Pores in the ends of the ettringite prisms (arrow) were also frequently identified.
Although individual grains were covered with C-S-H or pores, cracks and steps were still readily visible (Figure 18) on many of the observed OPC grains. The apparent sharpness of the steps is an indicator that a coating of C-S-H gel was not formed during the initial wetting of the grains and then removed during sample preparation, as the sharpest features would be expected to be the most highly affected during a hydration process. Pores can, however, be observed in some of the steps in the right image.
By 240 minutes time (Figure 19), the pores have deepened and have often joined together. More grains are coated with C-S-H and the clusters of C-S-H appear to be longer in size and thicker. At 360 minutes (Figure 20), most grains are thoroughly covered with C-S-H and have taken on an appearance similar to that seen in earlier images of C-S-H taken at later times in the hydration process.
Discussion
Imaging of Unhydrated C3S and OPC
Low keV CFE-SEM imaging offers clear advantages over conventional SEM for the imaging of unhydrated samples. Lower charging rates and higher vacuum provides clearer images and enables significantly higher magnifications, resolving fine details such as adhered particles, grinding damage and layering in OPC. The implications of some of the observed features are not as clear. Recent work at NIST has focused on using real shapes of OPC particles in models of cement hydration [12]. CFE-SEM images would allow for an additional level of detail applied to this type of modeling, including both better definitions of the shape of the cement particles and the effects of damage. However, the
Figure 16 - 135 minutes hydration, showing increased porosity and calcium hydroxide formation
Figure 18 - St. Laurence OPC at 150 minutes hydration, showing pores and intact steps
Figure 20 - St. Laurence OPC at 360 minutes hydration
extent to which incorporating this information in such models will improve their accuracy remains to be seen.
Differences Between Types of Scanning Electron Microscopes
As noted in the Introduction, recent work on hydrating cement has focussed on the environmental and cryo- SEM techniques. Each of these techniques has unique
advantages and disadvantages. Environmental SEMs allow in-situ observation of hydrating cements, but the quality of the images may be degraded by the use of high accelerating voltages, the presence of atmosphere in the immediate vicinity of the sample and the need for the electrons to penetrate any water that may be around the samples. Cryo-SEM work allows the use of high vacuum and lower accelerating voltages, but requires careful sample preparation, a cooling stage and gold plating the samples, which may obscure details of importance. CFE-SEM appears to have the highest resolution capabilities of the three techniques and requires a less difficult sample preparation procedure than cryo-SEM. However, the use of high vacuum in CFE-SEM raises long standing questions about the effect of water loss on the morphology of the observed structures.
Certain structures observed previously in both ESEM and cyro-SEM appear to correspond well to those presented here. The hydrated phases imaged here between 135 minutes and 180 minutes (Figure 18, left image) appear similar to those imaged at the same time of hydration using cryo-SEM [4], while those imaged at 5 minutes of hydration in the same source have some correlation with the induction period results here. Scattered C-S-H on stepped surfaces and ettringite prisms similar to those seen here (Figure 18, right image) have also been reported [6], although in OPC hydrated in the presence of superplasticizers. In general, greater detail can be seen in the CFE-SEM images, but this may be simply due to the use of gold coating in the cryo-SEM images.
There is less correlation between the ESEM images and those shown here. Some reports describe the rapid formation of gel-like sheaths of C-S-H coating after the
hydration of C3S, although others have shown little or no coating after 5 minutes, with the
development of gel forms later in the hydration period. Neither comparable cryo-SEM
images [4], the CFE-SEM work on C3S reported elsewhere [7] or the work on OPC here
show similar gel like sheathes, which may be due to precipitation effects. The presence of steps and sharp edges in the OPC well after hydration (Figure 18) suggests that a gel has not been formed and then removed during sample preparation.
There are still questions that remain to be resolved with respect to the effect of
loss of water in the preparation of samples for CFE-SEM. Water in hydrated OPC or C3S
may be chemically bonded in C-S-H or other hydration products, found in cement pores, take the form of interlayer water or be adhered to the surface of the hydration products. The chemically bonded water should not be disturbed by the preparation methods used here. It is also likely that, at the stage of hydration under examination, there are
insufficient amounts of the remaining forms of water present for their loss to profoundly affect the C-S-H morphology. While pores can be readily seen in the cement grains, insufficient C-S-H growth has occurred at the times under consideration for water
trapping to take place in C-S-H pores. Similarly, the very fine forms of C-S-H seen here would be expected to have little interlayer water. The removal of adsorbed water on the surface of the C-S-H would not be expected to affect the morphology of the C-S-H at the scales that can be observed here. These arguments and the similarity between the results of cryo-SEM and those reported here suggest that the loss of water has little impact on the C-S-H morphology at the early stages of hydration. Further work is needed to confirm this point.
It is possible, however, that ettringite is affected by the sample preparation procedure. Some observed examples of ettringite have concave sides or pores in their ends. These effects may have been caused by water loss. On the other hand, recent work [13] has shown that ettringite can vary markedly in size and shape depending on ambient conditions, so it is also possible that their appearance represents natural variations in the ettringite structure. Further work is also needed to clarify this issue.
Conclusions
The capability of cold field emission scanning electron microscopy to operate at low accelerating voltages allows it to image a wide variety of small scale structures in both hydrated and unhydrated cements. In unhydrated cements, adhered particles, grinding damage and final details of grain structure can be identified. In hydrating cements, nanoscopic pores, details of ettringite structure and early C-S-H formation are visible. These capabilities have allowed a more detailed understanding of early hydration processes and may lead to higher performance OPC.
CFE-SEM appears to be capable of resolving cement features with greater resolution than either environmental or cryo- scanning electron microscopy. However, each of the techniques has specific advantages and disadvantages in the imaging of hydrating cements. The techniques are to a certain extent complimentary in nature, providing different forms of information. A round robin, direct comparison between the results of all three techniques, using the same cements and the same times of hydration for the imaging, appear to be warranted in order to clearly understand where each technique is most useful.
Acknowledgments
Samples for imaging were prepared by G.W. Chan and K.Y. Esseghaier.
References
1. P. Meredith, A.M. Donald and K. Luke, “Pre-induction and induction hydration of tricalcium silicate: an environmental scanning electron microscopy study”, J. Mater.
Sci., 30 1921-1930 (1995).
2. J. Stark, B. Möser, and A. Eckart, “New approaches to cement hydration, part 1”,
ZKG Inter., 54 [1] 52-60 (2001).
3. J. Stark, B. Möser, and A. Eckart, “New approaches to cement hydration, part 2”,
ZKG Inter., 54 [2] 114-119 (2001).
4. J. Neubauer and F. Goetz-Neunhoffer, “Electron microscopy during early cement
hydration”, Proceedings of the 27th International Conference on Cement Microscopy,
(April 24th-28th, Victoria, Canada), International Cement Microscopy Association
(2005).
5. H. Pollmann, J. Goske and H.G. Pankau, “Application of Cryo Transfer Scanning Electron Microscopy for Investigation of Cement Hydration and Cementitious
Systems”, Proceedings of the 22nd International Conference on Cement Microscopy,
International Cement Microscopy Association 310-331 (2002).
6. Ch. Huebsch, et al., “Microstructural investigations on early hydration products of cementitious systems in combination with modern PCE-type superplasticizers by
advanced cryo- transfer SEM”, Proceedings of the 27th International Conference on
Cement Microscopy, (April 24th-28th, Victoria, Canada), International Cement Microscopy Association (2005).
7. J.M. Makar, G.W. Chan, and K.Y. Esseghaier, “An Additional Hydration Reaction at the End of the Cement Induction Period”, to be published in J. Mater. Sci. Let., 2007.
8. J.M. Makar and G.W. Chan, “Causes of the induction period in ordinary Portland cement”, submitted to J. Amer. Ceram. Soc., 2006.
9. C. Gallé, “Effect of drying on cement-based materials pore structure as identified by mercury intrusion porosimetry: A comparative study between oven-, vacuum-, and freeze drying”, Cem. Concr. Res., 31 1467-1477 (2001).
10. Korpa and R. Trettin, “The influence of different drying methods on cement paste microstructures as reflected by gas adsorption: Comparison between freeze-drying (F-drying), D-Drying , P-drying and oven drying methods”, Cem. Concr. Res., 36 634-649 (2006).
11. H.F.W. Taylor, Cement Chemistry, 2nd Edition, Thomas Telford, London, p. 5, (1997).
12. J.W. Bullard, E.J. Garboczi, A Model Investigation of the Influence of Particle Shape on Portland Cement Hydration, Cem. Concr. Res. 36 1007-1015 (2006).
13. Goetz-Neunhoeffer, J. Neubauer and P. Schwesig, “Mineralogical characteristics of Ettringites synthesized from solutions and suspensions”, Cem. Concr. Res., 36 65-70 (2006).