Publisher’s version / Version de l'éditeur:
Journal of Materials Science, 42, February 4, pp. 1388-1392, 2007-02-01
READ THESE TERMS AND CONDITIONS CAREFULLY BEFORE USING THIS WEBSITE.
https://nrc-publications.canada.ca/eng/copyright
Vous avez des questions? Nous pouvons vous aider. Pour communiquer directement avec un auteur, consultez la
première page de la revue dans laquelle son article a été publié afin de trouver ses coordonnées. Si vous n’arrivez pas à les repérer, communiquez avec nous à [email protected].
Questions? Contact the NRC Publications Archive team at
[email protected]. If you wish to email the authors directly, please see the first page of the publication for their contact information.
NRC Publications Archive
Archives des publications du CNRC
This publication could be one of several versions: author’s original, accepted manuscript or the publisher’s version. / La version de cette publication peut être l’une des suivantes : la version prépublication de l’auteur, la version acceptée du manuscrit ou la version de l’éditeur.
For the publisher’s version, please access the DOI link below./ Pour consulter la version de l’éditeur, utilisez le lien DOI ci-dessous.
https://doi.org/10.1007/s10853-006-1427-3
Access and use of this website and the material on it are subject to the Terms and Conditions set forth at
A Peak in the hydration reaction at the end of the cement induction period
Makar, J. M.; Chan, G. W.; Esseghaier, K. Y.
https://publications-cnrc.canada.ca/fra/droits
L’accès à ce site Web et l’utilisation de son contenu sont assujettis aux conditions présentées dans le site LISEZ CES CONDITIONS ATTENTIVEMENT AVANT D’UTILISER CE SITE WEB.
NRC Publications Record / Notice d'Archives des publications de CNRC:
https://nrc-publications.canada.ca/eng/view/object/?id=4b884520-739c-4ba5-ae9c-de5cf6a2485b https://publications-cnrc.canada.ca/fra/voir/objet/?id=4b884520-739c-4ba5-ae9c-de5cf6a2485b
http://irc.nrc-cnrc.gc.ca
A P e a k i n t h e h y d r a t i o n r e a c t i o n a t t h e e n d
o f t h e c e m e n t i n d u c t i o n p e r i o d
N R C C - 4 9 4 8 6
M a k a r , J . M . ; C h a n , G . W . ; E s s e g h a i e r , K . Y .
A version of this document is published in / Une version de ce document se trouve dans: Journal of Materials Science, v. 42, no. 4, Feb. 2007, pp. 1388-1392
Doi: 10.1007/s10853-006-1427-3
The material in this document is covered by the provisions of the Copyright Act, by Canadian laws, policies, regulations and international agreements. Such provisions serve to identify the information source and, in specific instances, to prohibit reproduction of materials without written permission. For more information visit http://laws.justice.gc.ca/en/showtdm/cs/C-42
Les renseignements dans ce document sont protégés par la Loi sur le droit d'auteur, par les lois, les politiques et les règlements du Canada et des accords internationaux. Ces dispositions permettent d'identifier la source de l'information et, dans certains cas, d'interdire la copie de documents sans permission écrite. Pour obtenir de plus amples renseignements : http://lois.justice.gc.ca/fr/showtdm/cs/C-42
A Peak in the Hydration Reaction at the End of the Cement Induction Period
J.M. Makar*, G. W. Chan and K. Y. Esseghaier Institute for Research in Construction
National Research Council Canada 1200 Montreal Road, Ottawa, Ontario K1A 0R6
Canada
*
Corresponding author: [email protected]
Although the hydration of ordinary Portland cement (OPC) and its main constitutent,
tricalcium silicate (3CaO.SiO2 or C3S), have been studied for many decades1, some aspects of the
hydration process remain poorly understood. In particular, there is little consensus on the
mechanisms related to the dormant or induction period2,3. The induction period is a time of
minimal hydration activity between the initial hydration reactions upon wetting and the later
priamry tricalcium silicate reaction with water to form calcium silicate hydrate and calcium
hydroxide. This letter examines the mechanisms responsible for a peak in hydration activity at
the end of the induction period. Although occasionally seen in the literature4, this peak appears
absent in most reported measurements and has therefore remained unexplained.
The hydration reactions were studied through conduction calorimetry, a standard method
of measuring the heat produced during cement hydration and other processes5-9. Here, a new
approach to the analysis of conduction calorimetry data through the use of derivatives was used.
The presence of individual reactions can be more easily identified and the effects of changes in
reaction conditions more easily traced using derivative analysis than by using standard
conduction calorimetry alone. Similar advantages have been identified in the use of derivative
differential thermal analysis10, while derivative methods are also used in other forms of thermal
Both pure C3S (surface area 0.32 m2/g) and OPC samples were hydrated in a
Thermometric Tam Air Isothermal Calorimeter (model 3114) using Accusolv (Anachemia, Inc.)
water with a maximum impurity level of 1 ppm at a water/cement (w/c) ratio of 0.5 by mass. All
measurements were conducted at a constant temperature of 24oC. Most measurements were
made at one minute intervals, with one second intervals used for additional tests to confirm the
primary results. All data were recorded using a computer based data acquisition system with a
typical uncertainty of ±0.002 mW/g. While the C3S and OPC results reported here are each from
single commercial sources, similar results were observed for all cements that have been examined
(seven C3S and four OPC to date). The C3S used in the initial work was also ground to produce
samples with five different surface areas (determined by BET surface measurement), which were
hydrated in the conduction calorimeter at the same w/c ratio.
The high signal to noise ratio of the recorded data allowed it to be smoothed (Sigmaplot
9.0, Systat Software, Inc.) to reduce the remaining background noise and allow derivatives to be
taken. The smoothing was done using a Gaussian weighting function (e-u^2, where u is the
normalized distance of the data used in the smoothing), typically with a third order polynomial
regression. Considerable care was taken to ensure that the smoothing process did not affect the
underlying shape of the hydration curve. First and second order derivatives of the heat flow data
with respect to time were then calculated using a standard numerical approach11. No additional
information was gained from the second order derivatives.
Samples of as-delivered C3S at the same w/c ratio were also hydrated for times ranging
from a half hour to four hours under ambient conditions for additional study. The hydration was
stopped by washing in excess isopropanol and the samples dried for 24 hours in a vacuum oven.
This procedure may change the morphology of later hydration products, but has been used
The samples were then analysed using differential scanning calorimetry (DSC) (TA Instruments
SDT Q-600) under nitrogen gas and cold field emission scanning electron microscopy
(CFESEM, Hitachi S-4800). The CFESEM imaging was undertaken at an emission current of 4
μA and an accelerating voltage of 1kV on uncoated samples, allowing for greater resolution of details of the surface than has typically been reported in the cement literature.
Figures 1a and 1b show typical conduction calorimetry data and the corresponding time
derivatives for tricalcium silicate and OPC respectively, with Figures 1c and 1d showing the
corresponding induction period behaviour. The numbers on the graphs indicate the various
reaction peaks in the heat flow plots and their corresponding maximum time derivatives. Peaks 1
to 3 are common to both materials, while peaks 4 and 5 only occur in OPC and have been
associated with reactions by constitutents other than C3S13. The initial reactions upon wetting
(peak 1, both figures) and the main tricalcium silicate reaction (peak 3, both figures) are well
known1. Although peak 1 occurs in both materials, in OPC it is predominated by the initial
tricalcium aluminate (3CaO·Al2O3) hydration reactions. As very early data was subject to
fluctuations produced as the apparatus establishes thermal equilibrium, only the final stages of
peak 1 are shown.
Peak 2, the focus of this letter, is not well studied. Its presence in both examined
materials indicates an origin in a C3S reaction, while its temporal position suggests an association
with the events that cause the end of induction period. Peak 2 may be difficult to discern in
commercial cements without high resolution conduction calorimetry measurements. However,
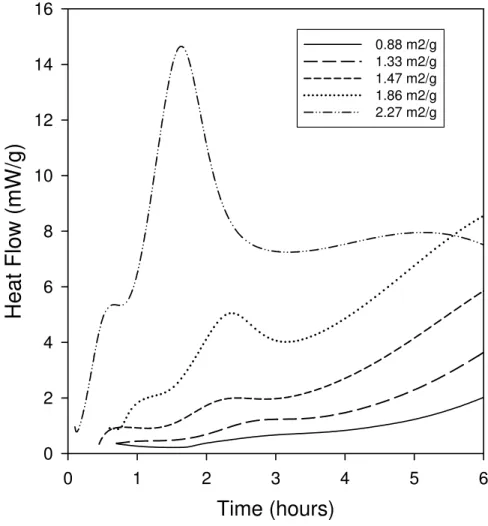
grinding cement samples to increase their surface area greatly enhances the heat produced during
peak 2, producing values that can readily be measured (Figure 2). In addition, the point marked I
the shape expected from exothermic cement hydration reactions, with an initial maxima followed
by a minima.
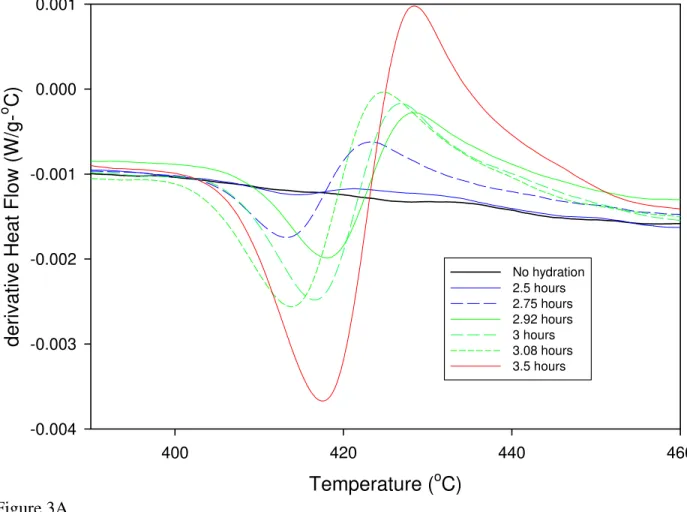
The DSC results during the calcium hydroxide decomposition of the as-delivered C3S
paste (Figure 3a) showed that a change in the rate of growth of the calcium hydroxide in the
samples occurs at the onset of peak 2 (Figures 3b and 3c), with slower growth rates occurring
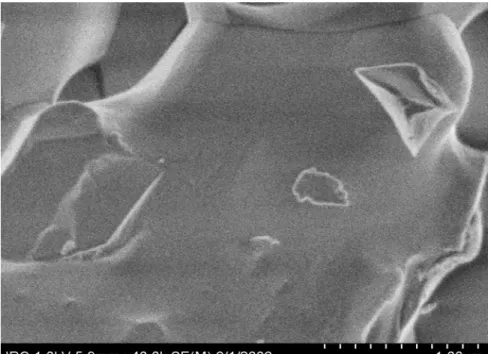
immediately after the peak than before it. Moreover, the CFESEM examination showed distinct
morphological changes associated with the peak 2 reaction. Unhydrated grains showed no
reaction products (Figure 4a). While individual cement grains varied due to local reaction
conditions, almost all C3S grains observed at 2.5 hours of hydration had smooth surfaces with
minimal porosity (arrows, Figure 4b) and hydration products. Immediately before peak 2,
shallow, 10-30 nanometer wide pores and increased hydration products were more widespread
(Figure 4c), but many regions remained pore free. During the peak 2 reaction, the pores
deepened and became more common, while the hydration products increased in size and grew
away from the surface (Figure 4d). Further increases in size of the pores and the hydration
products were seen after peak 2 (Figure 4e). The same pattern of behaviour was observed in both
the finely ground C3S and the OPC samples. Similar, although much larger, porosity has been
reported previously during the hydration of C3S pellets14, while the calcium silicate hydrate
structures appear to correspond to those observed by transmission electron microscopy12.
The conduction calorimetry results in Figure 2, the change in the rate of formation of
calcium hydroxide at Peak 2 (Figure 3) and the CFESEM images all suggest that peak 2 is related
to behaviour at the surface of the cement grains. Previous work14,15 has suggested that a
protective layer forms on the surface of the C3S during peak 1, which inhibits further hydration
reactions. For the C3S used here, hydration products formed in small quantities on the grain
1c, Point I). The rate of change in the heat flow then dropped (Point II), suggesting a reduced
availability of reaction precursors. This effect was increased in the high surface area examples in
Figure 2. The protective layer then appears to have been penetrated and pores formed in the
surface of the grain. The renewed availability of reaction precursors allowed the grain surface to
be covered with hydration products, producing peak 2 and the rapid increase in calcium
hydroxide formation in Figure 3. Peak 2 increased with increasing surface area as more sites
were available for pores and surface hydration products to form. Peak 2 then ended as the
available sites for pore formation and hydration product nucleation on the surface of the grain
were consumed. After this point, nucleation and growth processes on the existing hydration
products dominated the hydration reaction, producing peak 3 and a slower rate of increase in
calcium hydroxide formation. It is worth noting that while all the hydration reactions are
exothermic, the pore formation process might possibly be endothermic in nature, as its thermal
behaviour is masked by the simultaneous hydration product formation.
As peak 2 represents a surface effect, increasing grain size or the contamination of the
surface of unhydrated OPC or C3S through carbonation or partial hydration would be expected to
reduce its extent. Further work is needed to understand the implications of the process that
creates peak 2 on the operation of chemical admixtures such as superplasticizers, which are
believed to function at the surface of hydrating cement grains16. Work is also needed to
incorporate the existence of peak 2 into the existing models2-3 for the early stages of cement
hydration, which do not include the processes described here.
Acknowledgements: J.J. Beaudoin and V.S. Ramachandran provided useful comments in the writing of this paper. K. Trischuk provided the BET surface measurements. This research was
References
1. A.M. Neville in “Properties of Concrete”, 4th Edition., (Pearson Education Limited, 1995), p. 13.
2. H.F.W Taylor in “Cement Chemistry” 2nd Ed., (Thomas Telford, London, 1997), p. 153. 3. H.F.W Taylor et al., Materiaux et Constructions, 17 (1984) 457.
4. P. Longuet, Proceedings of the Fifth International Symposium on the Chemistry of Cement (Tokyo, Oct 7-11, 1968), Part II, vol. II (1969) 30.
5. V.S. Ramachandran, et al. in “Handbook of Thermal Analysis of Construction Materials”, (Noyes Publications, Norwich, New York, 2003), p. 26.
6. A.L. Smith, H. M., Shirazi, and F. C. Smith, Catalysis Letters 104 (2005) 199. 7. J.M. Delgado-Sanchez, et al., J. Phys. (D) Cond. Mat., 17 (2005) 2645.
8. P. Bunyan, C. Baker and N. Turner, Thermo. Acta, 401 (2003) , 9. 9. T. Maskow and W. Babel, J. Biotech. 101 (2003) 267.
10. V.S. Ramachandran in “Applications of Differential Thermal Analysis in Cement Chemistry” (Chemical Publishing Company, New York, 1969), p. 48.
11. A. Ralston and P. Rabinowitz in “A First Course in Numerical Analysis” (Dover Publications, Mineola, New York, 2001), p. 93.
12. E. Henderson and J.E. Bailey, J. Mater. Sci., 28 (1993) 3681.
13. P.L. Pratt and A. Ghose, Phil. Trans. R. Soc. Lond. A, 310 (1983) 93. 14. D. Ménétrier, et al., Cem. Conc. Res., 9 (1979) 473.
15. S.M. Clark, G.R. Morrison and W.D. Shi, Cem. Conc. Res., 29 (1999)1099.
16. R. Rixom and N. Mailvaganam in “Chemical Admixtures for Concrete”, 3rd Ed., (E. & F.N. Spon, London, 1999), p300.
Figure 1: Measured conduction calorimetry data (solid and dotted solid lines) and time
derivatives (dashed lines) for tricalcium silicate and OPC. A: Tricalcium silicate hydration. B: OPC hydration. C and D: Close-ups at the time of peak 2 of A and B respectively, with the dots indicating individual experimental data points.
Time (hours) 0 10 20 30 40 H eat Flow , P (mW/g) 0 1 2 3 4 5 6 7 dP/d t (m W/g-s ) -4.0e-4 -2.0e-4 0.0 2.0e-4 4.0e-4 6.0e-4
Heat Flow (left axis) Time Derivative (right axis)
1 2 2 3 3 Figure 1A
Time (hours) 0 10 20 30 40 Heat Flow, P (mW/g) 0 1 2 3 4 dP/ dt (mW/ s) -1.5e-4 -1.0e-4 -5.0e-5 0.0 5.0e-5 1.0e-4 1.5e-4 2.0e-4 2.5e-4
Heat Flow (left axis) Time derivative (right axis)
1 1 2 2 3 3 4 4 5 5 Figure 1B
Time (hours) 2.0 2.5 3.0 3.5 4.0 Heat Flow, P (mW/ g) 0.0 0.2 0.4 0.6 0.8 1.0 dP/dt (mW/g-s) 0.0 5.0e-5 1.0e-4 1.5e-4 2.0e-4 2.5e-4 3.0e-4
Heat Flow (left axis) Time Derivative (right axis)
I
II
Time (hours) 1.0 1.5 2.0 2.5 3.0 H eat Flow , P (mW ) 0.25 0.30 0.35 0.40 0.45 0.50 d P /d t (m W/s) -1.00e-4 -5.00e-5 0.00 5.00e-5 1.00e-4 1.50e-4 2.00e-4
Heat Flow (left axis) Time derivative (right axis)
Figure 2: Effect of C3S grain surface area on the size of peak 2.
Time (hours)
0 1 2 3 4 5 6H
e
at
F
low
(mW
/g)
0 2 4 6 8 10 12 14 16 0.88 m2/g 1.33 m2/g 1.47 m2/g 1.86 m2/g 2.27 m2/gFigure 3: Derivative Differential Scanning Calorimetry results for the tricalcium silicate in Figure 1. A: Response during decomposition of calcium hydroxide. Blue lines are before the onset of Peak 2, green during peak 2 and red after peak 2. Results for ½, 1, 2, and 4 hours are not shown for clarity. B: Peak to peak width for calcium hydroxide decomposition curves, measured as the temperature difference between the maximum and minima derivative DSC values in A. The measurements are ±0.5 oC. C: Peak to peak value for calcium hydroxide decomposition, measured as the difference in derivative DSC values between the maximum and minima points for each curve in A. Peak to peak measurements are ±2e-5 oC.
Temperature (oC) 400 420 440 460 derivativ e H e at Flow (W/g-o C) -0.004 -0.003 -0.002 -0.001 0.000 0.001 No hydration 2.5 hours 2.75 hours 2.92 hours 3 hours 3.08 hours 3.5 hours Figure 3A
Time of Hydration (hours) 2.0 2.5 3.0 3.5 4.0 4.5 P e ak Wi dt h ( o C) 0 5 10 15 20 dP/dt (W/g-s) 0.0000 0.0001 0.0002 0.0003 0.0004
derivative DSC (left axis)
derivative Conduction Calorimetry (right axis)
Hydration Time (hours) 2.0 2.5 3.0 3.5 4.0 4.5 derivative H e at Flow (W/g-o C) 1e-5 1e-4 1e-3 1e-2 dP/dt (W/g-s) 0.0000 0.0001 0.0002 0.0003 0.0004
derivative DSC (left axis)
derivative Conduction Calorimetry (right axis)
Figure 4: Cold Field Emission SEM images of unhydrated tricalcium silicate (A) and tricalcium silicate hydrated for 2.5 (B), 2.75 (C), 2.92 (D) and 4 (E) hours.
Figure 4A
Figure 4C