HAL Id: hal-02290902
https://hal.sorbonne-universite.fr/hal-02290902
Submitted on 18 Sep 2019HAL is a multi-disciplinary open access archive for the deposit and dissemination of sci-entific research documents, whether they are pub-lished or not. The documents may come from teaching and research institutions in France or abroad, or from public or private research centers.
L’archive ouverte pluridisciplinaire HAL, est destinée au dépôt et à la diffusion de documents scientifiques de niveau recherche, publiés ou non, émanant des établissements d’enseignement et de recherche français ou étrangers, des laboratoires publics ou privés.
Performance of Microporous Carbon Electrodes for
Supercapacitors: Comparing Graphene with Disordered
Materials
Trinidad Méndez-Morales, Nidhal Ganfoud, Zhujie Li, Matthieu Haefele,
Benjamin Rotenberg, Mathieu Salanne
To cite this version:
Trinidad Méndez-Morales, Nidhal Ganfoud, Zhujie Li, Matthieu Haefele, Benjamin Rotenberg, et al.. Performance of Microporous Carbon Electrodes for Supercapacitors: Comparing Graphene with Disordered Materials. Energy Storage Materials, Elsevier, 2019, 17, pp.88-92. �10.26434/chem-rxiv.7171736.v1�. �hal-02290902�
doi.org/10.26434/chemrxiv.7171736.v1
Performance of Microporous Carbon Electrodes for Supercapacitors:
Comparing Graphene with Disordered Materials
Trinidad Mendez-Morales, Nidhal Ganfoud, Zhujie Li, Matthieu Haefele, Benjamin Rotenberg, Mathieu Salanne
Submitted date: 05/10/2018• Posted date: 05/10/2018
Licence: CC BY-NC-ND 4.0
Citation information: Mendez-Morales, Trinidad; Ganfoud, Nidhal; Li, Zhujie; Haefele, Matthieu; Rotenberg, Benjamin; Salanne, Mathieu (2018): Performance of Microporous Carbon Electrodes for Supercapacitors: Comparing Graphene with Disordered Materials. ChemRxiv. Preprint.
Over the past decades, the specific surface area and the pore size distribution have been identified as the main structural features that govern the performance of carbon-based supercapacitors. As a consequence, graphene nanostructures have been identified as strong candidates for maximizing their capacitance. However, this hypothesis could not be thoroughly tested so far due to the difficulty of synthesizing perfect materials with high pore accesibility and a sufficiently large density. Here we perform molecular simulations of a series of perforated graphene electrodes with single pore sizes ranging from 7 to 10 Angstroms in contact with an adsorbed ionic liquid, and compare the capacitances (using various metrics) to the one obtained with a typical disordered nanoporous carbon. The latter displays better performances, an observation that we explain by analyzing the structure of the liquid inside the pores. It appears that although the smaller pores are responsible for the largest surface charges, larger ones are also necessary to store the counter-ions and avoid the formation of detrimental opposite charges on the carbon. These results rationalize the need for disordered or activated carbon materials to design efficient supercapacitors.
File list
(5)
download file view on ChemRxiv manuscript.pdf (4.21 MiB) download file view on ChemRxiv figure-analyse.pdf (68.53 KiB) download file view on ChemRxiv figures-mass-vol.pdf (30.90 KiB) download file view on ChemRxiv surface-capa.pdf (18.35 KiB) download file view on ChemRxiv figure-snapshots.pdf (4.00 MiB)Performance of Microporous Carbon Electrodes for
Supercapacitors: Comparing Graphene with
Disordered Materials
Trinidad Méndez-Morales,
†,‡Nidhal Ganfoud,
¶Zhujie Li,
†,¶,‡Matthieu Haefele,
†Benjamin Rotenberg,
¶,‡and Mathieu Salanne
∗,†,¶,‡Maison de la Simulation, CEA, CNRS, Univ. Paris-Sud, UVSQ, Université Paris-Saclay, F-91191 Gif-sur-Yvette, France, Réseau sur le Stockage Électrochimique de l’Énergie (RS2E), FR CNRS 3459, France, and Sorbonne Université, CNRS, Physico-chimie des Électrolytes et Nanosystèmes
Interfaciaux, PHENIX, F-75005 Paris, France
E-mail: [email protected]
Abstract
Over the past decades, the specific surface area and the pore size distribution have been identified as the main structural features that govern the performance of carbon-based superca-pacitors. As a consequence, graphene nanostructures have been identified as strong candidates for maximizing their capacitance. However, this hypothesis could not be thoroughly tested so far due to the difficulty of synthesizing perfect materials with high pore accesibility and a sufficiently large density. Here we perform molecular simulations of a series of perforated graphene electrodes with single pore sizes ranging from 7 to 10 Å in contact with an adsorbed ∗To whom correspondence should be addressed
†MDLS ‡RS2E ¶SU
ionic liquid, and compare the capacitances (using various metrics) to the one obtained with a typical disordered nanoporous carbon. The latter displays better performances, an observa-tion that we explain by analyzing the structure of the liquid inside the pores. It appears that although the smaller pores are responsible for the largest surface charges, larger ones are also necessary to store the counter-ions and avoid the formation of detrimental opposite charges on the carbon. These results rationalize the need for disordered or activated carbon materials to design efficient supercapacitors.
Carbon-based supercapacitors are electrochemical devices that store electricity through the adsorption of ions from an electrolyte at the surface of porous electrodes. For decades, the state-of-the-art materials for the latter were mesoporous, i.e. with pore sizes ranging from 2 to 50 nm.1 In this family of materials, the capacitance, which quantifies the charge stored in the electrode as a function of applied voltage, generally correlates with the accessible surface area (ASA): the larger the surface, the larger the capacitance. Thus the relative performances of carbon materials were usually compared by normalizing the capacitance by the ASA. This allowed for example to address the effect of various activation techniques after synthesis.
The use of microporous carbons (with pore sizes distributed below 2 nm)2,3 has deeply im-pacted this field of research.4 It was then shown that the capacitance per unit surface area could be greatly enhanced while keeping the ASA relatively constant, suggesting that other physico-chemical features play an important role. The matching between the pore size and the ionic di-mensions was quickly identified as a key aspect,5and although this picture has now been refined through the use of various theoretical,6,7simulation8,9and in situ experimental techniques,10 it is now widely accepted that the pore size distribution (PSD) of the carbon materials plays a role of utmost importance.11
However, despite these advances, it is still very difficult to predict the performance of a carbon material solely based on its ASA and/or its PSD. In fact, even the experimental determination of these quantities should be subject to caution in micropores. As a consequence, it remains neces-sary to perform lengthy electrochemical testings. This is particularly true for comparing carbons
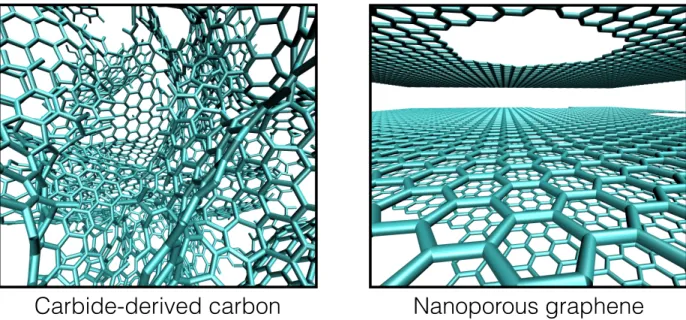
Carbide-derived carbon
Nanoporous graphene
Figure 1: Representative snapshots of the inner structure of the two nanoporous carbon electrodes simulated in this study. In the graphene case, the interlayer spacing is systematically varied be-tween 7 and 10 Å.
with very different textures. It would therefore be highly desirable to develop accurate simula-tion methods that allow to determine the capacitance and to link it to the microscopic charging mechanisms. Here we illustrate this by simulating two types of nanoporous carbons with very different features using molecular dynamics. As shown on representative snapshots on Figure 1, the first system consists in a carbide-derived carbon (CDC) with a highly disordered structure. It was obtained by Palmer et al.12 using quenched molecular dynamics and was shown to match with an experimental structure of a CDC synthesized at 1,200◦C (it will be labelled CDC-1200 in the following). We compare it to a series of highly-ordered nanoporous perforated graphene (PG) electrodes consisting of 6 graphene planes separated by an interlayer distance which was system-atically varied between 7 and 10 Å. Holes were included inside the structure to allow the access of the ions. Graphene was chosen because it has the largest ASA possible for a carbon material, and was therefore investigated as a promising electrode material for supercapacitors.13–16 The elec-trolyte is a pure ionic liquid held at 400 K, the 1-butyl-3-methylimidazolium hexafluorophosphate, which is modelled using a coarse-grained description17validated in the context of electrochemical cells in our previous works.18,19Full supercapacitors are simulated by setting up symmetric cells in
which the electrolyte is put in contact with two similar electrodes. The latter are polarized through the application of a constant potential difference between them. Such simulations were shown to provide capacitances in remarkable agreement with the experimental data for CDC electrodes, not only with ionic liquids,18 but also with organic electrolytes20 or aqueous solutions.21
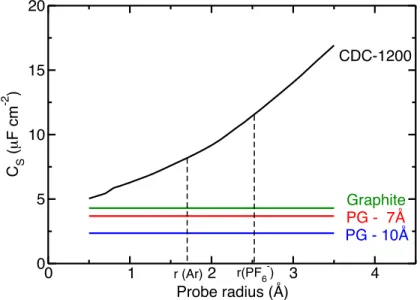
0 1 2 3 4 Probe radius (Å) 0 5 10 15 20 C S ( µ F cm -2 ) CDC-1200 Graphite PG - 7Å PG - 10Å r (Ar) r(PF6-)
Figure 2: The ASA is not a well defined quantity for comparing the performances of materials with different pore size distributions and surface topologies. Surfacic capacitance of the various nanoporous carbon materials are shown as a function of the size of the probe used to calculate the ASA. The value for graphite is also provided for comparison.
The (non-normalized) single electrode capacitance of the simulated supercapacitor is given by
C= 2hQ+i
∆Ψ (1)
where hQ+i is the average charge of the positive electrode over the full simulation and the factor
2 arises by assuming that the potential drop across the double-layer is the same for both electrodes (hence, ∆Ψ/2). However, this capacitance cannot be compared directly between systems since the CDC and the nanoporous graphenes have different ASA, mass and volume. In a first step, we try to normalize it by calculating the ASA. In principle, this should more easily be done in simulations than in experiments since we have access to the exact molecular structure. We use the software Zeo++,22,23 in which the only required parameter is a probe size. The ASA was systematically
determined for sizes ranging between 0.5 and 3.5 Å, which encompass the estimated values for the probes used in adsorption experiments (such as argon) and for the ions of our electrolyte. Figure 2 clearly demonstrates that whatever the probe, the CDC always outperforms the PGs. If we limit the comparison to the argon and PF−6 radii, the CDC surfacic capacitance is larger by factors of 2.2 and 3.1 than the one of the best performing PG (with 7 Å interlayer distance). This result is somewhat unexpected since the latter geometry is supposed to give the best access to the surface while ensuring that the ionic dimensions match with the pore size. However, if we also compare with the case of graphite, for which only one side of the carbon plane is accessible to ions, we immediately see that the capacitance per unit surface area is also higher than the ones of perforated graphenes. 0.7 0.8 0.9 1 ρ (g cm-3) 0 20 40 60 80 100 120 140 Cm (F g -1 ) 9 Å 8 Å 7 Å 10 Å CDC-1200 0.7 0.8 0.9 1 ρ (g cm-3) 0 25 50 75 100 125 150 CV (F cm -3 ) 7 Å 8 Å 9 Å 10 Å CDC-1200
a)
b)
Figure 3: Single-electrode capacitances normalized by the electrode mass (panel a) or volume (panel b).
Before analyzing the origin of these differences in performance at the microscopic scale, it is useful to do additional comparisons with less probe-dependent normalizations, by computing the specific and volumetric capacitances (normalization by the mass and the volume of the electrode, respectively). As shown on Figure 3, in both cases the CDC-based supercapacitor remains the most performant, even though the difference is much less pronounced than when using the ASA for the normalization. The specific capacitance is 30 % larger (130 F g−1 in CDC-1200 compared to 100 F g−1in the nanoporous graphene with pore sizes ranging between 7 and 10 Å). As for the volumetric capacitance (panel b), the high density of the 7 Å PG results in a capacitance similar to
that of CDC (99 F cm−3compared to 112 F cm−3).
-0.02 -0.01 0 0.01 0.02 0.03 0.04 0.05
Capacitance per atom (e V-1)
0.0 0.2 0.4 0.6 0.8 1.0 1.2 1.4 1.6
Fraction of carbon atoms (%)
7 Å 8 Å 9 Å 10 Å CDC-1200 2 3 4 5 6 7 d (Å) 0.0 0.5 1.0 1.5 2.0 2.5 3.0 ρ / ρ pore CDC-1200 - anions CDC-1200 - cations PG - 7Å - anions PG - 7 Å - cations PG - 10Å - cations
a)
b)
Figure 4: a) Distributions of capacitance per atom are given for all the positively charged elec-trodes. b) Ion density profiles normal to the positive electrode surface for CDC-1200 and some of the PG materials (normalized by the total density of the pore).
In order to estimate the effect of the local structure on the capacitance, we compute the distri-bution of capacitance per carbon atom for a positively charged electrode, defined as qi/∆Ψ, where
qi is the local charge carried by a carbon atom, in Figure 4a). Firstly, we observe that the dis-tribution is much more skewed for the CDC than for all the nanoporous graphene electrodes, in agreement with our previous work.18 However the 7 Å wide nanoporous graphene shows a broad distribution, with a relatively large number of highly charged carbon atoms. The reason for its lower performance is therefore to be found in the negative side of the distribution. Contrarily to the CDC, which almost has no negatively charged carbon, the 7 Å distribution exhibits the largest numbers among all the studied electrodes. This is due to the peculiar geometry of the nanoporous graphenes. Since there is only one pore size, anions and cations necessarily lie in the middle of the pore. As shown in our recent study focusing on the structure of the liquid, a monolayer of ions is formed for separations ranging between 7 and 9 Å, but in the 10 Å this monolayer is split in two, leading to two subpeaks with smaller intensities.24 Therefore the cations that still remain inside the pores are very close to the carbon surface and are therefore at the origin of the observed large negative charges in the 7 Å nanoporous graphene. In the CDC electrode, the structure is very different: There are several pore sizes within the material (ranging from 7 Å to 10 Å); this
allows strong reorganizations of the liquid structure. As a consequence, cations tend to move away from the surface and to reside in the middle of the largest pore, so that they do not induce negative charges on the carbon atoms.
This analysis is further corroborated by computing the ionic densities inside the pores, as a function of the distance to the pore wall. As shown in Figure 4b for the positively charged elec-trode, where they are normalized by the total pore density for each species, the distribution of anions is qualitatively similar in the CDC-1200 and the 7 Å PG. On the contrary, while in the graphene the cations share the same layer as the anions (leading to a distribution centered at the same distance to the electrode as for the anions), in the CDC-1200 the cation distribution is much broader, with some surface-cation distances reaching similar values as in the 10 Å nanoporous graphene.
In conclusion, molecular dynamics simulations allow to directly compare the performance of a variety of electrode structure at the same level of description and without the various sources of discrepancies that may be found in experiments (presence of surface groups in the carbons, discrepancies linked to the difficult characterization of nanoporous structures). In this work, by comparing a disordered nanoporous carbon with regular structures made of perforated graphene layers with various interlayer spacings, all of them put in contact with the same ionic liquid, we were able to show the importance of allowing co-ions (i.e. ions of the same sign as the electrode) to adopt positions far from the surface in order to maximize the capacitance. This result reinforces the idea that hierarchical nanoporous structures are (potential) good candidates for supercapacitor applications,25,26not only to allow a faster diffusion of the ions but also to increase the capacitance. On the contrary, too narrow pore size distributions should probably be avoided. Note that these conclusions may not hold in the presence of ionophobic pores, for which the structure of the adsorbed liquid is very different.27–29
Although these findings may be generalized to the case of organic electrolytes for supercapaci-tors (since they generally charge with similar mechanisms as ionic liquids20), further investigation should be performed in the case of aqueous solutions. The latter, which are used for blue
en-ergy / desalination applications,30 involve inorganic ions that are difficult to desolvate, even in nanopores.21This may strongly impact on the structure of the liquid inside perforated graphene electrodes.
Methods
The simulations were carried out within an NVE ensemble at an average temperature of 400 K, which was chosen due to the high viscosity of the 1-butyl-3-methylimidazolium hexafluorophos-phate ionic liquid at room temperature. Indeed, it has been previously shown that the capacitance, shows little changes with increasing the temperature from 298 K to 400 K.31,32 The liquid, com-posed of 4194 or 600 ions pairs (for the PG and CDC simulations, respectively), is represented by means of a coarse-grained model developed by Roy and Maroncelli,17 in which the cations and anions are respectively characterized by 3 and 1 interaction sites. The potential parameters used for the carbon atoms of the electrodes were chosen following Cole and Klein.33 The Lennard-Jones parameters for dissimilar atoms were computed using the Lorentz-Berthelot mixing rules.
PG electrodes are composed of 21245 carbon atoms distributed into six fixed graphene layers. The five inner layers are randomly perforated with round 10 Å-radius holes (2 per layer) in order to allow the entrance of the liquid into the porous electrodes with fast charging and discharging rates.34Four distances between consecutive graphene layers (7, 8, 9 and 10 Å) were simulated. For the CDC-1200, the structure obtained by Palmer et al. using quenched molecular dynamics12was used. Periodic boundary conditions are applied along two directions, and electrostatic interactions are calculated employing a two-dimensional Ewald summation.35 The simulations were carried out by holding the electrodes at constant applied potential between the electrodes according to the model of Siepmann and Sprik.36
The systems were first equilibrated at constant charge during 500 ps, where the charge of the electrodes was fixed at 0. Then we performed a second equilibration of 500 ps, in which the charges of the carbon atoms were set to +0.01e and −0.01e in the left and the right electrodes, respectively.
We then carried out production runs (with a time step of 2 fs) for around 1.3 ns using the constant applied potential method. Since this applied potential cannot be chosen by calculating the Poisson potential across the cell for the constant charge runs,37 we performed several short simulations with different starting potentials and we chose the one for which the total charge on the electrodes showed to be nearly constant: This yielded values of ∆Ψ =1 V for the CDC electrode, 1.8 V for the PGs with pore sizes ranging from 7 to 9 Å and 2.7 V for the PG with 10 Å spacing between the planes. All the comparisons are thus performed for almost similar electrode charges, which is more meaningful since the ionic charge excess is then identical.
Acknowledgements
This work was supported by the French National Research Agency (Labex STORE-EX, Grant No. ANR-10-LABX-0076 and ANR SELFIE, Grant No. ANR-17-ERC2-0028) and by Defi CNRS INPHYNITI 2015-2016 (SIMELEC). We acknowledge support from EoCoE, a project funded by the European Union Contract No. H2020-EINFRA-2015-1-676629, from the DSM-énergie programme of CEA and from the Eurotalent programme. We acknowledge financial support from the Ville de Paris (Emergences, project Blue Energy). This project has received funding from the European Research Council (ERC) under the European Union’s Horizon 2020 research and innovation programme (grant agreement No. 771294). This work was granted access to the HPC resources of CINES under the allocation 2018–A0040910463 made by GENCI.
References
1. Simon, P.; Gogotsi, Y. Materials for Electrochemical Capacitors. Nat. Mater. 2008, 7, 845– 854.
2. Chmiola, J.; Yushin, G.; Gogotsi, Y.; Portet, C.; Simon, P.; Taberna, P. L. Anomalous Increase in Carbon Capacitance at Pore Sizes Less Than 1 Nanometer. Science 2006, 313, 1760–1763.
3. Raymundo-Piñero, E.; Kierzek, K.; Machnikowski, J.; Béguin, F. Relationship Between the Nanoporous Texture of Activated Carbons and Their Capacitance Properties in Different Elec-trolytes. Carbon 2006, 44, 2498–2507.
4. Salanne, M.; Rotenberg, B.; Naoi, K.; Kaneko, K.; Taberna, P.-L.; Grey, C. P.; Dunn, B.; Si-mon, P. Efficient Storage Mechanisms for Building Better Supercapacitors. Nat. Energy 2016, 1, 16070.
5. Largeot, C.; Portet, C.; Chmiola, J.; Taberna, P. L.; Gogotsi, Y.; Simon, P. Relation Between the Ion Size and Pore Size for an Electric Double-Layer Capacitor. J. Am. Chem. Soc. 2008, 130, 2730–2731.
6. Kondrat, S.; Kornyshev, A. A. Superionic State in Double-Layer Capacitors with Nanoporous Electrodes. J. Phys.: Condens. Matter 2011, 23, 022201.
7. Kondrat, S.; Perez, C. R.; Presser, V.; Gogotsi, Y.; Kornyshev, A. A. Effect of Pore Size and its Dispersity on the Energy Storage in Nanoporous Supercapacitors. Energy Environ. Sci. 2012, 5, 6474–6479.
8. Jiang, D.-E.; Jin, Z.; Wu, J. Oscillation of Capacitance inside Nanopores. Nano Lett. 2011, 11, 5373–5377.
9. Feng, G.; Cummings, P. T. Supercapacitor Capacitance Exhibits Oscillatory Behavior as a Function of Nanopore Size. J. Phys. Chem. Lett. 2011, 2, 2859–2864.
10. Galhena, D. T. L.; Bayer, B. C.; Hofmann, S.; Amaratunga, G. A. J. Understanding Capac-itance Variation in Sub-Nanometer Pores by In-Situ Tuning of Interlayer Constrictions. ACS Nano2016, 10, 747–754.
11. Jäckel, N.; Simon, P.; Gogotsi, Y.; Presser, V. Increase in Capacitance by Subnanometer Pores in Carbon. ACS Energy Lett. 2016, 1, 1262–1265.
12. Palmer, J. C.; Llobet, A.; Yeon, S.-H.; Fisher, J. E.; Shi, Y.; Gogotsi, Y.; Gubbins, K. E. Modeling the Structural Evolution of Carbide-Derived Carbons Using Quenched Molecular Dynamics. Carbon 2010, 48, 1116–1123.
13. Stoller, M.; Park, S.; Zhu, Y.; An, J.; Ruoff, R. Graphene-Based Ultracapacitors. Nano. Lett. 2008, 8, 3498–3502.
14. Zhu, R.; Murali, S.; Stoller, M. D.; Ganesh, K. J.; Cai, W.; Ferreira, P. J.; Pirkle, A.; Wal-lace, R. M.; Cychosz, K. A.; Thommes, M. et al. Carbon-Based Supercapacitors Produced by Activation of Graphene. Science 2011, 332, 1537–1541.
15. Tsai, W.-Y.; Lin, R.; Murali, S.; Zhang, L. L.; McDonough, J. K.; Ruoff, R. S.; Taberna, P.-L.; Gogotsi, Y.; Simon, P. Outstanding Performance of Activated Graphene Based Supercapacitors in Ionic Liquid Electrolyte from -50 to 80 C. Nano Ener. 2013, 2, 403–411.
16. Wang, L. J.; El-Kady, M. F.; Dubin, S.; Hwang, J. Y.; Shao, Y.; Marsh, K.; McVerry, B.; Kowal, M. D.; Mousavi, M. F.; Kaner, R. B. Flash Converted Graphene for Ultra-High Power Supercapacitors. Adv. Ener. Mat 2015, 5, 1500786.
17. Roy, D.; Maroncelli, M. An Improved Four-Site Ionic Liquid Model. J. Phys. Chem. B 2010, 114, 12629–12631.
18. Merlet, C.; Rotenberg, B.; Madden, P. A.; Taberna, P.-L.; Simon, P.; Gogotsi, Y.; Salanne, M. On the Molecular Origin of Supercapacitance in Nanoporous Carbon Electrodes. Nat. Mater. 2012, 11, 306–310.
19. Merlet, C.; Salanne, M.; Rotenberg, B. New Coarse-Grained Models of Imidazolium Ionic Liquids for Bulk and Interfacial Molecular Simulations. J. Phys. Chem. C 2012, 116, 7687– 7693.
20. Burt, R.; Breitsprecher, K.; Daffos, B.; Taberna, P.-L.; Simon, P.; Birkett, G.; Zhao, X. S.; Holm, C.; Salanne, M. Capacitance of Nanoporous Carbon-Based Supercapacitors Is a
Trade-Off between the Concentration and the Separability of the Ions. J. Phys. Chem. Lett. 2016, 7, 4015–4021.
21. Simoncelli, M.; Ganfoud, N.; Sene, A.; Haefele, M.; Daffos, B.; Taberna, P.-L.; Salanne, M.; Simon, P.; Rotenberg, B. Blue Energy and Desalination with Nanoporous Carbon Elec-trodes: Capacitance from Molecular Simulations to Continuous Models. Phys. Rev. X 2018, 8, 021024.
22. Willems, T. F.; Rycroft, C. H.; Kazi, M.; Meza, J. C.; Haranczyk, M. Algorithms and Tools for High-Throughput Geometry-Based Analysis of Crystalline Porous Materials. Microporous and Mesoporous Materials2012, 149, 134–141.
23. Martin, R. L.; Smit, B.; Haranczyk, M. Addressing Challenges of Identifying Geometrically Diverse Sets of Crystalline Porous Materials. J. Chem. Inform. Model. 2012, 52, 308–318. 24. Mendez-Morales, T.; Burbano, M.; Haefele, M.; Rotenberg, B.; Salanne, M. Ion–Ion
Correla-tions Across and Between Electrified Graphene Layers. J. Chem. Phys. 2018, 148, 193812. 25. Niu, Z.; Niu, L.; Zhang, L.; Zhou, W.; Chen, X.; Xie, S. Programmable Nanocarbon-Based
Architectures for Flexible Supercapacitors. Adv. Ener. Mater. 2015, 5, 1500677.
26. Lv, Z.; Tang, Y.; Zhu, Z.; Wei, J.; Li, W.; Xia, H.; Jiang, Y.; Liu, Z.; Luo, Y.; Ge, X. et al. Honeycomb Lantern-inspired Three-dimensional Stretchable Supercapacitors with Enhanced Specific Areal Capacitance. Adv. Mater. 2018, 30, 1805468.
27. Kondrat, S.; Wu, P.; Qiao, R.; Kornyshev, A. A. Accelerating Charging Dynamics in Sub-nanometre Pores. Nat. Mater. 2014, 13, 387–393.
28. Kondrat, S.; Kornyshev, A. Pressing a spring: what does it take to maximize the energy storage in nanoporous supercapacitors? Nanoscale Horiz. 2016, 1, 45–52.
29. Lee, A. A.; Vella, D.; Goriely, A.; Kondrat, S. Capacitance-Power-Hysteresis Trilemma in Nanoporous Supercapacitors. Phys. Rev. X 2016, 6, 021034.
30. Siria, A.; Poncharal, P.; Biance, A.-L.; Fulcrand, R.; Blase, X.; Purcell, S. T.; Bocquet, L. Giant Osmotic Energy Conversion Measured in a Single Transmembrane Boron Nitride Nanotube. Nature2013, 494, 455–458.
31. Feng, G.; Li, S.; Atchison, J. S.; Presser, V.; Cummings, P. T. Molecular Insights into Carbon Nanotube Supercapacitors: Capacitance Independent of Voltage and Temperature. J. Phys. Chem. C2013, 117, 9178–9186.
32. Vatamanu, J.; Xing, L.; Li, W.; Bedrov, D. Influence of temperature on the capacitance of ionic liquid electrolytes on charged surfaces. Phys. Chem. Chem. Phys. 2014, 16, 5174–5182. 33. Cole, M. W.; Klein, J. R. The Interaction Between Noble Gases and the Basal Plane Surface
of Graphite. Surf. Sci. 1983, 124, 547–554.
34. Hu, Z.; Vatamanu, J.; Borodin, O.; Bedrov, D. A Comparative Study of Alkylimidazolium Room Temperature Ionic Liquids with FSI and TFSI Anions near Charged Electrodes. Elec-trochim. Acta2014, 145, 40–52.
35. Reed, S. K.; Lanning, O. J.; Madden, P. A. Electrochemical Interface Between an Ionic Liquid and a Model Metallic Electrode. J. Chem. Phys. 2007, 126, 084704.
36. Siepmann, J. I.; Sprik, M. Influence of Surface-Topology and Electrostatic Potential on Water Electrode Systems. J. Chem. Phys. 1995, 102, 511–524.
37. Pean, C.; Daffos, B.; Merlet, C.; Rotenberg, B.; Taberna, P.-L.; Simon, P.; Salanne, M. Single Electrode Capacitances of Porous Carbons in Neat Ionic Liquid Electrolyte at 100◦C: A Com-bined Experimental and Modeling Approach. J. Electrochem. Soc. 2015, 162, A5091–A5095.
Graphical TOC Entry
download file view on ChemRxiv
-0.02 -0.01 0 0.01 0.02 0.03 0.04 0.05 Capacitance per atom (e V-1)
0.0 0.2 0.4 0.6 0.8 1.0 1.2 1.4 1.6
Fraction of carbon atoms (%)
7 Å 8 Å 9 Å 10 Å CDC-1200 2 3 4 5 6 7
d (Å)
0.0 0.5 1.0 1.5 2.0 2.5 3.0ρ
/
ρ
pore CDC-1200 - anions CDC-1200 - cations PG - 7Å - anions PG - 7 Å - cations PG - 10Å - cationsa)
b)
download file view on ChemRxiv
0.7 0.8 0.9 1 ρ (g cm-3) 0 20 40 60 80 100 120 140 C m (F g -1 ) 9 Å 8 Å 7 Å 10 Å CDC-1200 0.7 0.8 0.9 1 ρ (g cm-3) 0 25 50 75 100 125 150 C V (F cm -3 ) 7 Å 8 Å 9 Å 10 Å CDC-1200
a)
b)
download file view on ChemRxiv
0
1
2
3
4
Probe radius (Å)
0
5
10
15
20
C
S
(
µ
F cm
-2
)
CDC-1200
Graphite
PG - 7Å
PG - 10Å
r (Ar)
r(PF
6
-
)
download file view on ChemRxiv
download file view on ChemRxiv