Publisher’s version / Version de l'éditeur:
Journal of the American Chemical Society, 133, 3, pp. 527-546, 2010-12-23
READ THESE TERMS AND CONDITIONS CAREFULLY BEFORE USING THIS WEBSITE. https://nrc-publications.canada.ca/eng/copyright
Vous avez des questions? Nous pouvons vous aider. Pour communiquer directement avec un auteur, consultez la première page de la revue dans laquelle son article a été publié afin de trouver ses coordonnées. Si vous n’arrivez pas à les repérer, communiquez avec nous à [email protected].
Questions? Contact the NRC Publications Archive team at
[email protected]. If you wish to email the authors directly, please see the first page of the publication for their contact information.
NRC Publications Archive
Archives des publications du CNRC
This publication could be one of several versions: author’s original, accepted manuscript or the publisher’s version. / La version de cette publication peut être l’une des suivantes : la version prépublication de l’auteur, la version acceptée du manuscrit ou la version de l’éditeur.
For the publisher’s version, please access the DOI link below./ Pour consulter la version de l’éditeur, utilisez le lien DOI ci-dessous.
https://doi.org/10.1021/ja108181y
Access and use of this website and the material on it are subject to the Terms and Conditions set forth at
Interaction tensors and local dynamics in common structural motifs of
nitrogen: a solid-state 14N NMR and DFT study
O’Dell, Luke A.; Schurko, Robert W.; Harris, Kristopher J.; Autschbach,
Jochen; Ratcliffe, Christopher I.
https://publications-cnrc.canada.ca/fra/droits
L’accès à ce site Web et l’utilisation de son contenu sont assujettis aux conditions présentées dans le site LISEZ CES CONDITIONS ATTENTIVEMENT AVANT D’UTILISER CE SITE WEB.
NRC Publications Record / Notice d'Archives des publications de CNRC:
https://nrc-publications.canada.ca/eng/view/object/?id=0d680ad1-59a2-4baf-b66f-17dd1c34eeda https://publications-cnrc.canada.ca/fra/voir/objet/?id=0d680ad1-59a2-4baf-b66f-17dd1c34eeda
Interaction Tensors and Local Dynamics in Common Structural
Motifs of Nitrogen: A Solid-State
14N NMR and DFT Study
Luke A. O’Dell,*,†Robert W. Schurko,‡Kristopher J. Harris,‡Jochen Autschbach,§and Christopher I. Ratcliffe†
Steacie Institute for Molecular Sciences, National Research Council, 100 Sussex DriVe, Ottawa, K1A 0R6 Ontario, Canada, Department of Chemistry, UniVersity of Windsor, 401 Sunset AVenue, Windsor, N9B 3P4 Ontario, Canada, and Department of Chemistry, 312 Natural
Sciences Complex, State UniVersity of New York at Buffalo, Buffalo, New York 14260-3000, United States
Received September 10, 2010; E-mail: [email protected]
Abstract:14N solid-state NMR powder patterns have been obtained at high field (21.1 T) using broadband, frequency-swept pulses and a piecewise acquisition method. This approach allowed the electric field gradient (EFG) tensor parameters to be obtained from model organic and inorganic systems featuring spherically asymmetric nitrogen environments (CQvalues of up to ca. 4 MHz). The advantages and limitations of this experimental approach are discussed, and the observation of14N T
2relaxation anisotropy in certain systems is also reported, which can shed light on dynamic processes, allowing motional geometries and jump rates to be probed. In particular, we show that observable effects of dynamics on14N spectra can be mediated by modulation of either the EFG tensor or heteronuclear dipolar couplings. It is demonstrated that the QCPMG protocol can be used to selectively enhance certain types of nitrogen environments on the basis of differences in T2. We also present the results of extensive density functional theory calculations on these systems, which show remarkably good correlation with the experimental results and allow the prediction of tensor orientations, assignment of parameters to crystallographic sites, and a rationalization of the origin of the EFG tensors in terms of contributions from individual molecular orbitals. This work demonstrates that ultra-wideline14N solid-state NMR can, under favorable circumstances, be a straightforward, useful, and informative probe of molecular structure and dynamics.
1. Introduction
The importance and ubiquity of nitrogen in chemistry, biochemistry, and materials science cannot be overstated; however, despite its very high natural abundance (99.63%),14N
is not commonly studied by solid-state nuclear magnetic resonance (NMR). This is primarily due to its electric quadru-pole moment (eQ ) 20.44 mb, 1 mb ) 1 × 10-31
m2),1which
couples to a surrounding electric field gradient (EFG), resulting in significant perturbations to the Zeeman transition frequencies. For powder samples, this translates to an anisotropic broadening of the spectral line shape for each distinct nitrogen environment. The integer spin number of14N (I ) 1) means that both Zeeman
transitions are perturbed by this quadrupolar interaction (QI) to first-order. Even for relatively small EFGs (caused primarily by deviations from spherical symmetry in the local electronic environment), powder patterns can be broadened far beyond the excitation and detection limits of standard NMR hardware, and linewidths of several MHz are common. The size of the QI is usually denoted by the quadrupolar coupling constant CQ,
which typically ranges from 0 to ∼5 MHz for14N, the static
powder patterns having widths of ca. 1.5CQ at all fields. As
well as causing experimental bandwidth issues, the dispersion
of the NMR signal across such a wide frequency range is detrimental to the sensitivity, which is already relatively poor due to the low gyromagnetic ratio of14N (1.93 × 10⁷rad T-1
s-1). Finally, since the chemical shift range of nitrogen (ca. 1300
ppm, or 85 kHz at 21.1 T) is generally far narrower than the quadrupolar broadening, spectral overlap can be highly prob-lematic for samples featuring multiple nitrogen environments. Considering both the significance of nitrogen and the unique advantages offered by solid-state NMR (such as the ability to probe disordered environments, measure bond distances and angles, and quantify dynamic processes), it is not surprising that much effort has been put into developing new solid-state NMR techniques that can make use of the 14N isotope. For
example, recently introduced heteronuclear correlation experi-ments can provide excellent resolution of different nitrogen sites as well as measurement of quadrupolar parameters,2-5though
obviously this approach is limited to samples where such strongly coupled “spy” nuclei are available, and analysis of the resultant spectra is not straightforward. Overtone spectroscopy, the direct excitation and detection of the +1 T -1 transition,
†Steacie Institute for Molecular Sciences. ‡University of Windsor.
§State University of New York at Buffalo. (1) Pyykko¨, P. Mol. Phys. 2001, 99, 1617.
(2) Gan, Z. J. Am. Chem. Soc. 2006, 128, 6040.
(3) Cavadini, S.; Lupulescu, A.; Antonijevic, S.; Bodenhausen, G. J. Am.
Chem. Soc. 2006, 128, 7706.
(4) Cavadini, S. Prog. Nucl. Magn. Reson. Spectrosc. 2010, 56, 46.
can dramatically reduce spectral widths and improve resolution;6,7
however, the excitation of this transition is inefficient, and powder line shapes can be difficult to model. Magic-angle spinning (MAS) can improve spectral resolution, provided that the magic angle is precisely set and the spinning speed is very stable.8To quantify anisotropic interactions such as the QI or the chemical shift/shielding anisotropy (CSA), however, a broad manifold of spinning sidebands must be acquired and simulated, which is possible only for CQj1 MHz due to experimental
bandwidth limitations.9-13 14N NMR experiments on single crystals14or oriented systems15,16are a possibility when such
samples are available, but in order to measure CQ values
exceeding 1 MHz from powder samples, acquisition of the ultra-wide-line static powder pattern remains the most straightforward approach. The limited excitation and detection bandwidths of a typical NMR experiment can be overcome by stepping the transmitter frequency and recording the spectrum in a piecewise fashion. Such an approach was combined with slow sample rotation (RotIsseRIe)17to record one-half of the 14N powder
pattern from silicon nitride (CQ≈ 2.1 MHz).18However, the
very narrow excitation bandwidth of the spin-echo pulse sequence used in this study makes such an approach very time-consuming. Large CQ values may also be measured at fixed
transmitter frequencies using the STEAMER methodology,19 but the extraction of the EFG parameters from the dephasing curves is not straightforward.
A recently introduced pulse sequence for ultra-wideline NMR has made dramatic improvements in terms of both excitation bandwidth and sensitivity. WURST-QCPMG20combines the broadband excitation and refocusing capabilities21of
frequency-swept wideband, uniform rate, smooth truncation (WURST) pulses22 with the signal enhancement of the quadrupolar
Carr-Purcell-Meiboom-Gill (QCPMG) protocol.23The latter protocol involves a repeating loop containing a refocusing pulse and acquisition window, such that the spin-echo can be recorded many times in each scan (over the full time scale of the transverse relaxation). This experiment has been shown to be the most efficient method available for recording broad central-transition powder patterns from half-integer spin qua-drupolar nuclei such as35Cl,65Cu,71Ga, or91Zr, and it works
just as well on integer spin nuclei such as10B.24,25When this
pulse sequence is applied to14N nuclei with C
Qj1 MHz, an
additional signal enhancement mechanism resulting from the transfer of Zeeman polarization between the two single-quantum transitions can be exploited, an effect given the name direct enhancement of integer spin magnetization (DEISM).26 This approach allowed the acquisition of static14N powder patterns
from various crystalline amino acids27at a moderate magnetic field strength (9.4 T) in much shorter experimental times than those required for a similar study using MAS.13While15N NMR
(on isotopically enriched samples) remains the easiest way to extract isotropic shifts and CSA parameters, the14N
WURST-QCPMG approach has the advantage of allowing fast and accurate characterization of the EFG tensor and (as we will show) is essentially unlimited in terms of the size of the CQ
that can be measured. The EFG tensor is extremely sensitive to the local electronic environment, particularly intermolecular interactions such as hydrogen bonding; thus, this technique can potentially provide important insight into the local structure at the nitrogen site. It has also very recently been shown that ultra-wide-line 14N powder patterns are sensitive to molecular
dynamics which modulate the EFG tensor on a time scale similar to CQ
-1
.28
Herein, we describe the use of the WURST-QCPMG pulse sequence at 21.1 T to characterize the 14N EFG tensors in a
variety of common structural motifs of nitrogen. Various model organic and inorganic compounds with CQvalues of up to 4
MHz are studied. While spectral overlap remains an important problem for samples featuring multiple nitrogen sites, we will show that it is possible to distinguish sites with very similar EFG tensor parameters by this method. It is also shown that structural dynamics and relaxation anisotropy can play a crucial role in determining the nature of the14N spectrum. We further
develop the potential of ultra-wideline14N NMR as a probe of
motional processes in solids by showing that local dynamics can affect the14N line shape via orientational dependencies of
N-H dipolar couplings, even when the EFG tensor remains unaltered. Variations in relaxation between different nitrogen environments can also be exploited by the QCPMG protocol to provide a means to preferentially select sites with slower relaxation rates.
We have also conducted extensive density functional theory (DFT) calculations on these systems using various methodolo-gies in order to (1) test the reliability of such calculations in application to 14N NMR, (2) confirm experimental
measure-ments, (3) probe the nuclear shielding tensors and their orientations relative to the EFGs and the molecular frame, (4) assign interaction parameters and spectral features to crystal-lographic sites where possible, and (5) rationalize the origin of the EFG tensors in terms of contributions from individual molecular orbitals.
The paper is organized as follows: Section 2 outlines the experimental details, tensor conventions, and computational methods. Section 3 presents the14N NMR spectra obtained and
discusses the results in light of plane-wave DFT calculations, molecular dynamics, and relaxation effects. Section 4 presents
(6) Bloom, M.; LeGros, M. A. Can. J. Phys. 1986, 64, 1522.
(7) Tycko, R.; Opella, S. J. J. Chem. Phys. 1987, 86, 1761.
(8) Jakobsen, H. J.; Hove, A. R.; Bildsøe, H.; Skibsted, J.; Brorson, M.
J. Magn. Reson. 2007, 185, 159.
(9) Jeschke, G.; Jansen, M. Angew. Chem., Int. Ed. 1998, 37, 1282.
(10) Ermolaev, K.; Fung, B. M. J. Chem. Phys. 1999, 110, 7977.
(11) Jakobsen, H. J.; Bildsøe, H.; Skibsted, J.; Giavani, T. J. Am. Chem.
Soc. 2001, 123, 5098.
(12) Giavani, T.; Bildsøe, H.; Skibsted, J.; Jakobsen, H. J. Chem. Phys.
Lett. 2003, 377, 426.
(13) Giavani, T.; Bildsøe, H.; Skibsted, J.; Jakobsen, H. J. J. Magn. Reson.
2004, 166, 262.
(14) Whitehouse, B. A.; Ray, J. D.; Royer, D. J. J. Magn. Reson. 1969, 1, 311–326.
(15) Ramamoorthy, A.; Lee, D.-K.; Santos, J. S.; Henzler-Wildman, K. A.
J. Am. Chem. Soc. 2008, 130, 11023.
(16) Qian, C.; Fu, R.; Gor’kov, P.; Brey, W. W.; Cross, T. A.; Gan, Z. J.
Magn. Reson. 2009, 196, 96.
(17) Hill, E. A.; Yesinowski, J. P. J. Am. Chem. Soc. 1996, 118, 6798.
(18) Yesinowski, J. P.; Hill, E. A. Solid State NMR Spectroscopy of
Inorganic Materials; American Chemical Society Symposium Series
717; American Chemical Society: Washington, DC, 1999; p 358. (19) Hill, E. A.; Yesinowski, J. P. J. Chem. Phys. 1999, 106, 8650.
(20) O’Dell, L. A.; Schurko, R. W. Chem. Phys. Lett. 2008, 464, 97.
(21) Bhattacharyya, R.; Frydman, L. J. Chem. Phys. 2007, 127, 194503.
(22) Kupcˇe, E.; Freeman, R. J. Magn. Reson. A 1995, 115, 273.
(23) Larsen, F. H.; Jakobsen, H. J.; Ellis, P. D.; Nielsen, N. C. J. Phys.
Chem. A 1997, 101, 8597.
(24) Tang, J. A.; O’Dell, L. A.; Aguiar, P. M.; Lucier, B. E. G.; Sakellariou, D.; Schurko, R. W. Chem. Phys. Lett. 2008, 466, 227.
(25) O’Dell, L. A.; Rossini, A. J.; Schurko, R. W. Chem. Phys. Lett. 2009,
468, 330.
(26) O’Dell, L. A.; Schurko, R. W. J. Am. Chem. Soc. 2009, 131, 6658.
(27) O’Dell, L. A.; Schurko, R. W. Phys. Chem. Chem. Phys. 2009, 11, 7069.
DFT calculations conducted on single molecules and finite-sized clusters, as well as molecular orbital analyses of the EFG tensors in three of the model systems. Finally, Section 5 summarizes the key conclusions.
2. Experimental Details
2.1. Sample Preparation.Three dicyanobenzene samples (1,2-, 1,3-, and 1,4-), urea-d4, imidazole, and melamine were purchased
from Sigma-Aldrich and used without further purification. The hydrazine dihydrochloride sample (BDH Chemicals) was recrystal-lized from an aqueous solution acidified with dilute hydrochloric acid. For the silicon nitride sample, an empty 4.0 mm Bruker MAS NMR rotor was used. All samples (excluding the silicon nitride rotor) were finely ground before being packed into 7.0 mm outer-diameter, thin-wall zirconia NMR rotors.
2.2. NMR Experiments and Tensor Conventions. All 14N
NMR experiments were carried out at 21.1 T (νL)65.03 MHz)
using a Bruker Avance II console and a 7.0 mm HX static probe built in-house (National Ultra-High Field NMR Facility for Solids, Ottawa). The WURST-QCPMG pulse sequence was used with eight-step phase cycling20,29and 50µs WURST-80 pulses swept
over a range of 1.0 MHz, resulting in an excitation bandwidth of approximately 850 kHz. The optimum RF power for the WURST pulses was experimentally determined asν1≈ 30 kHz. For samples
containing protons, continuous-wave1H decoupling ofν
2≈ 15 kHz
power was applied for the duration of each scan. The decoupling power was limited by the long acquisition times employed in the WURST-QCPMG experiments (tens of milliseconds), and the protons would not be expected to be fully decoupled in most cases. We have found that more advanced heteronuclear decoupling methods such as TPPM or SPINAL provide very little improvement over CW in these particular experiments (data not shown). Other experimental details specific to each sample are presented in Table 1. For the silicon nitride sample, the 400 s recycle delay was insufficient to allow the spins to fully relax to thermal equilibrium, so a dummy scan was included for each piece. We note that the DEISM signal enhancement mechanism26is essentially absent from
the spectra reported herein due to the width of the static powder patterns, which vastly exceed the effective bandwidth of the applied WURST pulses. In certain spectra, however, wobble-like distortions near the center may be related to this effect, having been previously observed in both experiment and simulation.26,27All spectra and
calculated shifts are referenced to neat liquid nitromethane at 0.0 ppm.30To obtain chemical shift values referenced to liquid NH
3,
381 ppm should be added to the values reported herein. Spectral processing was carried out using the NUTS software (Acorn NMR). QCPMG trains were split into individual echoes which were co-added prior to Fourier transformation. For experiments denoted as “WURST-echo”, only the first echo was processed, and the remaining echoes were discarded. Since the extraction of
quadru-polar parameters is dependent on precisely locating spectral discontinuities and shoulders, minimal line-broadening was applied. Absorptive spectra were obtained via a magnitude calculation, and complete spectra were reconstructed from the individual pieces via a skyline projection. We have found that, due to the excitation profile of the WURST pulses being approximately rectangular in shape, rather than sinc-like, co-addition of subspectra can often fail to reproduce the true spectral line shape and can give rise to false spectral features if the frequency step size is not carefully chosen. The use of a skyline projection eliminates this issue, provided that the chosen frequency step size is approximately half the excitation bandwidth or less. Herein, we used a step size of 300 kHz in all cases. Experimental EFG parameters were determined by manually fitting simulated powder patterns to the experimental spectra using the Dmfit software,31 with the best fits determined by visual
inspection.
EFG tensors are defined such that the three principal components are ordered |V33| g |V22| g |V11|. The EFG tensor is traceless,
allowing the tensor to be fully described using two quantities: the quadrupolar coupling constant (in MHz), given by CQ)eQV33/h
(where eQ is the quadrupole moment of 14N and h is Planck’s
constant), and the asymmetry parameter, ηQ )(V11-V22)/V33.
Nuclear shielding tensors are defined such that the principal components are orderedσ33gσ22gσ11. The relative orientation
of the EFG and shielding tensors is described by three Euler angles, R, β, and γ, which move the EFG principal axis system into coincidence with the shielding tensor principal axis system via a series of three positive rotations: R about V33, followed byβ around
the new V22direction, and finallyγ about the new V33(the zy′z′′
convention). Experimentally, chemical shifts, rather than shieldings, are measured. We therefore report the calculated shieldings in the form of a chemical shift tensor with principal componentsδ11g
δ22gδ33. Rather than give the values of these principal components,
we use the Herzfeld-Berger (or Maryland) convention32and report
the isotropic shiftδiso)(δ11+δ22+δ33)/3 (in ppm), the span Ω
)δ11 -δ33 (also in ppm), and the skew κ ) 3(δ22 -δiso)/Ω (dimensionless, and ranging from -1.0 to 1.0). Since the calculated isotropic shielding is reported relative to a bare nucleus, the chemical shift of which cannot be measured experimentally, the conversion of calculated shielding parameters to the14N chemical
shift scale was achieved by plotting all calculated isotropic shieldings against experimental isotropic shift values (from the literature) to obtain the linear relationship between them. This plot is shown in Figure 1a and discussed further in section 3.1. Euler angles were determined using EFGShield.33It is worth noting here
that the Euler angleβ always describes the angle between the largest EFG component V33and the most shielded component of the CS
tensor (σ33, or equivalentlyδ33). Whenβ ) 0, the angle between
V22andδ22/σ22is given by the sum of R andγ.
For each sample, only the low-frequency half of the14N NMR
spectrum was acquired, and the remaining half was reconstructed from this by reflection about the isotropic shift value (obtained either from the literature or from DFT calculations). For samples featuring multiple sites, the average of the isotropic shifts was used as the point of reflection. The low-frequency half of the spectrum was chosen for acquisition simply because the tuning range of the probe happened to extend further in that direction. The justification for this strategy is that second-order quadrupolar or CSA effects, which cause departure from symmetry, are of the order of a few tens of kHz in size, which is negligible compared with the widths of the ultra-wideline powder patterns that we present and smaller than the experimental uncertainties in our reported CQvalues. A more quantitative justification is given
(29) Hung, I.; Gan, Z. J. Magn. Reson. 2010, 204, 256.
(30) Harris, R. K.; Becker, E. D.; Cabral de Menezes, S. M.; Goodfellow, R.; Granger, P. Pure Appl. Chem. 2001, 73, 1795.
(31) Massiot, D.; Fayon, F.; Capron, M.; King, I.; Le Calve´, S.; Alonso, B.; Durand, J. O.; Bujoli, B.; Gan, Z.; Hoatson, G. Magn. Reson. Chem.
2002, 40, 70.
(32) Mason, J. Solid State Nucl. Magn. Reson. 1993, 2, 285.
(33) Adiga, S.; Aebi, D.; Bryce, D. L. Can. J. Chem. 2007, 85, 496.
(34) Bak, M.; Rasmussen, J. T.; Nielsen, N. C. J. Magn. Reson. 2000, 147, 296.
Table 1. Experimental Parameters Used To Acquire the
Low-Frequency Half of the14N Powder Patterns at 21.1 T
sample initial frequency offset/kHz pieces echoes acquired scans per piece recycle delay/s total acquisition time/h silicon nitride -400 5 400 8 400 5.3 1,2-dicyanobenzene -300 10 120 200 10 5.6 1,3-dicyanobenzene -400 9 120 200 10 5.0 1,4-dicyanobenzene -400 9 120 200 10 5.0 hydrazine dihydrochloride -100 10 100 120 3 1.0 urea-d4 -400 11 8 400 5 6.1 imidazole -100 8 80 200 10 4.4 melamine -400 6 120 80 60 8.0
in the Supporting Information. Finally, we reiterate that, while the above strategy is advantageous for a determination of the14N EFG
parameters, nitrogen isotropic shifts and CS tensors are more easily studied using alternative techniques, ideally15N NMR spectroscopy
of isotopically enriched samples.
2.3. Simulations of14N NMR Line Shapes in the Presence
of Dynamics.The EXPRESS software35was used within MATLAB
7.10 to simulate the effects of dynamics on the14N NMR spectra of
urea28and imidazole. Dynamics were modeled as Markovian jump
processes at specified jump rates between different EFG tensor orientations determined from DFT calculations and defined using Euler angles and the parameters outlined above. The effects of the CS tensor were neglected. A simulation of the full WURST-QCPMG sequence would be highly computationally demanding due to the phase-modulated nature of the WURST pulses, the long acquisition period, and the large number of crystallite orientations over which the simulations must be averaged. The experiment was therefore modeled as a two-pulse quadrupolar echo sequence with rectangular, mono-chromatic pulses separated by a variable echo delay. The validity of this model has yet to be fully tested, though it has been used previously to obtain jump rates for the molecular flipping mechanism in urea that were in good agreement with those obtained by other, more established techniques.28Powder averaging was conducted over a minimum of
75 000 crystal orientations calculated using the ZCW method, with longer echo delays requiring more orientations to achieve line shape convergence. Simulations took up to several hours to run on a Windows PC, depending primarily on the size of the echo delay used. Simulated FIDs were processed within EXPRESS by shifting to the echo top, with 20-50 Hz exponential apodization applied before Fourier transformation.
2.4. DFT Calculations. Plane-wave DFT calculations were performed using the CASTEP software36-39in the Materials Studio
4.3 software suite. This software employs the gauge-including projec-tor-augmented wave algorithm (GIPAW).36Revised Perdew, Burke,
and Ernzerhof (RPBE) functionals were used with the generalized gradient approximation for the exchange-correlation energy. Plane wave basis set cut-offs and Monkhorst-Pack k-space grid sizes were set automatically under a “fine” basis set accuracy (see Supporting Information for specific values). Where appropriate, proton positions were optimized using a Broyden-Fletcher-Goldfarb-Shanno opti-mization algorithm,40with the lattice parameters and coordinates of
all other atoms fixed. Ultrasoft14N pseudopotentials were used for
the EFG calculations.38The crystal structures used in the CASTEP
calculations were obtained from the following references: silicon nitride,411,2-dicyanobenzene,421,3-dicyanobenzene,43
1,4-dicyanoben-zene,44hydrazine dihydrochloride,45urea,46imidazole,47melamine,48
R-glycine,49lead nitrate,50cubic boron nitride,51and hexagonal boron
nitride.51
DFT calculations of EFG tensors in molecules and finite-size clusters were carried out using revision 2009.01 and a 2010 developer’s version of the Amsterdam Density Functional (ADF)
(35) Vold, R. L.; Hoatson, G. L. J. Magn. Reson. 2009, 198, 57.
(36) Clark, S. J.; Segall, M. D.; Pickard, C. J.; Hasnip, P. J.; Probert, M. J.; Refson, K.; Payne, M. C. Z. Kristallogr. 2005, 220, 567.
(37) Pickard, C. J.; Mauri, F. Phys. ReV. B 2001, 63, 245101.
(38) Profeta, M.; Mauri, F.; Pickard, C. J. J. Am. Chem. Soc. 2003, 125, 541.
(39) Yates, J. R.; Pickard, C. J.; Mauri, F. Phys. ReV. B 2007, 76, 024401.
(40) Pfrommer, B. G.; Cote, M.; Louie, S. G.; Cohen, M. L. J. Comput.
Phys. 1997, 131, 233.
(41) Kohatsu, I.; McCauley, J. W. Mater. Res. Bull. 1974, 9, 917.
(42) Janczak, J.; Kubiak, R. Acta Crystallogr. C 1995, 51, 1399.
(43) Janczak, J.; Kubiak, R. J. Mol. Struct. 2000, 553, 157.
(44) Guth, H.; Heger, G.; Drueck, U. Z. Kristallogr. 1982, 159, 185.
(45) Kruszynski, R.; Trzesowska, A. Acta Crystallogr. E 2007, 63, 179.
(46) Guth, H.; Heger, G.; Klein, S.; Treutmann, W.; Scheringer, C. Z.
Kristallogr. 1980, 153, 237.
(47) Craven, B. M.; McMullan, R. K.; Bell, J. D.; Freeman, H. C. Acta
Crystallogr. B 1977, 33, 2585.
(48) Varghese, J. N.; O’Connell, A. M.; Maslen, E. N. Acta Crystallogr.
B 1977, 33, 2102.
(49) Power, L. F.; Turner, K. E.; Moore, F. H. Acta Crystallogr. B 1976,
32, 11.
(50) Nowotny, H.; Heger, G. Acta Crystallogr. C 1986, 42, 133.
(51) Wyckoff, R. W. G. Crystal Structures, 2nd ed.; Interscience: New York, 1963; p 85.
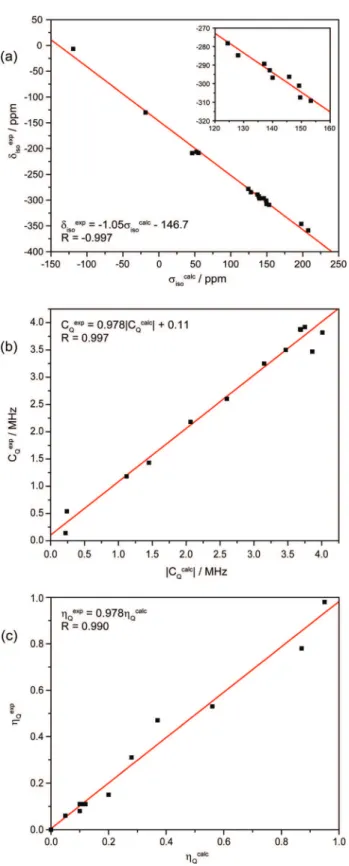
Figure 1. Plots of experimental14N NMR parameters (from this study as
well as from the literature) against plane-wave DFT calculations. (a) Experimental isotropic chemical shifts versus calculated isotropic shieldings (expansion shown inset), (b) quadrupolar coupling constants, and (c) quadrupolar asymmetry parameters.
code.52-54The density functional was composed of the PW9255
local density approximation along with the PBE56exchange and
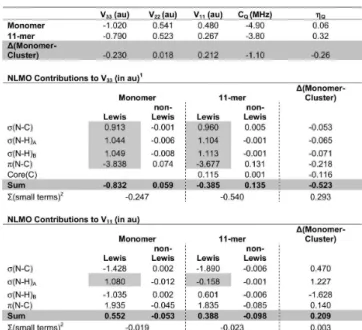
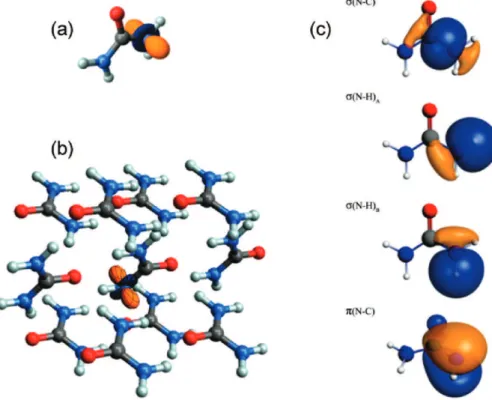
correlation terms. Slater-type basis sets of triple-zeta, doubly polarized quality in the valence region were used for all calculations. Prior to calculation of EFG tensors for all isolated and cluster models, proton positions in diffraction-derived model structures were optimized as described above. A locally modified version of the NBO 5.0 code57 was used to generate natural localized
molecular orbitals (NLMOs), natural bond orbitals (NBOs), and analysis data for EFGs based on these orbital sets. The modifications of NBO include the use an OpenMP parallelization and the use of efficient BLAS routines, allowing the treatment of systems with several thousand basis functions.
3. Results and Discussion
3.1. Reliability of Plane-wave DFT Calculations.Prior to a discussion of the experimental results for each individual sample, it is useful to briefly consider the overall performance of the plane-wave DFT calculations made using CASTEP. All experimental and calculated results are presented in Table 2. As well as the various model compounds for which the14N NMR spectra were
collected, calculations were also run on R-glycine, lead nitrate, and boron nitride (both cubic and hexagonal phases) in order to provide a broader range of interaction parameters over which to compare the experimental and calculated results (14N NMR parameters for
these systems have been published previously).9,11,12,27,58 The
computational results for the three most commonly reported14N
NMR parameters (δiso, CQ, andηQ) are plotted in Figure 1 against
the experimental values (similar plots were not made for the other parameters due to a paucity of experimental data). For the isotropic shifts (Figure 1a), a linear fit resulted in both a correlation coefficient and slope very close to -1.0 (the negative sign arising due to the inverse relationship between nuclear magnetic shielding and chemical shift values), and excellent agreement is achieved over a range of approximately 350 ppm. This plot was used to determine the isotropic chemical shifts for the dicyanobenzenes and hydrazine dihydrochloride samples, about which the experi-mental spectra were reflected.
A similar level of agreement was observed for the quadrupolar coupling constants (Figure 1b) across a range of values from 0 to ∼4 MHz. Both the correlation coefficient and slope are very close to 1.0. We note that the two data points corresponding to urea and hydrazine dihydrochloride each show a significant deviation from the line of best fit (top right corner of the plot). One possible reason for this is that both of these samples are known to exhibit dynamic processes which are not accounted for in the calculations. For the remaining systems, the CASTEP calculations underestimate the14N C
Qvalues by approximately
100 kHz, a systematic error that can be easily corrected for after
the fact. This should be kept in mind when comparing the experimental and calculated CQvalues in Table 2.
The quadrupolar asymmetry parameterηQshows a level of
agreement between experimental and calculated values similar to that observed for CQ (Figure 1c), with the correlation
coefficient and slope both fairly close to unity. It should be noted that the two calculated values of ηQ showing the largest
disagreement with experiment are both from melamine, for which each point represents the average of three distinct crystallographic nitrogen sites that were not well resolved in the experimental spectrum (see section 3.7). The (average) calculated CQvalues for these sites agreed well with
experi-mental values, in contrast to the results forηQ.
3.2. Silicon Nitride. Favorable thermal and mechanical properties make silicon nitride a useful material for the construction of rotors for MAS NMR, as well as numerous engineering applications. The R-Si3N4 crystal structure41
features four distinct nitrogen environments in a 3:3:1:1 ratio. Each site is coordinated to three silicon atoms, with the two less abundant sites (N3 and N4) existing on three-fold symmetry axes. The β-Si3N4 phase59 features two distinct
sites in a 3:1 ratio, also with the less abundant site on a three-fold symmetry axis. Both phases have been previously studied by Harris et al. using15N MAS NMR on enriched samples,60
with isotropic chemical shifts reported for all four sites in R-Si3N4 (see Table 2) and the authors noting very long
spin-lattice relaxation times for15N (ca. 3000 s). Similarly
long relaxation times were also observed in our14N
experi-ments on a silicon nitride NMR rotor, which would most likely consist of a mixture of both phases, the ratio depending on the exact manufacturing conditions.61The effects of long
relaxation times on the WURST-QCPMG experiment are twofold: long T1values mean that lengthy recycle delays must
be used between scans to allow sufficient longitudinal magnetization to be re-established, but long T2values allow
a very large number of echoes to be acquired, thereby boosting the signal obtained from each individual scan. In this instance, the long recycle delay (set arbitrarily at 400 s with the addition of a dummy scan) resulted in a14N NMR
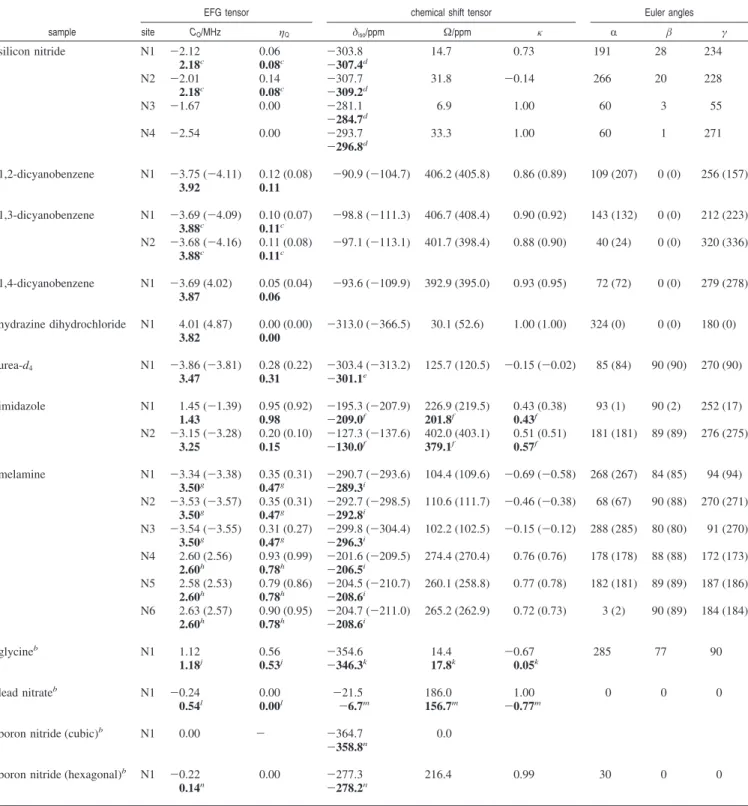
spectrum of relatively poor S/N ratio compared with other spectra obtained in a similar time frame (Figure 2), despite the acquisition of 400 echoes in each scan. The spectrum was fitted using a single line shape with quadrupolar parameters CQ)2.18 MHz andηQ)0.08, values close to
those predicted by plane-wave DFT for sites N1 and N2 in the R-Si3N4structure. The overall quality of this spectrum
is comparable to that reported by Yesinowski and Hill, who were able to use recycle delays much shorter than T1 by
continuously changing the observed nuclei with slow me-chanical rotation of the sample (RotIsseRIe).17The N3 and
N4 sites are predicted to haveηQ)0.00 due to their
three-fold symmetry; thus, their14N powder patterns should have
relatively sharp discontinuities that are separated due to their different CQvalues. However, such features are not visible
in this experimental spectrum. We also note that the presence of β-Si3N4, which has very similar nitrogen environments,
will further complicate the spectrum. In order to resolve these sites in a quantitative fashion, a much longer recycle delay
(52) te Velde, G.; Bickelhaupt, F. M.; van Gisbergen, S. J. A.; Fonseca Guerra, C.; Baerends, E. J.; Snijders, J. G.; Ziegler, T. J. Comput.
Chem. 2001, 22, 931.
(53) Fonseca Guerra, C.; Snijders, J. G.; te Velde, G.; Baerends, E. J. Theor.
Chem. Acc. 1998, 99, 391.
(54) ADF2009.01, SCM, Theoretical Chemistry; Vrije Universiteit, Am-sterdam, The Netherlands, http://www.scm.com.
(55) Perdew, J. P.; Wang, Y. Phys. ReV. B 1992, 45, 13244.
(56) Perdew, J. P.; Burke, K.; Ernzerhof, M. Phys. ReV. Lett. 1996, 77, 3865.
(57) Glendening, E. D.; Badenhoop, J. K.; Reed, A. E.; Carpenter, J. E.; Bohmann, J. A.; Morales, C. M.; Weinhold, F. NBO, 5.0; Theoretical Chemistry Institute, University of Wisconsin: Madison, WI, 2009; http://www.chem.wisc.edu/ nbo5.
(58) Strohmeier, M.; Stueber, D.; Grant, D. M. J. Phys. Chem. A 2003,
107, 7629.
(59) Gru¨n, R. Acta Crystallogr. B 1979, 35, 800.
(60) Harris, R. K.; Leach, M. J.; Thompson, D. P. Chem. Mater. 1990, 2, 320.
(61) Lange, H.; Wo¨tting, G.; Winter, G. Angew. Chem., Int. Ed. Engl. 1991,
would be required to allow for full spin-lattice relaxation, in addition to a greater number of scans to improve the S/N ratio. Due to time limitations, this was not attempted.
The isotropic chemical shifts for the four sites in R-Si3N4
calculated using CASTEP each fall within ca. 4 ppm of the experimental values obtained in the 15N study.60The close
proximity of the experimental shifts reported for the N1 and N2 sites (1.8 ppm difference) means that the assignment of the parameters to those sites in Table 2 is only tentative, but for the N3 and N4 sites the assignment is more convincing. Both the calculated EFG and CS tensors for the N3 and N4 sites are axially symmetric, with the unique components (V33
Table 2. Experimental and Calculated Tensor Parameters and Euler Anglesa
EFG tensor chemical shift tensor Euler angles
sample site CQ/MHz ηQ δiso/ppm Ω/ppm κ R β γ
silicon nitride N1 -2.12 0.06 -303.8 14.7 0.73 191 28 234 2.18c 0.08c -307.4d N2 -2.01 0.14 -307.7 31.8 -0.14 266 20 228 2.18c 0.08c -309.2d N3 -1.67 0.00 -281.1 6.9 1.00 60 3 55 -284.7d N4 -2.54 0.00 -293.7 33.3 1.00 60 1 271 -296.8d 1,2-dicyanobenzene N1 -3.75 (-4.11) 0.12 (0.08) -90.9 (-104.7) 406.2 (405.8) 0.86 (0.89) 109 (207) 0 (0) 256 (157) 3.92 0.11 1,3-dicyanobenzene N1 -3.69 (-4.09) 0.10 (0.07) -98.8 (-111.3) 406.7 (408.4) 0.90 (0.92) 143 (132) 0 (0) 212 (223) 3.88c 0.11c N2 -3.68 (-4.16) 0.11 (0.08) -97.1 (-113.1) 401.7 (398.4) 0.88 (0.90) 40 (24) 0 (0) 320 (336) 3.88c 0.11c 1,4-dicyanobenzene N1 -3.69 (4.02) 0.05 (0.04) -93.6 (-109.9) 392.9 (395.0) 0.93 (0.95) 72 (72) 0 (0) 279 (278) 3.87 0.06 hydrazine dihydrochloride N1 4.01 (4.87) 0.00 (0.00) -313.0 (-366.5) 30.1 (52.6) 1.00 (1.00) 324 (0) 0 (0) 180 (0) 3.82 0.00 urea-d4 N1 -3.86 (-3.81) 0.28 (0.22) -303.4 (-313.2) 125.7 (120.5) -0.15 (-0.02) 85 (84) 90 (90) 270 (90) 3.47 0.31 -301.1e imidazole N1 1.45 (-1.39) 0.95 (0.92) -195.3 (-207.9) 226.9 (219.5) 0.43 (0.38) 93 (1) 90 (2) 252 (17) 1.43 0.98 -209.0f 201.8f 0.43f N2 -3.15 (-3.28) 0.20 (0.10) -127.3 (-137.6) 402.0 (403.1) 0.51 (0.51) 181 (181) 89 (89) 276 (275) 3.25 0.15 -130.0f 379.1f 0.57f melamine N1 -3.34 (-3.38) 0.35 (0.31) -290.7 (-293.6) 104.4 (109.6) -0.69 (-0.58) 268 (267) 84 (85) 94 (94) 3.50g 0.47g -289.3i N2 -3.53 (-3.57) 0.35 (0.31) -292.7 (-298.5) 110.6 (111.7) -0.46 (-0.38) 68 (67) 90 (88) 270 (271) 3.50g 0.47g -292.8i N3 -3.54 (-3.55) 0.31 (0.27) -299.8 (-304.4) 102.2 (102.5) -0.15 (-0.12) 288 (285) 80 (80) 91 (270) 3.50g 0.47g -296.3i N4 2.60 (2.56) 0.93 (0.99) -201.6 (-209.5) 274.4 (270.4) 0.76 (0.76) 178 (178) 88 (88) 172 (173) 2.60h 0.78h -206.5i N5 2.58 (2.53) 0.79 (0.86) -204.5 (-210.7) 260.1 (258.8) 0.77 (0.78) 182 (181) 89 (89) 187 (186) 2.60h 0.78h -208.6i N6 2.63 (2.57) 0.90 (0.95) -204.7 (-211.0) 265.2 (262.9) 0.72 (0.73) 3 (2) 90 (89) 184 (184) 2.60h 0.78h -208.6i glycineb N1 1.12 0.56 -354.6 14.4 -0.67 285 77 90 1.18j 0.53j -346.3k 17.8k 0.05k lead nitrateb N1 -0.24 0.00 -21.5 186.0 1.00 0 0 0 0.54l 0.00l -6.7m 156.7m -0.77m
boron nitride (cubic)b N1 0.00 - -364.7 0.0
-358.8n
boron nitride (hexagonal)b N1 -0.22 0.00 -277.3 216.4 0.99 30 0 0
0.14n -278.2n
aCalculated values are shown in regular type, and experimentally determined values are shown in boldface. Uncertainties in the reported
experimental CQandηQparameters are unique to each value and are not shown but are generally in the region of (0.05 MHz for CQand (0.05 forηQ. Site numbers correspond to crystal structures used (see text). Parentheses indicate quantities calculated from non-optimized structures, adjacent values having been calculated using optimized proton/deuteron positions. Experimental CQvalues give only the absolute values, while calculated values also give the sign. Calculated chemical shifts were derived from isotropic shielding values using the expression given in Figure 1a. The Euler angles describe the orientation of the EFG tensor relative to the chemical shift tensor. bNMR spectra not presented.cAverage of sites N1 and N2. dReference 60. eReference 72.fReference 80.gAverage of sites N1, N2, and N3.hAverage of sites N4, N5, and N6.iReference 96.jReference 27.kReference 58. lReference 11.mReference 12.nReference 9.
andσ33) coincident and oriented parallel to the axis of
three-fold symmetry. For both the N1 and N2 sites, V33 is
perpendicular to the plane made by the three neighboring silicon atoms, whileσ33 is tilted away from V33 by 28° and
20°, respectively.
3.3. Dicyanobenzenes.Despite their increased width, the14N
powder patterns obtained from the three dicyanobenzene samples (Figure 3) show a dramatic improvement in S/N ratio over the silicon nitride spectrum acquired in a similar amount of time (ca. 5 h). This is due to the increased spin-lattice relaxation rate of the14N nuclei in the dicyanobenzenes, which
allowed much shorter recycle delays and hence more scans per unit time, while the transverse (spin-spin) relaxation rates are still slow enough to permit the acquisition of a large number of echoes in each scan. Such conditions are perfectly suited for QCPMG-type experiments, hence the high S/N ratios of the spectra in Figure 3. The increased spin-lattice relaxation efficiency in these samples relative to Si3N4can be attributed
to at least two factors: (1) the less rigid lattice and presence of librational motions, and (2) the presence of protons and concomitant fluctuating N-H dipolar couplings. The reduced intensity at the center of the spectrum of the 1,2-dicyanobenzene (Figure 3a) is due to the transmitter frequency for the first piece acquired being set closer to the isotropic shift (300 kHz offset), resulting in distortions similar to those observed in DEISM simulations published previously.26,27Subsequently, a 400 kHz
offset was found to be sufficient to minimize this distortion while still adequately exciting the central region of the patterns (see other spectra). All three spectra were fitted with single 14N
powder patterns to obtain the quadrupolar parameters reported in Table 2. 1,3-Dicyanobenzene, however, has two distinct crystallographic nitrogen sites, for which plane-wave DFT predicts very similar values for the EFG and CS tensor parameters. In fact, these two sites can be distinguished experimentally if the spectra are recorded using a higher resolution (i.e., a larger number of data points acquired for each echo, which also has the effect of reducing the overall S/N ratio since fewer echoes can be acquired overall). Five out of the six spectral features from the low-frequency half of the spectrum can be resolved in this way (Figure 4). The outermost region of the pattern appears as a single shoulder (Figure 4c), indicating that the two sites have almost identical CQvalues but differ
slightly in ηQ, as the latter parameter has no effect on the
position of the outermost shoulder (a similar effect was also
observed in the static14N NMR spectrum ofL-leucine).27
While the frequency separation of the resolved features in Figure 4a,b is similar in magnitude to the possible effects of CSA or second-order QI discussed in the Supporting Information, both sites in this case are predicted by plane-wave DFT to have very similar EFG and CS tensor parameters and orientations. A simulation of the two full sets of calculated interaction parameters, including first- and second-order QI and CSA (Figure 4d), shows differences in the positions of the spectral features that are in reasonable agreement with the experimental spectra, and the experimental features have therefore been tentatively assigned on the basis of this simulation. This serves as an example of how the ultra-wideline nature of14N powder patterns can be
considered as an advantage in certain instances because the dispersion of spectral features across a wide frequency range can allow small differences in interaction parameters to be resolved (provided, of course, that a sufficient S/N ratio can be obtained).
After an optimization of the proton positions, the quadrupolar parameters predicted by plane-wave DFT are in good agreement with the experimental values for all three dicyanobenzene samples (see Table 2). Both the calculated EFG and shielding tensors are fairly close to axially symmetric, and the V33 and
σ33components are coincident and parallel to the CtN bond
(to within 1°) in all cases, as would be expected. The calculated orientation of V22is within 2° of the plane of the molecule for
Figure 2. (a) Experimental14N NMR spectrum of an empty silicon nitride
MAS NMR rotor. (b) Fitted simulation made using parameters CQ)2.18 MHz andηQ)0.08. Inset: A fragment of the crystal structure showing the three-fold coordination of nitrogen with silicon (nitrogen atoms in blue).
Figure 3. Experimental14N NMR spectra of (a) 1,2-dicyanobenzene, (c)
1,3-dicyanobenzene, and (e) 1,4-dicyanobenzene, with fitted simulations shown in (b), (d), and (f), respectively. The molecular structures are shown inset next to each spectrum (nitrogen atoms in blue, carbons in gray).
each site, except for that of 1,4-dicyanobenzene, for which it is tilted at an angle of ca. 9° relative to the plane of the benzene ring. This is a result of intermolecular effects and is discussed further in section 4.1.
3.4. Hydrazine Dihydrochloride.A fragment of the hydrazine dihydrochloride structure is shown as an inset in Figure 5. The single unique nitrogen environment is axially symmetric (C3
symmetry), and, as one would expect, this is reflected in axially symmetric EFG and CS tensors predicted by plane-wave DFT (see Table 2), with V33andσ33coincident. Note that since V11
)V22andσ11)σ22, the values of the Euler angles R andγ are essentially meaningless in this instance. While this symmetry fixes the value ofηQto zero, the calculated CQvalue for this
sample is overestimated, even after optimization of the proton positions (see Figure 1b). This may be due to the dynamics of the N2H62-ion. Primarily, this consists of a rotation of the NH3
groups around the N-N bond axis, a process that has been characterized by 1H solid-state NMR relaxation62 as well as
other techniques.63,64This motion in itself would not alter the 14N C
Q, though other modes are possible which could alter the
experimentally measured CQ. For example, the CQ could
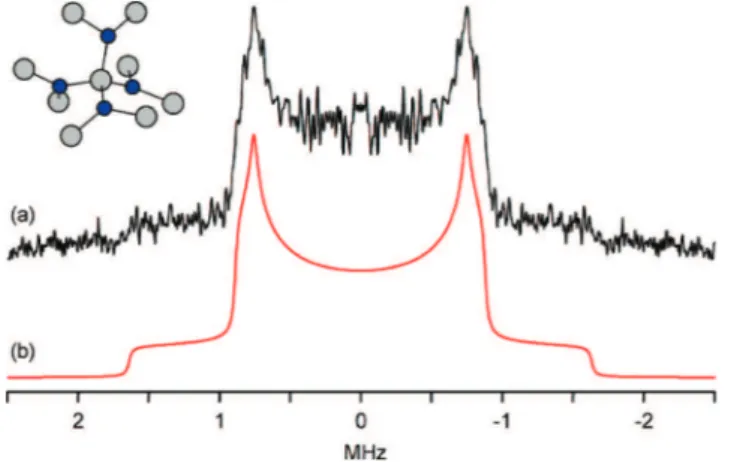
potentially be altered by librational motion of the protons, resulting in their average positions being different from that specified in the crystal structure used for the calculation. Nonetheless, the WURST-echo spectrum shows excellent agree-ment with the fitted simulation in Figure 5b, allowing an accurate measurement of the CQvalue as 3.82 MHz.
Significant anisotropy in the QCPMG enhancement is clearly visible in the WURST-QCPMG spectra in Figure 5c, with increased signal intensity near the center of the pattern (especially visible in the non-decoupled spectrum) arising from a greater number of echoes being acquired in the QCPMG train. This anisotropy is caused by the rotational dynamics of the NH3
groups. The center of the pattern corresponds to crystallites oriented with the NH3rotation axis atθ ) 54.7° (the magic
angle) relative to the external magnetic field. Thus, this rotation will decouple the N-H dipolar interactions and reduce their contribution to the dephasing of the14N magnetization in this
region. Further out from the center of the pattern, the NH3
rotation fails to average out the dipolar couplings and will even enhance the14N relaxation for components of the rotation that
occur at rates comparable to the 14N Larmor frequency.
Increasing the strength of the proton decoupling reduces dephasing due to N-H dipolar couplings for all orientations; thus, the spectrum approaches the ideal shape. The small dip in the very center of the pattern is likely due to distortions related to the DEISM effect mentioned previously.26,27 A complete picture of the dephasing/relaxation effects in this system would require an additional consideration of the effects of H-H dipolar couplings, but this is beyond the scope of this article.
We have therefore shown that ultra-wideline14N NMR line
shapes can be sensitive to local dynamics, even when those dynamics cause no change in the magnitude or orientation of the EFG tensor. In this case, the dynamics affect the shape of the powder pattern via the orientation dependence of N-H dipolar couplings, which result in anisotropy observable as a variation in QCPMG enhancement. We note that relaxation caused by the modulation of N-H dipolar couplings has recently been illustrated in solid-state15N NMR experiments conducted
on proteins and was used to extract quantitative dynamic information.65-67 We are currently using 14N NMR to study
other hydrazine systems, and a more detailed investigation into the mechanisms at play in such systems will be the subject of a future publication.
(62) Ratcliffe, C. I. J. Magn. Reson. 1980, 38, 283.
(63) Ludman, C. J.; Ratcliffe, C. I.; Waddington, T. C. J. Chem. Soc.
Faraday Trans. 1976, 72, 1741.
(64) Ratcliffe, C. I.; Sherman, W. F.; Wilkinson, G. R. J. Raman. Spectrosc.
1981, 11, 199.
(65) Giraud, N.; Bo¨ckmann, A.; Lesage, A.; Penin, F.; Blackledge, M.; Emsley, L. J. Am. Chem. Soc. 2004, 126, 11422.
(66) Giraud, N.; Blackledge, M.; Goldman, M.; Bo¨ckmann, A.; Lesage, A.; Penin, F.; Emsley, L. J. Am. Chem. Soc. 2005, 127, 18190.
(67) Giraud, N.; Sein, J.; Pintacuda, G.; Bo¨ckmann, A.; Lesage, A.; Blackledge, M.; Emsley, L. J. Am. Chem. Soc. 2006, 128, 12398.
Figure 4. (a-c) High-resolution experimental pieces of the 1,3-dicyanobenzene spectrum. (d) Simulation of all interaction parameters as predicted by
CASTEP (see Table 2) with expansions around certain spectral features shown inset. Assignments of spectral features are made in (a) and (b) based on the simulation.
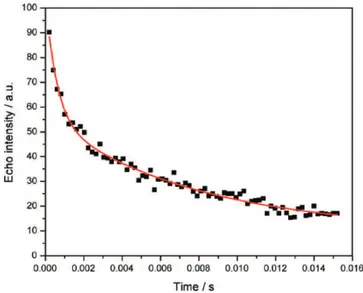
3.5. Urea-d4.An undeuterated sample of urea, initially studied at 9.4 T, was found to have a very short transverse relaxation time for the14N nuclei (as measured via the WURST-QCPMG
echo train), which drastically reduces the number of echoes that can be acquired. A deuterated sample was therefore obtained in the hope of increasing the T2, since the deuteration of a sample
ofL-leucine was found to increase the14N T2significantly in a
previous study,27allowing for a greater QCPMG enhancement.
Unfortunately, the apparent T2 in the urea-d4 sample is still
relatively short (ca. 0.25 ms at 21.1 T), allowing only eight echoes to be acquired before the transverse magnetization is lost completely. This relatively fast relaxation was subsequently found to be due to the dynamics present in this system. Urea molecules in the crystal undergo two types of motion: 180° flipping of the molecule around the carbonyl bond axis, and rotation of the amine groups around the N-C bonds. These two dynamic processes have been studied previously by 1H
NMR,68,69 2H NMR,70-72 and 14N NQR.73-76 The former
motion is known to occur at ambient temperatures, and we have very recently shown that it can be studied in a quantitative fashion using14N ultra-wideline NMR.28We refer the reader
to this reference for more details, but here we provide a very brief recap prior to further discussion of the14N EFG tensor in
urea in section 4.2.
The 14N WURST-echo spectrum in Figure 6a was fitted to
obtain EFG parameters of CQ)3.47 MHz andηQ)0.31. While
some previous studies have assumed the V33component of the 14N EFG tensor in urea to be parallel to the N-C bond,70,76
our CASTEP calculations predict it to be perpendicular to the molecular plane, with V22within 2° of the N-C bond (theσ33
component of the shielding tensor is also aligned almost parallel to the N-C bond, withσ22perpendicular to the molecular plane).
As with the hydrazine dihydrochloride system discussed above, the CQvalue predicted by plane-wave DFT values is
overesti-mated (Table 2 and Figure 1), and once again this may be due
(68) Kromhout, R. A.; Moulton, W. G. J. Chem. Phys. 1955, 23, 1673.
(69) Emsley, J. W.; Smith, J. A. S. Trans. Faraday Soc. 1961, 57, 1233.
(70) Chiba, T. Bull. Chem. Soc. Jpn. 1965, 38, 259.
(71) Williams, J. C.; McDermott, A. E. J. Phys. Chem. 1993, 97, 12393.
(72) Taylor, R. E.; Bacher, A. D.; Dybowski, C. J. Mol. Struct. 2007, 846, 147.
(73) Chiba, T.; Toyama, M.; Morino, Y. J. Phys. Soc. Jpn. 1959, 14, 379.
(74) Minematsu, M. J. Phys. Soc. Jpn. 1959, 14, 1030.
(75) Zussman, A. J. Chem. Phys. 1973, 58, 1514.
(76) Kruk, D.; Altmann, J.; Fujara, F.; Ga¨dke, A.; Nolte, M.; Privalov, A. F. J. Phys.: Condens. Matter 2005, 17, 519.
Figure 5. (a) Experimental WURST-echo spectrum obtained from the hydrazine dihydrochloride sample, (b) a fitted simulation made using parameters CQ
)3.82 MHz andηQ)0.00, and (c) WURST-QCPMG spectra obtained with different proton decoupling strengths as shown. A fragment of the crystal structure is shown inset (nitrogen atoms in blue, chlorines in green). The angle between the N-N vector (which is coincident with V33) and the external magnetic field B0is labeled asθ.
to the effects of molecular dynamics that are not accounted for in the calculations. Unlike the rotation of the NH3groups in
the hydrazine sample, however, the flipping of the urea molecule alters the orientation of the14N EFG tensor with respect to B
0,
thereby affecting the14N NMR line shape. Figure 6c shows the
WURST-QCPMG spectrum, which features sharp protrusions at the outermost edges. These regions correspond to crystallite orientations where the flipping mechanism does not alter the orientation of the EFG tensor with respect to B0; thus, these
crystallites have longer T2values and show greater QCPMG
enhancement. Figure 6d was generated using the EXPRESS software, with an echo delay of 40µs and a jump rate of 2 × 10⁴s-1
. The molecular flipping was modeled as a reorientation of the EFG tensor between Euler angles of R ) 30°,β ) 90°, γ ) 0° and R ) 210°, β ) 270°, γ ) 0°. This simulation reproduces the sharp features at the edges of the pattern. The WURST-QCPMG spectrum, however, corresponds to a wide range of effective echo delays since it represents a sum of several echoes formed at different points in time. In order to extract accurate jump rates from the experimental data, individual echoes were processed and fitted to similar simulations. The resultant jump rate at 19 °C was determined as 7 × 10³s-1
, and further measurements made at other temperatures allowed an estimate of the activation energy for this process as EA)
75 ( 15 kJ mol-1
.28
3.6. Imidazole.The imidazole molecule forms the side chain of the amino acid histidine and thus constitutes an important component in many protein structures, with the heterocycle providing bonding sites for metal ions such as zinc or cobalt. As such, it is a system for which the nitrogen NMR interaction tensors have previously been well characterized (Vide infra).
The imidazole crystal structure features two chemically distinct nitrogen environments that are each involved in the same NsH · · · N hydrogen bond. For site N1, the proton is at a distance of 1.038 Å (i.e., it is bonded to the nitrogen) and is in the molecular plane. For site N2, the proton is at a distance of 1.828 Å, and the N-H vector forms an angle of ca. 14° with the plane of the molecule. These distances are taken directly from the neutron diffraction structure,47 in which proton
positions have been accurately determined. Optimization of these proton positions in CASTEP therefore did not result in as dramatic an improvement in the calculated NMR parameters as in other systems whose structures were determined by X-ray techniques (e.g., the other samples in Table 2 and a previous study ofL-leucine),27and proton positions were only slightly
altered.
The WURST-echo spectrum obtained from imidazole is shown in Figure 7a, and a fitted line shape made using two powder patterns of equal integrated intensity (Figure 7b,c) resulted in experimental parameters that agree very well with values predicted by plane-wave DFT (Table 2), as well as values measured using 14N NQR77(C
Q)1.424,ηQ)0.980 for N1
and CQ)3.267,ηQ)0.129 for N2). Garcia et al.78used NQR
to determine the EFG tensor orientations in the molecular frame. For site N1, they concluded that the value of CQis negative
and that the V11 component is aligned in the direction of the
N-H bond, while V33is perpendicular to the molecular plane.
The CASTEP results obtained from the unaltered neutron
(77) Hunt, M. J.; Mackay, A. L.; Edmonds, D. T. Chem. Phys. Lett. 1975,
34, 473.
(78) Garcia, M. L. S.; Smith, J. A. S.; Bavin, P. M. G.; Ganellin, C. R.
J. Chem. Soc., Perkin Trans. 1983, 2, 1391.
Figure 6. (a) 14N WURST-echo spectrum of urea-d
4, with a fitted simulation (b) made using CQ)3.47 MHz andηQ)0.31. (c) The WURST-QCPMG spectrum, with a simulation (d) taking into account the flipping of the molecule around the CdO bond (see section 3.5 for further details). An image of the urea molecule is shown inset (nitrogen atoms in blue, carbon in gray and oxygen in red), with the flip axis indicated as a dotted line.
Figure 7. (a)14N WURST-echo spectrum of imidazole, (b) total fitted
simulation, and (c) individual simulated line shapes with parameters CQ) 1.43 MHz andηQ)0.98 (N1, green) and CQ)3.25 MHz andηQ)0.15 (N2, purple). (d) The WURST-QCPMG spectrum. An imidazole molecule is shown inset with the two nitrogen sites labeled (nitrogen atoms in blue, carbon in gray). The dashed line represents a hydrogen bond. The dotted line indicates the flip axis for the molecular reorientation mechanism (see section 3.6 for discussion).
diffraction structure are in agreement with this, but after an optimization of the protons, the sign of CQbecomes positive
and the directions of the V33and V22components are swapped.
This does not imply that the proton optimization process makes significant changes to the structure but rather is a result of the asymmetry parameter being close to 1, which means that |V33|
≈ |V22|. Hence, only a relatively small change in the magnitude
of the EFG in either of these directions can “swap” these components. A similar effect was observed in a14N NMR study
of proline,27which also has an
ηQ value close to unity. We
note that a separate study of imidazole, which considered the effects of 14N residual dipolar couplings on a 13C CPMAS
spectrum, also concluded that the CQ for site N1 should be
negative.79For site N2, the calculated C
Qis negative both before
and after proton optimization, and the orientation of the EFG (V33pointing toward the lone pair orbital and V11perpendicular
to the ring plane) is in agreement with that determined by Garcia et al.78
Ueda et al. measured the nitrogen CS tensors for both sites in imidazole directly from the static powder pattern obtained from a15N-enriched sample,80and these values are quoted in
Table 2. The parameters predicted by plane-wave DFT before and after proton optimization show approximately the same level of agreement with experiment. As for the orientations of the shielding tensors in the molecular frame, Solum et al.81
performed DFT calculations on a wide range of five- and six-membered nitrogen heterocycles and concluded that, for imino groups (such as site N1 in imidazole),σ11is always in the radial
direction of the ring (i.e., pointing toward the proton), while for “non-substituted” nitrogens (i.e., N2), it is tangential to the ring. In addition, they predicted thatσ33is always perpendicular
to the ring plane. The shielding tensor directions predicted by our CASTEP calculations are in full agreement with these conclusions.
The WURST-QCPMG spectrum, which is shown in Figure 7d, shows significant distortions, once again indicating the presence of T2 anisotropy caused by dynamic effects. The
imidazole crystal structure consists of infinite chains of mol-ecules along the c-axis, linked together by hydrogen bonds between the two nitrogen sites.47An enhanced proton
conduc-tivity along this axis was reported several decades ago, and a two-stage Grotthus mechanism was proposed to explain this.82
The first stage involves proton hopping (PH) across the hydrogen bonds, and the second involves a molecular reorientation (MR) of the imidazole rings such that the chain is returned to its original state. The MR, which involves the breaking of the strong hydrogen bond and a 180° flip about the axis shown in Figure 7, is expected to be the rate-determining step, with an early1H
relaxation study proposing a reorientation rate of ca. 1 s-1.83
More recent molecular dynamics results suggest that PH can occur very easily and that inversion defects in which the hydrogen-bonding direction is reversed along an entire chain
are relatively stable.84However, evidence against fast PH in
the bulk crystalline phase has been provided by ENDOR85and NQR experiments77,86 as well as neutron diffraction, which
suggests localization of the proton on a single, well-defined site on one side of the hydrogen bond.47Efforts to observe slow
PH by15N cross-polarized MAS NMR exchange experiments80,87
were unsuccessful and also appeared to rule out MR.87Further 1H and 15N NMR experiments by Goward, Spiess, and
co-workers, however, revealed the presence of two distinct domains: a crystalline phase in which dynamics are absent and both1H and15N relaxation times are very long, and a disordered
region in which exchange occurs between the two nitrogen sites and relaxation is much faster.88,89These latter findings indicate
that the proton conduction mechanism in imidazole occurs primarily in disordered regions such as grain boundaries, and the question of anisotropic conductivity in the bulk crystal phase appears to remain unresolved.
The PH and MR mechanisms would each modulate the14N
EFG tensors in distinct ways; thus,14N NMR could potentially
shed light on these processes. The former mechanism would interchange the N1 and N2 EFG tensors (analogous to chemical exchange), while the latter would flip them individually by 180° (a process similar to the urea dynamics discussed above). These mechanisms should therefore be distinguishable via their very different effects on the 14N NMR line shape, and EXPRESS
simulations are shown in Figure 8a-c for respectively PH, MR, and both simultaneous processes. In the latter case, the simula-tions incorporate equal jump rates for both processes, though in reality the MR would be expected to be much slower. In fact, MR at a rate of 1 s-1
(as suggested from1H experiments)83
would not have an observable effect on the14N spectrum. It is
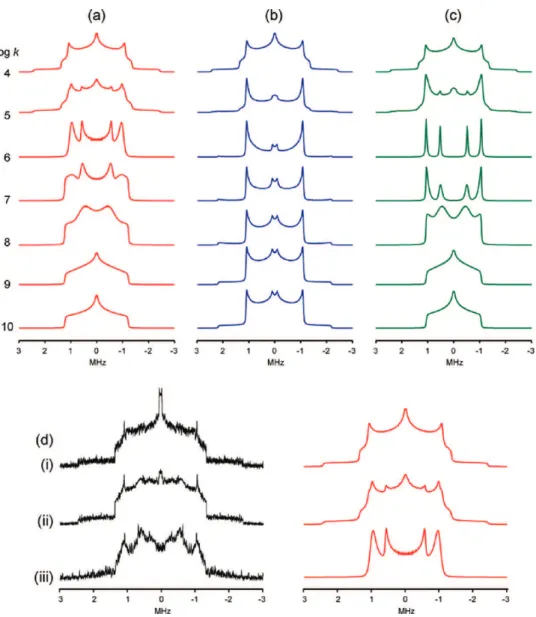
unsurprising, then, that the experimental spectra in Figure 8d more closely match the line shapes simulated with the PH mechanism only. These spectra were reconstructed from the first, fourth, and thirtieth echoes of each WURST-QCPMG train (corresponding to effective echo delay times of 177, 708, and 5310µs, Figure 8d(i)-(iii), respectively). The line shapes match reasonably well with simulations of the PH mechanism at various jump rates. A concentrated effort at fitting these line shapes, however, indicates the presence of two separate domains, in agreement with the findings of Goward and Spiess.88,89This
is most easily illustrated by considering the simulations in Figure 9, which show how the14N powder pattern changes over a range
of both jump rates and echo delays under the PH model. Two regimes can be distinguished. For k e 3 × 10⁵s-1(referred to
here as the slow motion regime), the line shapes at short echo delay times correspond to the static14N powder pattern resulting
from the two separate nitrogen sites (as shown in Figure 7b). As the echo delay time is increased, the line shapes diverge from this. Conversely, for k g 1 × 10⁶ s-1
(the fast motion regime), line shapes at short echo delay times represent motionally averaged powder patterns arising from the inter-change of the two EFG tensors. As the echo delay times are increased, line shapes in both of these regimes all eventually converge to an identical, “intermediate” line shape. This can
(79) Grasselli, M.; Dı´az, L. E.; Olivieri, A. C. Spectrosc. Lett. 1991, 24, 895.
(80) Ueda, T.; Masui, H.; Nakamura, N. Solid State Nucl. Magn. Reson.
2001, 20, 145.
(81) Solum, M. S.; Altmann, K. L.; Strohmeier, M.; Berges, D. A.; Zhang, Y.; Facelli, J. C.; Pugmire, R. J.; Grant, D. M. J. Am. Chem. Soc.
1997, 119, 9804.
(82) Kawada, A.; McGhie, A. R.; Labes, M. M. J. Phys. Chem. 1970, 52, 3121.
(83) Daycock, J. T.; Jones, G. P.; Evans, J. R. N.; Thomas, J. M. Nature
1968, 218, 672.
(84) Iannuzzi, M. J. Chem. Phys. 2006, 124, 204710.
(85) Gloux, P.; Lamotte, B. Mol. Phys. 1972, 24, 23.
(86) Schempp, E.; Bray, P. J. Phys. Lett. A 1967, 25, 414.
(87) Hickman, B. S.; Mascal, M.; Titman, J. J.; Wood, I. G. J. Am. Chem.
Soc. 1999, 121, 11486.
(88) Goward, G. R.; Schuster, M. F. H.; Sebastiani, D.; Schnell, I.; Spiess, H. W. J. Phys. Chem. B 2002, 106, 9322.
(89) Fischbach, I.; Spiess, H. W.; Saalwa¨chter, K.; Goward, G. R. J. Phys.
be seen to occur in Figure 9 for k values between 3 × 10⁴and
1 × 10⁷s-1, which all show the same line shape at an echo
delay of 256µs. It follows that the observation of both slow/ static and motionally averaged (fast regime) line shapes from the experimental WURST-QCPMG echo train (Figure 8d(i) and (iii), respectively) could only be caused by the presence of at least two k values, one in each regime. The slow/static domain clearly makes up the majority of the sample, based on the good agreement between the WURST-echo spectrum and the fitted simulation in Figure 7. By the 30th echo of the QCPMG train, however, the line shape is dominated by a fast regime-like line shape (Figure 8d(iii)). The presence of two domains, one with slow (or no) PH and one with fast PH, would also explain the appearance of the WURST-QCPMG spectrum in Figure 7d, which has characteristics of both the slow and fast regime line shapes. Our attempts to obtain a convincing fit of the experi-mental WURST-QCPMG spectrum were unsuccessful, being complicated by numerous variables such as the relative propor-tions of each domain, their individual T2 values and T2
anisotropies, and also the computational difficulties mentioned in section 2.3. Attempts to selectively observe these domains individually on the basis of possible differences in T1relaxation
were also unsuccessful. From the spectra and simulations in Figures 8d and 9, however, the minimum PH jump rate in the fast PH domain can be estimated to be ca. 1 × 10⁸s-1
at room temperature. To summarize this analysis, the experimental14N
NMR data obtained from imidazole are best interpreted as arising from both a bulk imidazole structure with relatively slow (or no) PH present and a less abundant domain in which PH occurs much more quickly. Such conclusions are fully consistent with the work of Goward and Spiess,88,89as well as all other experimental studies mentioned above, providing further support for the proposal that the proton conduction in this material occurs via disordered domains such as grain boundaries rather than the bulk crystal lattice.
In the preceding three sections, we have shown that14N NMR
line shapes from samples with very large CQvalues can be used
to access information on molecular dynamics in two distinct ways. In the case of hydrazine dihydrochloride, the EFG tensor remains static while local dynamics give rise to an orientational dependence in N-H dipolar couplings, causing an anisotropy in transverse dephasing, observable as a variation in QCPMG enhancement across the powder pattern. For samples in which the dynamics modulate the EFG tensor on a time scale
Figure 8. EXPRESS simulations of the14N powder pattern of imidazole undergoing (a) proton hopping across the hydrogen bond, (b) 180° molecular
reorientation about an axis perpendicular to the N-N vector, and (c) both mechanisms. Jump rates used in the simulations are shown on the left (log k). (d) Experimental spectra reconstructed from the (i) first, (ii) fourth, and (iii) thirtieth echoes in the QCPMG trains of each piece, alongside simulations incorporating the effects of the proton hopping mechanism.