HAL Id: hal-02183924
https://hal.archives-ouvertes.fr/hal-02183924
Submitted on 15 Jul 2019
HAL is a multi-disciplinary open access
archive for the deposit and dissemination of
sci-entific research documents, whether they are
pub-lished or not. The documents may come from
teaching and research institutions in France or
abroad, or from public or private research centers.
L’archive ouverte pluridisciplinaire HAL, est
destinée au dépôt et à la diffusion de documents
scientifiques de niveau recherche, publiés ou non,
émanant des établissements d’enseignement et de
recherche français ou étrangers, des laboratoires
publics ou privés.
AFGL 4029: a cluster of massive young stars
L. Deharveng, Annie Zavagno, I Cruz-González, L Salas, J. Caplan, L.
Carrasco
To cite this version:
L. Deharveng, Annie Zavagno, I Cruz-González, L Salas, J. Caplan, et al.. AFGL 4029: a cluster
of massive young stars. Astronomy and Astrophysics - A&A, EDP Sciences, 1997, 317, pp.459-475.
�hal-02183924�
AND
ASTROPHYSICS
AFGL 4029: a cluster of massive young stars
?
L. Deharveng1, A. Zavagno1, I. Cruz-Gonz´alez2, L. Salas2, J. Caplan1, and L. Carrasco3
1 Observatoire de Marseille, 2 place Le Verrier, F-13248 Marseille Cedex 4, France ([email protected]) 2
Instituto de Astronom´ıa, UNAM, Apdo. Postal 70-264, Cd. Universitaria, 04510 M´exico, D.F., M´exico 3 Instituto Nacional de Astrof´isica, ´Optica y Electr´onica, Apdo. postal 51 y 216, 72000 Puebla, Pue., M´exico Received 26 February 1996 / Accepted 3 June 1996
Abstract. The molecular cloud IC 1848A, located at the bor-der of the extended H ii region S 199, harbors the bright in-frared source AFGL 4029. A young star cluster is observed in this direction. We present an optical and near infrared study of this cluster, which contains at least thirty B stars. The visual extinction affecting the stars attains 30 mag, and shows large variations on very small scales. The most massive star, possibly a B1V, ionizes the ultracompact H ii region G138.300+1.558. The youngest object of the cluster, AFGL 4029-IRS 1 – identi-cal to the radio source G138.295+1.555 – is a massive pre-main-sequence object illuminating a reflection nebula. AFGL 4029-IRS 1 is luminous (∼ 104L ) and highly reddened (A
V = 25–
30 mag); displaying many of the spectral characteristics of pre-main-sequence objects (including bright and broad emission lines and the presence of Fe ii emission), it is very similar to the most luminous Herbig Ae/Be stars. AFGL 4029-IRS 1 shows evidence of mass ejection: it emits an ionized stellar wind with terminal velocities of about 400 km s−1 and a mass loss rate of about 7 10−6M yr−1; it is associated with a CO outflow
and a high velocity optical jet; a bright unresolved H2clump is
observed in its vicinity. The whole complex is a very efficient star forming region, as about 10% of the mass of the parental molecular cloud has been used to form B stars.
Key words: stars: pre-main-sequence – ISM: reflection nebulae – infrared: stars – ISM: individual objects: AFGL 4029
1. Introduction
It is well known that young stellar objects (YSOs) often form in compact groups – i.e. binary systems and clusters (Strom et al. 1972; Carpenter et al. 1993; Hodapp 1994). However, many questions remain unanswered, such as whether these objects
Send offprint requests to: L. Deharveng ?
Based on observations done at the Observatoire de Haute Provence and the Observatoire du Pic du Midi, France, and at the Observatorio Astron´omico Nacional, Mexico
form simultaneously or sequentially, and what influence a mas-sive YSO has on its surroundings and on subsequent star for-mation. The cluster we present here contains several massive young objects in various stages of evolution. Using photometry and spectroscopy we try to ascertain the nature of each compo-nent of the group, in order to progress towards answering these questions.
Bright-rimmed clouds are often found at the edges of large evolved H ii regions. Such clouds are potential sites of star for-mation because of the compression generated by the ionization-shock fronts (Sugitani et al. 1991; Sugitani et al. 1995). This phenomenon is well illustrated by AFGL 4029.
The cluster and its environment are described in Sect. 2. Photometric observations from 0.45µm to 2.2 µm are presented in Sect. 3:B, V , R, I, J, H, and K0magnitudes are given, and
the nature of the observed objects is discussed. Sect. 4 deals with an H2 condensation discovered in the vicinity of a
pre-main-sequence object. Spectroscopic observations of two Hα objects, which dominate the optical emission, are presented in Sect. 5. The whole star forming region is discussed in Sect. 6, and conclusions are drawn in Sect. 7.
2. Description of the region
The H ii region S 199, corresponding to the radio source W 5, is located in the Perseus arm. This region, extended and somewhat evolved, is associated with the cluster1IC 1848 which is rela-tively young – no more than 106years (Harris 1976, Feinstein et al. 1986). Its photometric distance is 2.2 ± 0.2 kpc (Becker & Fenkart 1971; Moffat 1972; Georgelin et al. 1973); this is quite different from the kinematic distances of the ionized and molecular gas complex, which range from 2.65 kpc (Georgelin et al. 1973) to 3.8 kpc (Churchwell et al. 1990), depending on the Galactic rotation model used. As deviations to the mean ro-tation curve exist in the Perseus arm, we favor the photometric distance of 2.2 kpc.
Several bright rims are observed along the edges of S 199; these are ionization fronts at the interface between the hot
ion-1
We reserve the designation IC 1848 for the cluster, rather than the H ii region.
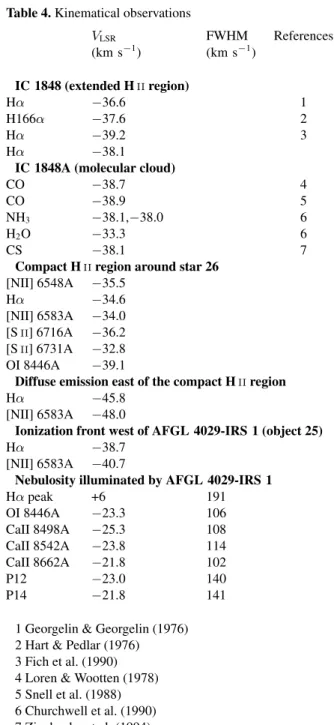
Fig. 1. Hα image of the ionization front at the interface between the extended H ii region S 199 (to the west) and the molecular cloud IC 1848A (to the east). The field size is 4.50×7.20. North is up, and east is left. The arrows point to the two Hα emission objects discussed in this paper
ized gas of the H ii region and the cold dense material of the molecular clouds. These dark clouds harbor compact infrared sources, where star formation is in action (Wilking et al. 1984; Sugitani et al. 1991). In the present paper we study the well-defined ionization front called bright rim A (Pottasch 1956), which bounds S 199 on its eastern edge. Fig. 1 is an Hα image of this bright rim, with S 199 to the right and the molecular cloud on the left; the ionization front is viewed edge-on. The two Hα emission objects visible east of the front (indicated by arrows in Fig. 1) are discussed in this paper. The molecular cloud has been mapped in theJ =1–012CO emission line by Loren & Wootten
(1978, HPBW ∼ 1.03) and by Carpenter et al. (1990, HPBW ∼
4500). We adopt Loren & Wootten’s notation “IC 1848A” to
des-Fig. 2. The map of the CO outflow observed by Snell et al. (1988) superimposed on a R frame of the field (dashed lines for the blue wing, solid lines for the red wing)
ignate the molecular cloud itself.2Mass estimates of the cloud
range from 1800M to 3800M (Loren & Wootten). The CO emission peaks about 10
east of the ionization front, towards the two Hα emission objects. The high TA(CO) temperature of
23.6 K requires an embedded heating source. Broadening of the CO lines at the emission peak was first noted by Wootten et al. (1983). Subsequently Snell et al. (1988, HPBW ∼ 4500)
detected a CO outflow at this position. Their map of the CO out-flow, superimposed on ourR image of the region, is presented in Fig. 2. The outflow is isotropic, with a radius of ∼ 0.6 pc; Snell et al. estimated its mass to be 9.7M and its age 1.7×10⁵
years.
The dense core of the molecular cloud, as traced by CS emission (Carpenter et al. 1993, HPBW ∼ 5300
), peaks between the two Hα emission objects.
Beichman (1979) showed that there are two sources of 10–20µm radiation within the cloud. These sources, IRS 1 to the west and IRS 2 to the east, correspond quite well to the two Hα emission objects seen in Fig. 1 (see the discus-sion in Sect. 3 concerning the objects’ positions). According to Beichman, IRS 1 is an unresolved object similar in many
re-2
Note, however, that Leisawitz et al. (1989) use the notation IC 1848A for a quite distinct molecular cloud, lying north of S 199.
spects to BN, whereas IRS 2 is cooler and extended; the nature of IRS 2 is not clear. These two sources are not separated by IRAS; they correspond collectively to the strong IRAS point source 02575+6017, whose far infrared luminosity is estimated as ∼ 2 104L (Thronson et al. 1980; Snell et al. 1988). IRAS 02575+6017 can be considered to be identical to the previously catalogued (Price & Walker 1976) infrared source AFGL 4029, referred to in our title. Recent near infrared observations of IRAS 02575+6017 reveal a cluster of stars in this direction (Car-penter et al. 1993; Hodapp 1994).
Two radio continuum sources have been detected by Kurtz et al. (1994); once again they are associated with the two Hα emission objects seen in Fig. 1. The western source, G138.295+1.555, is unresolved; its flux density at 3.6 cm is 2.1 mJy. The eastern source, G138.300+1.558, is slightly ex-tended, with a core-halo morphology; its flux density is 5.8 mJy. Both are classified by Kurtz et al. as ultra-compact H ii regions. We will return to this point in Sects. 3 and 6.
This region displays several other signs of recent star for-mation. An H2O maser has been detected in the direction
of AFGL 4029 by Churchwell et al. (1990). An optical jet, conspicuous because of its strong [S ii] emission, originates from the vicinity of the western object; velocities of up to −500 km s−1are observed there (Ray et al. 1990).
3. Photometry
3.1. Optical observations
The Hα and R frames presented in Figs. 1 and 2 were ob-tained with the 120 cm telescope of the Observatoire de Haute Provence, on the night of 1990 September 20–21. The detector was an RCA CCD with 512 × 323 30-µm-square pixels. The scale is 0.0085 per pixel, and the FWHM of the PSF is 2.004.
B, V , R, and I frames were obtained with the 2-m telescope of the Observatoire du Pic du Midi, on the night of 1993 Novem-ber 21–22. The detector was a Thomson CCD with 1024 ×1024 19-µm-square pixels, binned two-by-two. The scale is 0.0048 per
binned pixel, and the FWHM of the PSF is 1.005. The
photomet-ric calibration (color equations, absolute flux calibration, and atmospheric extinction corrections) was obtained by observing the clusters NGC 7790 (Christian et al. 1985) and M 67 (Cheva-lier & Ilovaisky 1991). All the frames were reduced using the DAOPHOT stellar photometry package (Stetson 1987). 3.2. Near infrared observations
The near infraredJ, H, and K0images were obtained at the 2.1 m
telescope of the Observatorio Astron´omico Nacional at San Pe-dro M´artir, Baja California, Mexico, using the “CAMILA” in-frared camera described in Cruz-Gonz´alez et al. (1994) with a NICMOS 3 array (256×256 pixels). The observations were obtained at the f/13.5 Cassegrain focus using reimaging optics that yielded a plate scale of 0.0048 per pixel. A cold Lyot stop
was used to reduce the background radiation at longer wave-lengths. These data were obtained under photometric conditions on 1993 December 3. Images through the broad-band filtersJ
(1.20µm, FWHM 0.12 µm), H (1.60 µm, FWHM 0.16 µm), andK0(2.125µm, FWHM 0.35 µm), were obtained with total
integration times of 240 s, 240 s, and 40 s, respectively. Also, images through several narrow band filters including the molec-ular hydrogenv = 1–0 S(1) transition (2.122 µm, FWHM 0.020 µm), the [Fe ii] line (1.644 µm, FWHM 0.016 µm), and contin-uumK (cK at 2.26 µm, FWHM 0.06 µm), were obtained with total integration times of 380 s, 80 s, and 72 s, respectively.
The near infrared images were obtained in a “cross” se-quence – i.e. object, sky to the north, object, sky to the east, object, sky to the west, object, sky to the south, object. All the exposure times were the same. The median of the four bias-subtracted sky images was used as the flat field. The object frames were each bias subtracted, flattened by dividing by the flat field, and then combined. The flux calibration was done by observing 11 faint UKIRT system standard stars during 1993 December and 1994 April. Due to the adopted read-out scheme for the NICMOS chip, the intrinsic error in CAMILA’s pho-tometry is about 5%. The final frames were then reduced using DAOPHOT.
3.3. Photometric results
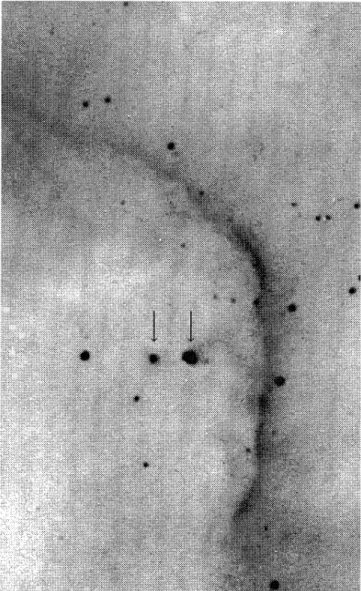
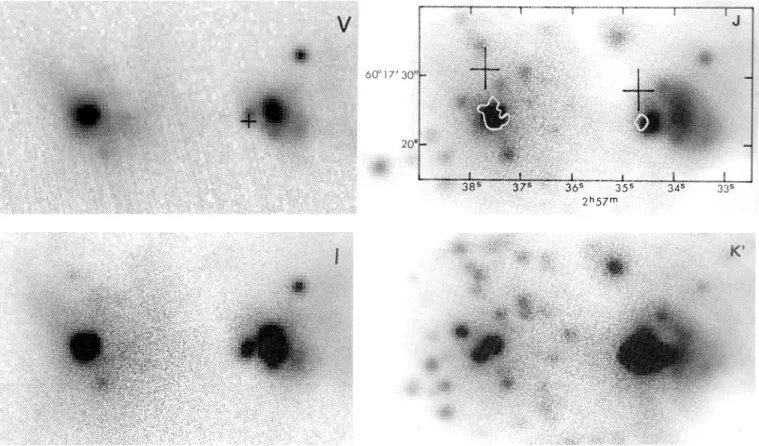
Fig. 3 (see also Fig. 5) presents theV , I, J, H, and K0frames.
In theV and I frames we see two nebulosities – the two Hα emission objects. The eastern one contains a very bright star (number 26). The western nebulosity contains no optical point source. A cluster of highly reddened stars appears progressively as we move towards the infrared. No. 25, the brightest at 2.2µm, lies very close to the western nebulosity, and has no optical counterpart.
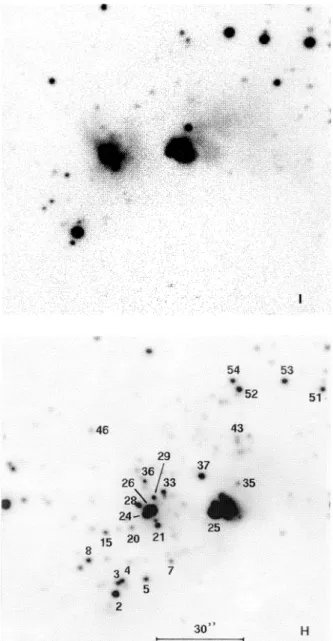
Table 1 gives the results obtained for 55 stars belonging to the field common to both the optical and near infrared frames. The first column gives their identification numbers, as in Fig. 3. The next two columns give the right ascensions and declina-tions for the equinox 1950; these coordinates were obtained as explained below. The fourth to seventh columns refer to the op-tical observations; they give theV magnitude and the B − V , V − R, and V − I colors. The final columns refer to the near infrared observations; they give theJ − H and H − K colors, and theK magnitude.
The coordinates are based on the Guide Star Catalog (GSC) positions of three stars which are visible in the Hα image, but not on theK0image. On theI image they are saturated. Since
there are few stars in common between Hα and K0, we used the
I image to find the transformation between K0and Hα . First
we found the four transformation coefficients (x and y shifts, scale change and rotation) to transform allK0star positions to
coordinates on theI image using seven stars in common. The standard deviation (in both coordinates) is 0.00
12 for this trans-formation. Then the transformation between theI image and the Hα image was found, using fourteen stars in common; the standard deviation is 0.0009. Then, using the two transformations
in series, all theK0 star positions were transformed to
coordi-nates on the Hα image, with an accuracy of 0.0015. Using the
Fig. 3.V , I, J , H, and K0frames of the field. North is up and east is to the left. The stars are identified by their numbers from Table 1
Table 1. Coordinates and photometry of stars No. α1950 δ1950 V B −V V −R V −I J −H H −K K h m s ◦ 0 00 1 2 57 37.85 60 16 32.4 1.72 0.85 14.64 2 2 57 39.22 60 16 55.5 15.35 1.22 0.68 1.44 0.39 0.33 12.03 3 2 57 39.11 60 16 58.2 1.77 0.95 12.43 4 2 57 38.91 60 17 00.0 2.00 1.08 12.37 5 2 57 37.78 60 17 00.4 2.04 1.05 12.40 6 2 57 38.53 60 17 06.1 1.24 13.91 7 2 57 36.58 60 17 06.5 1.74 0.87 13.14 8 2 57 40.48 60 17 07.0 1.38 0.95 12.71 9 2 57 39.62 60 17 07.4 1.32 0.69 14.47 10 2 57 36.75 60 17 09.0 1.48 0.41 14.54 11 2 57 35.96 60 17 09.9 0.96 14.15 12 2 57 38.41 60 17 14.4 1.28 13.68 13 2 57 36.45 60 17 15.2 0.62 14.04 14 2 57 31.37 60 17 15.9 1.25 0.35 14.67 15 2 57 39.67 60 17 16.5 1.33 1.16 12.70 16 2 57 28.77 60 17 17.0 1.90 0.71 12.86 17 2 57 39.03 60 17 17.5 1.13 14.14 18 2 57 40.27 60 17 17.6 1.66 0.90 13.33 19 2 57 36.50 60 17 17.6 0.43 14.31 20 2 57 38.43 60 17 17.9 1.61 0.96 13.33 21 2 57 37.21 60 17 18.8 20.89 1.46 3.17 1.29 0.22 12.82 22 2 57 38.70 60 17 20.9 1.54 13.50 23 2 57 36.28 60 17 22.5 0.25 14.41 24 2 57 37.77 60 17 22.6 1.88 1.39 11.30 25 2 57 34.54 60 17 23.1 2.97 2.24 7.73 26 2 57 37.50 60 17 24.2 17.01 1.96 1.45 2.93 0.94 0.26 10.50 27 2 57 35.99 60 17 25.9 1.25 13.59 28 2 57 38.13 60 17 26.1 2.19 1.35 11.75 29 2 57 37.37 60 17 28.5 2.08 0.83 12.85 30 2 57 36.89 60 17 28.8 0.72 13.28 31 2 57 30.98 60 17 28.9 1.10 14.08 32 2 57 29.05 60 17 29.2 2.21 0.81 13.00 33 2 57 36.93 60 17 30.3 1.76 0.86 12.85 34 2 57 37.86 60 17 32.0 2.04 1.22 13.45 35 2 57 33.43 60 17 33.0 18.41 0.92 1.83 0.81 0.13 14.15 36 2 57 37.82 60 17 34.1 1.71 0.61 13.26 37 2 57 35.14 60 17 35.6 2.58 1.40 11.43 38 2 57 36.98 60 17 36.8 1.04 13.86 39 2 57 38.20 60 17 37.6 1.75 1.14 13.82 40 2 57 37.54 60 17 38.1 14.11 41 2 57 33.32 60 17 43.8 0.63 13.94 42 2 57 34.43 60 17 44.7 1.12 14.29 43 2 57 33.43 60 17 47.4 2.77 1.14 13.08 44 2 57 28.85 60 17 48.8 19.90 1.42 2.88 1.31 0.44 13.12 45 2 57 32.90 60 17 49.2 2.21 0.77 13.88 46 2 57 40.30 60 17 51.4 20.62 1.19 3.13 0.90 0.08 14.52 47 2 57 28.41 60 17 53.3 1.66 1.05 14.05 48 2 57 28.03 60 17 53.3 1.63 0.75 13.62 49 2 57 34.20 60 18 01.1 1.58 0.73 13.88 50 2 57 33.95 60 18 01.2 0.61 14.42 51 2 57 29.46 60 18 05.3 16.75 1.22 0.75 1.51 0.46 0.16 13.48 52 2 57 33.35 60 18 05.4 1.82 1.04 11.58 53 2 57 31.23 60 18 08.2 16.55 1.24 0.78 1.62 0.45 0.17 13.03 54 2 57 33.65 60 18 08.3 1.51 0.67 12.50 55 2 57 31.83 60 18 14.8 1.64 0.84 14.14 H ii region around star 26 15.431 1.636 1.149 2.465 1.09 0.91 8.95 Reflection nebula + object 25 1.77 1.84 7.35 Reflection nebula alone 15.679 1.882 1.308 2.505 1.23 1.24 8.68
positions to right ascension and declination as described in the Appendix to Zavagno et al. (1994; hereafter ZDC). The final accuracy is close to that of the GSC – about a second of arc.
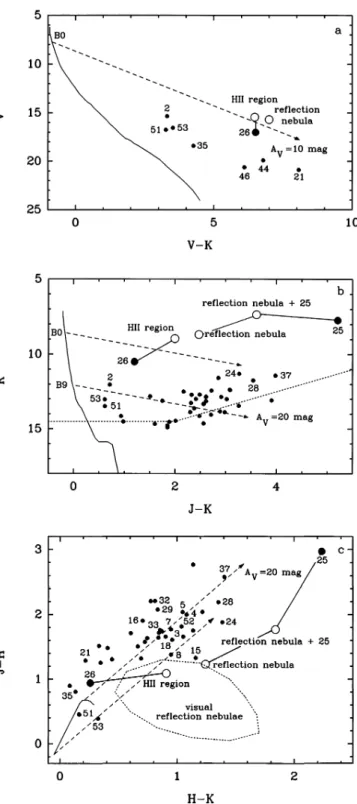
Fig. 4 presents the color-magnitude diagrams V versus V − K and K versus J − K and the color-color diagram J − H versusH − K, for the stars of Table 1. The photometric com-pleteness limit is about 16.5 inJ, and 14.5 in K. This implies that we detect all the main sequence stars earlier than B3 (those able to ionize hydrogen), if affected by less than 21 mag of vi-sual extinction, and all the stars earlier than B9, if affected by less than 16 mag of extinction. Obviously, lower mass stars are missed.
Object 25, the brightest object in the near infrared, is not a main-sequence star. It displays a strong near infrared excess. It has the near infrared colors of highly reddened Herbig Ae/Be stars (cf. Fig. 3 in Lada & Adams 1992). WithJ −H = 2.97 and H −K = 2.24 it appears very similar to V 645 Cyg (J −H = 2.8 andH − K = 2.2; Hamann & Persson 1992a), a well known luminous pre-main-sequence object. Object 25 is also the most reddened object of the field.
All the other stellar objects in the field are possibly main-sequence stars. Star 26 is probably the exciting star of the eastern nebulosity, an ultra-compact H ii region (see Sect. 3.4). It seems to be a B1V star with a visual extinction of about 8 mag. Three other stars that are detected in the near infrared appear to be both massive and highly reddened. Their spectral types are probably B1V or B2V. Star 37 is situated between the two nebulosities and hasAV ∼23–24 mag; it is not associated with any detectable
ionized emission; stars 24 and 28 lie very close in direction to star 26 and the compact H ii region, but with AV ∼20 mag they
are much more reddened than star 26.
The infrared cluster, which extends over more than one square arcminute, contains numerous other reddened massive stars. Stars 3, 4, 5, 7, 8, 15, 18, 20, 29, and 33 are probably B stars withAV ≥14 mag. A few isolated stars – 16, 32, 52 – are
also highly reddened. However, low extinction stars are found also; a few lie very close in direction to high extinction stars (no. 2, probably a B5-B7 withAV ∼4.2 mag, lies close to the
high extinction stars 3 and 4; nos. 21 and 26, withAV ∼8 mag,
lie close to the high extinction stars 24, 28, and 29). The lowest extinction,AV ∼3 mag, which is observed towards stars 51 and
53, is only marginally higher than the Galactic foreground ex-tinction in the direction of IC 1848 (AV ∼2 mag, Moffat 1972).
Thus stars 51 and 53 are probably in front of the molecular cloud IC 1848A.
The colors and magnitudes of both nebulosities – the com-pact H ii region around star 26 and the nebula close to object 25 – are also shown in Fig. 4. We have integrated over circular re-gions of 19.00
1 diameter (20 pixels radius), large enough to cover the whole nebulosities. The beam centered on the compact H ii region encompasses all the bright central stars (nos. 21, 24, 26, 28, 29). The beam centered on the western nebula also contains object 25, but the energy radiated by this object can easily be subtracted (see Fig. 4). The magnitudes and colors of the H ii region including the central stars are very similar to those of the western nebula alone; the differing nature of these two objects
Fig. 4a–c. Magnitude-color diagrams a V versus V − K b K versus J − K and c color-color diagram J − H versus H − K. The main sequence is from Bessell (1979) and Koornneef (1983), for a distance modulus of 11.71; the reddening lines are from Mathis (1990), with RV = 3.1. The dotted lines in b indicate our completeness limits. In c, the area surrounded by the dotted lines represents the colors of visual reflection nebulae (Sellgren 1984)
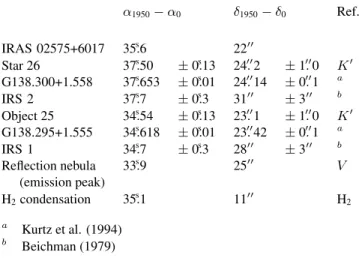
Table 2. Positions relative to α0= 2h57m, δ0= +60◦170. α1950−α0 δ1950−δ0 Ref. IRAS 02575+6017 35.s6 2200 Star 26 37.s50 ±0.s13 24.002 ±1.000 K0 G138.300+1.558 37.s653 ±0.s01 24.0014 ±0.001 a IRS 2 37.s7 ±0.s3 3100 ±300 b Object 25 34.s54 ±0.s13 23.001 ±1.000 K0 G138.295+1.555 34.s618 ±0.s01 23.0042 ±0.001 a IRS 1 34.s7 ±0.s3 2800 ±300 b Reflection nebula 33.s9 2500 V (emission peak) H2condensation 35.s1 1100 H2 a Kurtz et al. (1994) b Beichman (1979)
cannot be ascertained uniquely from their integrated optical and near infrared magnitudes. The near infrared colors of these two nebulae are similar to those of the visual reflection nebulae stud-ied by Sellgren (1984).
3.4. The associated nebulosities
Table 2 gives the positions of various objects discussed in the text.
The eastern nebula is a compact H ii region, probably ex-cited by star 26. Its spectrum is typical of an H ii region (see Sect. 5). Star 26 is located near the center of the radio source G138.300+1.558 (Kurtz et al. 1994). If it is indeed a B1V, this star radiates enough ionizing photons to account for the ob-served radio flux density of the H ii region.
Object 25 is visible only in the near infrared frames. Its K0position coincides with that of the unresolved radio source
G138.295+1.555 (Fig. 5), and is within 300
of that of IRS 1, Beichman’s unresolved mid infrared source. Obviously we are dealing with the same object. The western nebulosity is visible on all the frames; it lies about 600
(0.06 pc) west of object 25. This nebulosity has the same general appearance and emission peak position inB, V , R, I, and Hα. Fig. 5 shows that its morphology is slightly different in the near infrared (Fig. 5). InH and K0it
appears as a faint shell on the northwest side of object 25. This nebulosity is most probably an optical and infrared reflection nebula, scattering the radiation emitted by object 25. We will see in Sect. 5 that its spectrum is that of a pre-main-sequence object. This extended nebulosity is also observed in emission near 11µm (P.-O. Lagage, private communication). Emission at this wavelength cannot be due to scattered light, but could be due to non-thermal emission by small grains (Sellgren 1984) or to emission by PAH molecules (Leger & Puget 1984).
We observe a shift of the illuminating source (object 25) towards the SE as the wavelength increases (Fig. 5); emission in the I band extends towards object 25, and the J position of object 25 is shifted with respect to itsK0 position by some
1.800, in the direction of the reflection nebula. This shows that
scattered light is significant in the near infrared.
The colors of this reflection nebulosity alone areJ − H = 1.23 and H − K = 1.24. Thus the nebulosity is much bluer than object 25, the illuminating source. This is commonly ob-served in reflection nebulae associated with YSOs (c.f. Castelaz et al. 1985). This situation results from the variation of the dust column density along different lines of sight, as will be dis-cussed in Sect. 6.1, and from the scattering process, the grains’ albedo decreasing strongly with increasing wavelength in the near infrared (Draine & Lee 1984).
InJ, the observed integrated emission of the reflection neb-ula outshines the emission of the illuminating source (Table 1). The two emissions are comparable inH. In K0, the emission
of object 25 is dominant. AFGL 4029 is an example of an ob-ject which would be completely misunderstood in a study car-ried out with a large beam (unlike the more classical Herbig Ae/Be stars studied by Li et al. 1994, for which the circum-stellar extended emission, if present, is not significant in the near infrared). AFGL 4029 is similar to the deeply embedded YSOs V645 Cyg and AFGL 490, whose optical counterparts are reflection nebulae.
4. The H2condensation
Thev = 1–0 S(1) quadrupole transition of molecular hydrogen at 2.122µm is an excellent tracer of moderate shocks with speeds in the range 10 to 100 km s−1(Draine et al. 1983). It has been
found tracing the termination of CO outflows in obscured star forming regions (c.f. Richer et al. 1992; Dent et al. 1995), and coincident with optical jets and HH objects (Zealey et al. 1992; Poetzel et al. 1992).
We have found an unresolved clump of H2emission, with the
v = 1–0 S(1) filter, at 1500from object 25 (K0position) at PA =
170◦. The clump is also seen very faintly in theK0filter but there
is no indication of this clump in theJ and H continuum filters, nor in the narrow continuumcK. This confirms the fact that the detected clump is associated with H2 emission. The clump is
also seen on theK0image obtained by Hodapp (1994). Since the
H2image contains both line and continuum emission, we used
theK0broad-band image to subtract the continuum and reveal
the pure H2line emission (see Bally et al. 1993). The result is
presented in Fig. 6. The clump (coordinates given in Table 2) is clearly seen along with diffuse emission overlying the reflection nebula. Some faint emission is observed south-west of object 25 and overlaps, in position, with the optical jet detected in [S ii] (Ray et al. 1990). This situation is rather similar to that observed in the massive YSO AFGL 2591 (Poetzel et al. 1992).
The bright H2clump has no optical counterpart. The narrow
continuum filter was used to study the excitation mechanism. That filter (centered at 2.26µm) includes the H2v = 2–1 S(1)
line at 2.24µm, which is useful for determining if the molecu-lar hydrogen emision is due to shock heating or UV fluorescent pumping (cf. Lightfoot & Glencross, 1986). Failure to detect the H2knot in this filter at the 3σ level, allows us to state that
Fig. 5.V , I, J , and K0images of the reflection nebulosity and its illuminating source (object 25). The positions of various related sources are indicated on the J frame. The crosses correspond to Beichman’s (1979) mid infrared sources IRS 2 (east) and IRS 1 (west), and the white contours correspond to Kurtz et al.’s (1994) radio emission sources G138.200+01.558 (east) and G138.295+01.555 (west). The position of object 25 is indicated by a cross on the V frame
is greater than three, and thus is produced by shock heating as in the models of Black & Dalgarno (1976). This suggests that the unresolved clump of H2detected in emission is an HH object.
The flux measured in thev = 1–0 S(1) H2line is 5.38×10⁻¹⁴
erg s−1cm−2 which, at a distance of 2.2 kpc, corresponds to a luminosity of 8.1×10⁻³L . Different assumptions
concern-ing the extinction and the flux contained in other H2lines can
increase the total H2 luminosity by a factor of up to 60 (see
Richer et al. 1992). Not taking the extinction into account, the surface brightness of this H2knot is greater than 4.7×10⁻⁴erg
s−1 cm−2 sr−1. (The knot is unresolved with a PSF of 2.5”
FWHM.) This is consistent with a shock velocity of 20 km s−1
at a densitynH2= 10
4cm−3(Draine et al. 1983). If the true size
of the H2condensation were a factor of 10 smaller, the shock
speed would be 50 km s−1. The knot is not detected in [Fe ii];
this places an upper limit of this line’s flux at 2 × 10⁻¹⁵erg s−1
cm−2, consistent with a shock speed smaller than 50 km s−1
(Hollenbach & McKee 1989).
Hartigan et al. (1989) have measured an H2 luminosity of
1×10⁻³L at the optical position of HH7; this clump has a sur-face brightness similar to that of the AFGL 4029 H2clump, and
would not be spatially resolved at the distance of AFGL 4029. Similar H2luminosities are also estimated for a number of
ob-jects associated with CO outflows (Davis & Eisl¨offel 1995).
H2 knots are found to be associated with high velocity
molecular bullets in IRAS 03282+3035 (Bachiller et al. 1994). H2 emission probably results from shocks associated with the
interaction of outflows with the ambient molecular gas. A high spatial resolution map of the CO outflow associated with AFGL 4029 is clearly needed to see if and how the H2clump
is associated with the flow.
5. Spectroscopy
5.1. Observations and reductions
The observations were obtained using the CARELEC spectro-graph at the 193 cm telescope of the Haute Provence Observa-tory. Two spectral ranges of 400 ˚A width were observed, one centered on the Hα line, and one near 8600 ˚A. The slit width was 300. The exposure time was one hour for each spectrogram,
three of which were obtained for each spectral range.
The east-west orientation of the slit allows us to observe both nebulosities. The dispersion is 0.85 ˚A per pixel in the Hα range, and 1.1 ˚A per pixel around 8600 ˚A. The spectral resolu-tion, defined as the FWHM of neon and argon calibration lamps, is about 80 km s−1near Hα and 60 km s−1near 8600 ˚A. The
wavelength and photometric calibrations were performed as ex-plained in ZDC. The resulting photometric accuracy is estimated
Fig. 6. a H2frame of the AFGL 4029 field (v = 1–0 S(1) transition at 2.122 µm). b Contour levels of the pure H2emission line (continuum subtracted, see text); the arrow points to the H2 clump. The dotted area represents the high velocity [S ii] jet (components A, B, and C) observed by Ray et al. (1990)
to be ∼4.5% near Hα and ∼6.5% near 8600 ˚A; this concerns relative intensity measurements within the same spectral range; as explained by ZDC the accuracy of the absolute fluxes given in Table 3 is not as good.
5.2. Results
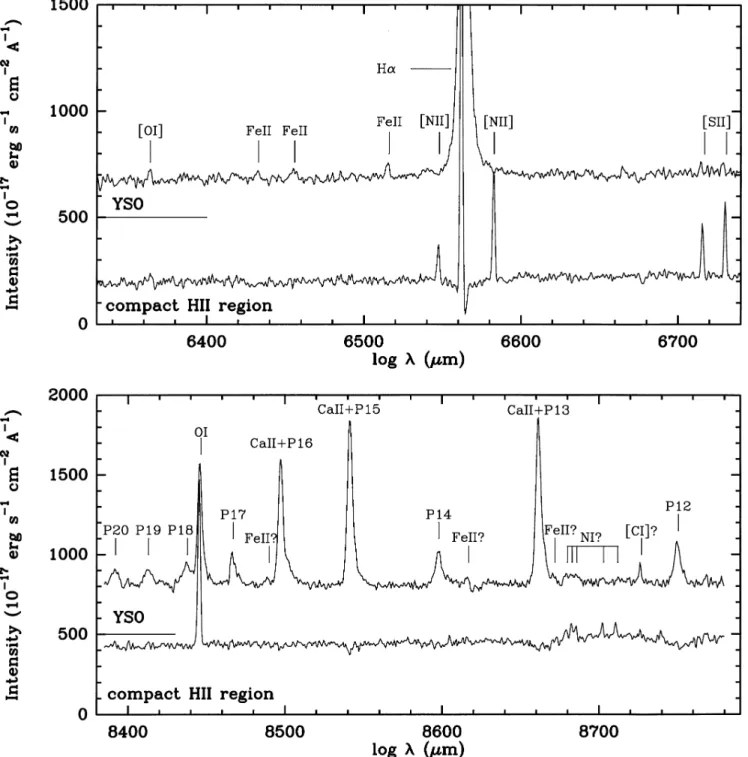
Fig. 7 presents the spectra of the two nebulosities in each spec-tral range. The strongest lines are identified. The differing na-tures of the two nebulosities is clearly revealed by these spec-tra. The eastern nebulosity around star 26 is clearly a compact H ii region. It displays narrow emission lines; the [N ii] lines at 6548 ˚A and 6584 ˚A are clearly visible on both side of Hα; the [S ii] lines at 6717 ˚A and 6731 ˚A are relatively strong and indicate electron densities of ∼ 1800 cm−3. Around 8600 ˚A,
the spectrum is dominated by the O i 8446.5 ˚A line. The Hα, Paschen 12, and Paschen 13 lines are seen in absorption in the underlying continuum spectrum of star 26 .
The spectra of the western nebulosity exhibit many charac-teristics of a pre-main-sequence object. The red range is domi-nated by the very broad, bright Hα line; the [N ii] and [S ii] lines are very faint, possibly absent; several Fe ii lines are present (cf. the red spectrum presented by Ray et al. 1990). Around 8600 ˚A, the spectrum is dominated by the Ca ii triplet lines at 8498 ˚A, 8542 ˚A, and 8662 ˚A; these lines are broad and opti-cally thick; broad O i and Paschen lines are also present. As stressed before, this reflection nebulosity is illuminated by the central source (object 25); thus the observed spectrum is that of object 25, possibly modified by scattering. Once again, this situation is very similar to that of the pre-main-sequence object V645 Cyg, which is not directly optically visible; the spectrum of V645 Cyg discussed by Hamann & Persson (1989) is that of its associated reflection nebula.
5.3. The pre-main-sequence object and its associated reflection nebula
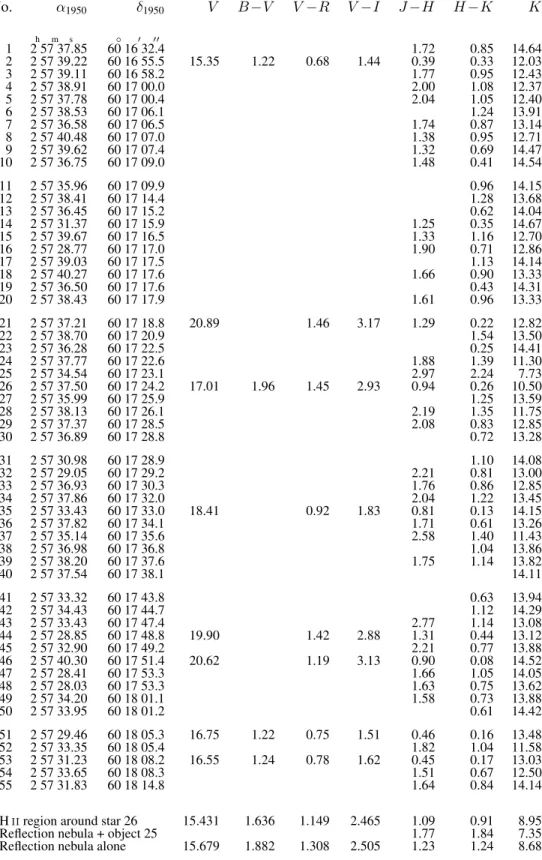
The intensities of the emission lines are presented in Table 3. Column 1 gives the wavelengths and column 2 the identifica-tions, according to Moore (1959). Column 3 gives the observed fluxes (with no extinction correction), and column 4 the equiva-lent widths of the lines. When discussing the spectrum of the pre-main-sequence object one must remember that it is not directly visible, and that the observed spectrum is that of its associated reflection nebula; this nebula is extended, about 1000×1000; thus
the absolute fluxes measured with a 300slit are underestimated,
and modified by scattering. However, the equivalent widths of the lines, and most probably their FWHMs, are representative of those of the YSO.
Hα is the brightest and the broadest line of the observed spectrum. This line is very broad, about 800 km s−1from wing to wing, with a FWHM of 191 km s−1 (Fig. 8). The line is asymmetric. Absorption affects the blue side, as is clear from the following.
i) The emission peak (VLSR ∼ 6 km s−1) is shifted to the
red with respect to the center of the other more symmetric lines (VLSR∼ −23 km s−1for the Ca ii 8542 ˚A line).
ii) The red wing is more extended than the blue wing. The terminal velocity (∼ 400 km s−1) is of the same order as the
velocities measured in the optical jet by Ray et al. (1990). The equivalent width of the Hα line is 117 ˚A, comparable to that of the most extreme Herbig Ae/Be stars (Fikenzeller & Mundt 1984). The Hα luminosity is difficult to estimate; the measured Hα flux, corrected for a visual extinction in the range 7–10 mag (the extinction of the reflection nebula; see the justification in Sect. 6.1), gives an Hα luminosity between 6 and 60L , at least. This YSO is comparable to the brightest pre-main-sequence objects, observed by Levreault (1988), such as AFGL 490, V645 Cyg and MWC 1080.
The Paschen recombination lines, with a FWHM of about 140 km s−1, are not as broad as the Hα line. They indicate the
same central velocity as the Ca ii triplet lines and O i 8446 ˚A. The Paschen lines are probably optically thinner than Hα, prob-ing deeper regions situated at the base of the wind, closer to the
Fig. 7. Spectra of the two Hα emission objects around Hα and 8600 ˚A. For both spectral ranges the zero intensity level of the YSO is shifted by 500 units. Each spectrum shown is the sum of three observed spectra. The main lines are identified
accretion disk. The Ca ii triplet lines and O i 8446 ˚A, after cor-rection for the blended Paschen lines, are symmetric (Fig. 8). Their FWHMs are similar, about 100–110 km s−1. The Ca ii triplet lines are optically thick; for optically thin emission the 8498 ˚A, 8542 ˚A, and the 8662 ˚A line intensities are in the ratios 1:9:5 (Herbig & Soderblom 1980), whereas in AFGL 4029 the observed intensities are in the ratios 1:1.3:1.4. The O i 8446 ˚A emission is strong, and is probably due to Lyβ fluorescence. As discussed in ZDC, O i emission probably occurs in a dense H
i-H ii transition region, where hydrogen is only partially ionized. The similarity between the central velocities and the FWHMs of the Ca ii triplet lines and O i 8446 ˚A suggest that they are emit-ted in neighboring regions. In a circumstellar disk-plus-bipolar-wind picture, this region would lie close to the circumstellar disk.
Emission from several multiplets of Fe ii, especially Fe ii (13) and Fe ii (40), are present in the spectra. As for the
Table 3. Identifications and fluxes of the observed lines λ0 Identification Flux Wλ ( ˚A) (10−17erg s−1cm−2) ( ˚A) 6363.88 [O i] 142: 0.8: 6432.654 Fe ii (40) 139: 0.8: 6456.376 Fe ii (74) 193: 1.1: 6516.053 Fe ii (40) 185: 1.0: 6562.800 Hα 22460 117.1 8392.400 P20 596 1.6 8413.321 P19 634 1.7 8437.958 P18 996: 2.8: 8446.50 O i (4) 3700 10.3 8467.256 P17 968: 2.7: 8490: ? Fe ii 8490.11 ˚A, 8490.7 ˚A 135: 0.4: 8498.018 Ca ii (2) 4440 12.3 8502.487 P16 8542.049 Ca ii (2) 5633 15.6 8545.384 P15 8598.394 P14 1575 4.5 8617: ? [Fe ii] (13) 8616.96 ˚A 145: 0.4: 8662.140 Ca ii (2) 6184 17.4 8665.021 P13 8672: ? Fe ii 8672.22 ˚A 8680.4: ? N i 8680.28 ˚A 620 1.7 8683.5: ? N i 8683.40 ˚A 8686.9: ? N i 8686.15 ˚A 8702.7: ? N i 8703.25 ˚A 92: 0.3: 8712.9: ? N i 8711.70 ˚A 50: 0.1: 8727: ? [C i] 8727.4 ˚A 242: 0.65: 8750.475 P12 1754 4.9
most massive YSOs (Hamann & Persson 1992b), no Fe i lines are observed.
Several lines have been tentatively attributed to N i (3s4P –
34D0 transitions); the blend of three lines, at 8680 ˚A, 8683 ˚A,
and 8686 ˚A, is rather conspicuous; the lines at 8703 ˚A, and 8712 ˚A are probably present too. The presence of these N i lines indicates that we are dealing with a massive YSO; as shown by Hamann & Persson (1992b), these lines appear only in the spectra of early Herbig B stars, such as MWC 1080, LKHα348, MWC 137, and BD+40◦
4124. The same N i lines are observed in the spectrum of the compact H ii region around star 26. These lines are recombination lines emitted in the N+ region; they
indicate the presence of high energy photons, able to ionize nitrogen (14.5 eV). In the YSO they probably originate in the ionized stellar wind.
Fig. 8. Hα and Ca ii (8542 ˚A) line profiles (the Ca ii line has been corrected for the P15 emission). The narrow Hα line emitted by the compact H ii region is given for comparison. The dashed line at −39 km s−1indicates the mean velocity of the whole complex
A few weak lines, near 8490 ˚A, 8617 ˚A, and 8672 ˚A, are tentatively identified with permitted and forbidden iron. The line near 8727 ˚A is possibly [C i] 8727.4 ˚A.
5.4. Kinematics of the whole complex
Table 4 lists the velocities obtained for several components of the complex. Column 1 indicates the component, columns 2 and 3 give respectively the LSR velocities and the FWHMs of the lines (corrected for instrumental broadening), and column 4 gives the reference (except when the velocity is obtained from our spectra). Table 4 calls for a few comments, summarized in Fig. 9:
i) The extended H ii region and the molecular cloud IC 1848A have almost the same radial velocity, VLSR ∼
−38 km s−1; the velocity of the compact H ii region around
star 26 differs by a few kilometers per second, but this is per-haps not significant.
ii) The ionized gas near the ionization front flows away from the molecular material with a velocity of about 8 km s−1. (West
of IRS 1, the ionization front is seen edge-on and the ionized gas flows perpendicular to the line of sight. East of the compact HII region the front is nearly perpendicular to the line of sight and the ionized gas flows towards the observer.)
iii) IRS 1 (object 25) and close associated material display a large range of velocities. The nearly Gaussian lines (O i 8446 ˚A, Ca ii triplet lines, Paschen 12 and 14) emitted by IRS 1 and scattered by the nearby dust (in the reflection nebulosity), indi-cate a mean velocityVLSR∼ −23 km s−1; this differs by about
15 km s−1 from the mean velocity of the complex, but this is perhaps due to the velocity of the scattering dust grains. Neu-tral and ionized material, ejected in the stellar wind, show high velocities. The emission peak of the Hα line is redshifted by about 45 km s−1with respect to the mean velocity of the
Table 4. Kinematical observations VLSR FWHM References (km s−1) (km s−1) IC 1848 (extended H ii region) Hα −36.6 1 H166α −37.6 2 Hα −39.2 3 Hα −38.1 IC 1848A (molecular cloud)
CO −38.7 4
CO −38.9 5
NH3 −38.1,−38.0 6
H2O −33.3 6
CS −38.1 7
Compact H ii region around star 26 [NII] 6548A −35.5 Hα −34.6 [NII] 6583A −34.0 [S ii] 6716A −36.2 [S ii] 6731A −32.8 OI 8446A −39.1
Diffuse emission east of the compact H ii region Hα −45.8
[NII] 6583A −48.0
Ionization front west of AFGL 4029-IRS 1 (object 25) Hα −38.7
[NII] 6583A −40.7
Nebulosity illuminated by AFGL 4029-IRS 1 Hα peak +6 191 OI 8446A −23.3 106 CaII 8498A −25.3 108 CaII 8542A −23.8 114 CaII 8662A −21.8 102 P12 −23.0 140 P14 −21.8 141
1 Georgelin & Georgelin (1976) 2 Hart & Pedlar (1976) 3 Fich et al. (1990) 4 Loren & Wootten (1978) 5 Snell et al. (1988) 6 Churchwell et al. (1990) 7 Zinchenko et al. (1994)
about 110 km s−1for O i 8446 ˚A and the Ca ii triplet lines, to
140 km s−1for the Paschen lines, to 190 km s−1for Hα. The
extended wings of Hα indicate velocities up to 500 km s−1
(Fig. 8). Moreover, a highly collimated [S ii] optical jet ap-proaches the observer with velocities of up to 500 km s−1(Ray et al. 1990).
6. Discussion
6.1. The extinction in the direction of IRS 1 (object 25) and in that of its reflection nebula
Several indicators point to a high visual extinction towards the pre-main-sequence object IRS 1 (object 25): i) theJ − H
ver-Fig. 9. Sketch of the whole star forming region, giving the relative spatial positions of the components of the complex
susH − K diagram of Fig. 4 shows that object 25 is the most reddened object of the cluster, withAV ∼30 mag; ii) the
opti-cal depth of the silicates measured by Beichman (1979) in the direction of IRS 1,τ (9.7 µm)= 1.4 ± 0.2, indicates a visual ex-tinction of 23 ± 5 mag (assumingAV/τ (9.7 µm)= 16.6 ± 2.7,
Rieke & Lebofsky 1985); iii) we have observed the spectrum of IRS 1 in theH band with the CAMILA infrared camera, and find that the slope of the continuum corresponds to that of a B1V star with a visual extinction of about 30 mag.
The extinction in the direction of the reflection nebula is dif-ficult to estimate. AnAV of the order of 7 mag is derived from
the observed integratedB − V and V − R colors of the nebula, assuming an early spectral type for the illuminating object (be-tween B0 and B5). As discussed by Hamman & Persson (1992a), the optical veiling of the spectrum could lead to the extinction being underestimated, possibly by a few magnitudes. Further-more, as scattering is more effective inB than in R, we proba-bly again underestimate the extinction. The reddening can also be determined from the ratio of hydrogen recombination lines, assuming a normal interstellar reddening law (Mathis 1990), and emission by an optically thin case B plasma (Brocklehurst 1971). This method has been applied to YSOs and discussed by Kelly et al. (1994). Although the assumption of emission by an optically thin case B plasma is not verified, they show that the ratios of hydrogen recombination lines provide reliable reddening estimates, even in heavily obscured YSOs. From the observed Hα/P12 ratio, we derive an AV of the order of 10.5
mag for the reflection nebula.
A strongly anisotropic dust distribution is thus observed around IRS 1: a very high extinction,AV ∼30 mag, is found
for the central source, whereas a much lower extinction, AV
∼10 mag, is found for the neighboring reflection nebula. This increase of extinction along the line of sight to the illuminating source relative to the extinction of the extended scattered emis-sion accounts for the reddened near infrared colors of IRS 1 relative to those of the reflection nebula. The fact that the
blue-shifted optical jet and the reflection nebula are situated on the same side of IRS 1 indicate that stellar winds may be responsi-ble for the anisotropic distribution of material in its vicinity. We suggest that the reflection nebula is produced by dust situated within the walls of a cavity evacuated by the powerful wind of the YSO. Some scattered light emerges as a consequence of the disruption of the surrounding dense medium in the direction of the flow. A number of other infrared reflection nebulae present this morphology (Castelaz et al. 1985; Lenzen 1987; Rith et al. 1989; Kenyon et al. 1993; Anglada et al. 1995).
The scattered radiation probes material situated some 22 000 AU from IRS 1. What is the morphology of the region closer to IRS 1? Near infrared speckle observations of AFGL 4029-IRS 1 by Leinert et al. (1994) show a strong circumstellar halo of scattered light about 2000 AU in diameter; the “central” ob-ject obob-ject is considerably offset from the center of this halo, probably due to strong local extinction gradients. A similarly oriented anisotropy is thus observed both on a large and on a small scale. We are tempted to attribute this strong extinction gradient to the presence of a circumstellar disk around IRS 1. 6.2. Spectral energy distributions
Fig. 10 shows the SEDs (spectral energy distributions) of a few sources in the field. Their comparison suggests a few comments: 1. The coordinates of object 25 and of IRS 1 agree to within the uncertainties (Table 2). The SED of object 25 has been cor-rected for an extinctionAV = 25 mag. That of IRS 1, the
compact mid infrared source of Beichman (1979), has been corrected for the same 25 mag extinction. Fig. 10 shows that their SEDs are in good agreement. We conclude that object 25 and IRS 1 are simply the near infrared and mid infrared manifestations, respectively, of the same object.
2. In the near infrared, object 25 is 50 to 70 times more lumi-nous than a main-sequence B1 star.
3. The IRAS fluxes of IRAS 02575+6017 are given with no extinction correction. Snell et al. (1988) give an infrared luminosity of 21 103L
for this source. At 25µm, IRS 1
and IRS 2, the extended mid infrared source of Beichman (1979), contribute equally to IRAS 02575+6017 emission; IRS 1 is dominant shortward 25µm; IRS 2, which is cooler, is probably dominant longward. We suspect that both are high luminosity sources.
4. The SED of the reflection nebula is shown after correction forAV = 8 mag. Comparing its corrected near infrared flux
to the corrected flux of object 25 (AV = 25 mag) we see
that the nebula has about one fifteenth of the luminosity of object 25, its illuminating source. If the nebula were an isotropic scatterer of albedo = 1, then it would have to be illuminated by one fifteenth of object 25’s total luminosity, corresponding to a solid angle of 4π/15, e.g. a conical aper-ture of full opening angle 60◦. A lower albedo, or extinction
between object 25 and the reflection nebula, would tend to increase the required angle. This suggests that the flow is not strongly collimated. Poetzel et al. (1992) also found
ev-Fig. 10. Spectral energy distributions of a few objects in the field. The values of AV adopted for the extinction corrections are given in bracketts
idence of poorly collimated outflows in a number of high luminosity YSOs. This is in agreement with the model of Raga & Cabrit (1993) of molecular outflows driven by jet bowshocks.
5. IRS 1 ≡ object 25 has a strong infrared excess. Its SED is similar in shape to those of the “reflection sources” of Hamann & Persson (1992a). AFGL 4029-IRS 1 would be-long to the “Group II” of Hillenbrand et al. (1992), inter-pretated as stars or star/disk systems surrounded by an en-velope. Once again AFGL 4029-IRS 1 appears as a lumi-nous deeply embedded source, very similar to V645 Cyg or AFGL 490.
6. The SED of star 26, the probable exciting star of the compact H ii region, is shown with an AV correction of 8 mag. It
is similar to the SED of a B1V star. The SED of star 37, one of the most heavily reddened stars in the field, is given, corrected for anAV of 24 mag. The SEDs of stars 24 and
28 (not drawn) lie between those of stars 26 and 37.
The nature of IRS 2 is not clear. No near infrared object lies exactly in the direction given by Beichman. We think that IRS 2 corresponds to the dust associated with the compact H ii region, heated by the close group of stars 24+26+28+29. This would explain why IRS 2 is extended. Moreover, dust associated with an H ii region is expected to be cooler than dust associated with a YSO and, according to Beichman, IRS 2 is cooler than IRS 1. Another possibility is that IRS 2 is a very deeply embbeded object. Note that the non-detection of a massive YSO (similar to IRS 1) in theK0band implies a visual extinction in its direction
Table 5. Spectral properties of AFGL 4029-IRS 1 and MWC 1080 Line Wλ FWHM ( ˚A) (km s−1) IRS 1 MWC 1080 IRS 1 MWC 1080 Hα 117.1 120.2 191 221 O i (4) 10.3 10.4 106 107 Ca ii (2) 8498 ˚A 12.3 17.9 108 91 Ca ii (2) 8542 ˚A 15.6 20.9 114 110 Ca ii (2) 8662 ˚A 17.4 20.5 102 96 P14 4.5 6.7 141 161 P12 4.9 7 140 151
6.3. The stellar wind of IRS 1
The continuum radio emission of IRS 1 is probably due to an ionized wind. If this is the case, the radio continuum flux density obtained by Kurtz et al. (1994) for IRS 1 allows us to estimate its mass loss rate. For a fully ionized spherical wind, with a terminal velocity of 400±100 km s−1(estimated from the observed Hα
profile), we get ˙M = 7 ± 2 10−6 M yr−1 (Panagia 1991).
Panagia has established empirical correlations between the mass loss rate ˙M , the momentum flux ˙M v, the mechanical luminosity
1
2M v˙ 2, and the total luminosity of YSOs. The figures obtained
for IRS 1 confirm that it is a high luminosity object, of order of magnitude 104L .
Ray et al. (1990) derived a mass loss rate of ˙M = 3 10−6
M yr−1for the associated optical jet.
6.4. Comparison with other massive YSOs
In many respects – equivalent widths and FWHMs of all the emission lines – the spectrum of AFGL 4029-IRS 1 is strikingly similar to that of MWC 1080. Table 5 presents a comparison of the spectral properties of AFGL 4029-IRS 1 and of MWC 1080 (unpublished results). The only discrepancy concerns the shape of the emission lines: in MWC 1080, the Hα, Paschen, Fe ii, and O i lines present a P Cyg profile, whereas in AFGL 4029 only the Hα line clearly displays absorption on its blue side. The observed difference in the shape of the emission lines in MWC 1080 and AFGL 4029 is possibly due to a different position of the observer with respect to the objects’ circumstellar disks and bipolar outflows. We suggest that in the case of MWC 1080, the direction of the observer is very close to the outflow axis (this explains why MWC 1080 is optically visible) whereas for AFGL 4029 the outflow axis is at a slight angle to the line of sight, so that the circumstellar disk partly obscures the object (this explains why AFGL 4029 has a very high visual extinction and is not optically visible).
As for all massive YSOs, it is difficult to attribute a spectral type to MWC 1080; from its spectrum, Cohen & Kuhi (1979) es-timated the spectral type to be B0, whereas Yoshida et al. (1992) estimated it to be in the range A0–A3! Its spectral energy dis-tribution agrees better with a B0 spectral type, and a visual
ex-Fig. 11. Histogram of the visual extinction, for all the stellar objects detected in the J , H, and K0bands. The shaded area corresponds to stars lying at less than 5000from star 26
tinction of 5.3 mag (Hillenbrand et al. 1992; Hamann & Pers-son 1992a). MWC 1080 and AFGL 4029 are both associated with strong, extended, and almost isotropic molecular outflows. These flows are poorly collimated. Both are associated with optical jets (Poetzel et al. 1992, for MWC 1080).
According to Fig. 7 of Hamann and Persson (1992b), the high P12/Ca ii 8542 ˚A and O i/Ca ii 8542 ˚A ratios obtained for AFGL 4029-IRS 1 point to an early spectral type for this object (as for MWC 1080). This is confirmed by the presence of N I recombination lines in its spectrum. However, as noted before, AFGL 4029-IRS 1 is not associated with a classical compact H ii region, nor is MWC 1080. Their extended Hα emission is that of the ionized stellar wind reflected by the surrounding nebula.
6.5. Star formation in the AFGL 4029 cluster
The near infrared frames show that AFGL 4029 corresponds to a star cluster with a stellar density enhancement approximately centered on star 26 and its associated H ii region; the pre-main-sequence object 25, as well as a few other highly reddened stars lie (in projection) a few tenths of a parsec away. In the following we will assume that all stellar objects lying at less than 5000from
star 26, and affected by more than 5 mag of visual extinction, belong to the cluster and lie inside the molecular cloud. We assume that this cluster represents a spatially coherent episode of star formation. In the following we discuss its stellar content in terms of the initial mass function (IMF).
We further assume that all the stars, except object 25, are main-sequence stars and we use theK versus (J − K) color-magnitude diagram to estimate their spectral types and visual extinctions. Fig. 11 presents a histogram of the extinctions of all the stars observed inJ, H, and K0. As stressed before, the
extinction in this cluster is spread over a large range of values; Fig. 11 shows that several stars have anAV greater than 16 mag,
mentioned in Sect. 3.3, we are probably missing a few B0–B9 stars of high extinction.
We find that eight stars have spectral types between B0 and B3, and 21 stars between B3 and B9. The luminous pre-main-sequence object 25 can probably be considered as belonging to the B0–B3 group. If we use a power-law representation of the IMF,
dN
d(logM ) =kM
−α
, (1)
whereN is the number of stars of mass M formed per unit logarithmic mass interval, andk a constant, we find that the observed ratio
N (B0–B3) N (B3–B9) =
8 (or 9)
21 (2)
corresponds to an IMF of slopeα = 1.7. However we have seen before that we are possibly missing a few high extinction B stars, most probably the fainter B3-B9 stars. Thus our conclusion is that the stellar content of this very young cluster indicates an IMF of slopeα ≥ 1.7. This IMF is not significantly different from that determined in the solar neighborhood (Miller & Scalo 1979; Scalo 1986) and in OB associations in the Milky Way and the Magellanic Clouds (cf. Armand et al. 1992; Massey et al. 1995).
The 30 stars of the cluster earlier than B9 represent a com-bined mass of about 200 M . According to Miller & Scalo (1979), in the solar neighborhood the fraction of mass contained in stars more massive than B9 is about 22%. Thus if the IMF in AFGL 4029 is similar to that in the solar neighborhood, this star cluster has a total mass of about 900M . According to Loren & Wootten (1978) and Zinchenko et al. (1994), the mass of the IC 1848A molecular cloud is about 2000M . This shows that, in this cloud, about 10% of the gas has been transformed into B stars, and possibly as much as 30% of the gas has been trans-formed into stars. On a smaller scale, this situation is similar to that observed by Lada (1992) in the massive cores of the L 1630 cloud: a tight cluster of stars has formed in a single well defined massive molecular core with a high star formation efficiency. 6.6. Triggered star formation
Has star formation in the AFGL 4029 cluster been triggered by the expansion of the adjacent H ii region S 199? The structure of the molecular cloud IC 1848A in the vicinity of the ionization front (the bright rim of Fig. 1) has been studied by Wootten et al. (1983); CO observations have been obtained with an angular resolution of 3000
along an east-west direction going through the rim and the cluster. They show a peak of the temperature, density, and width of the CO emission lines at the position of the cluster, at about 0.75 pc from the rim; no small scale structure directly associated with the ionization front is observed. CS observations (Carpenter et al. 1993) confirm that high density molecular material does not lie close to the ionization front; the CS emission peaks between IRS 1 and the compact H ii region.
Sugitani et al. (1995) have observed in the near infrared a number of bright-rimmed clouds associated with IRAS sources. They find young clusters and say that they observe the propa-gation of star formation on a small scale, from the side of the star(s) exciting the bright rim and continuing towards the IRAS position. One argument is that there is a tendency for the bluer stars of the cluster (which they presume to be the older stars) to be located closer to the ionization front, and for the redder stars (the younger ones) to be closer to the IRAS position. The AFGL 4029 cluster is given as an example. We believe that the situation is more complex, as star colors can well be dominated by extinction; this is clearly the case for AFGL 4029. Two of the cluster’s “old” blue stars (according to Sugitani et al.), located near the ionization front, are our stars 51 and 53, which are low extinction stars, probably situated in front of the molecular cloud and unrelated to the young cluster. Note that another of their blue stars, our star 2, lies close to the red stars.
If the expansion of the H ii region S 199 had, alone, triggered star formation inside the molecular cloud IC 1848A, one would expect the oldest object to be the closest to the ionization front. This is clearly not the case as IRS 1, which lies between the ionization front and the ultracompact H ii region excited by star 26, appears to be the youngest stellar object observed. The stars associated with the compact H ii region present a range of stellar masses which probably encompasses the mass of IRS 1. Thus if IRS 1 was formed at the same time it would have evolved more quickly than the less massive of these stars. However, it is the only object of the field that presents all the characteristics of a YSO.
Thus in this zone star formation has not progressed from west to east (from the H ii region S 199 to the molecular cloud IC 1848A), as the youngest object in the cluster, IRS 1, is also the closest to the bright rim. One possibility is that the expansion of S 199 first triggered the formation of the cluster associated with the ultracompact H ii region, and that these massive stars then triggered the formation of AFGL 4029-IRS 1 (in a layer compressed between the two H ii regions).
7. Conclusions
AFGL 4029 is an archetype as it contains all the ingredients one can find in a star forming region: a luminous red YSO, in-visible in the optical, associated with a cluster of massive red stars; an optical and infrared reflection nebula; a high velocity ionized stellar wind; a molecular outflow; an optical jet; and a bright H2 emission knot. Moreover, because all these
ingredi-ents are found at the very center of the same molecular cloud, AFGL 4029 is also a very complicated region which can be greatly misunderstood if observed at insufficient angular reso-lution. Where IRAS sees only one infrared source, we find the massive YSO AFGL 4029-IRS 1 and at least thirty B stars, one of which is young as it ionizes an ultracompact H ii region. The presence of the nearby reflection nebula complicates the inter-pretation of the observations. This nebula is dominant in the optical and even in the near infrared; inJ, the observed emis-sion of the reflection nebula still exceeds that of the illuminating
source IRS 1. At the same time, the presence of this reflection nebula is helpful, as all we know about the close vicinity of the YSO comes from the light scattered by dust in this nebula.
AFGL 4029 is a region where high mass stars have formed together, as part of a rich star cluster. This region also shows a high star formation efficiency, with about 10% of the mass of the parental cloud having been used to form B stars.
IRS 1 is a high luminosity (probably ≥ 104L ) young (≤
1.7 105yr) stellar object, similar in many respects to MWC 1080 but more deeply embedded (AV ≥25 mag). Like other massive
YSOs, it displays a strong ionized wind with a mass loss rate of '7 10−6M
yr−1, high terminal velocities of ' 400 km s−1
and a momentum flux of ' 2.8 10−3M
km s−1yr−1. These
figures are of the same order of magnitude as those determined by Ray et al. (1990) for the optical jet. The momentum fluxes and mechanical energies in the stellar wind and in the optical jet are much higher, by factors of 10 and 1000 respectively, than those of the CO outflow (Snell et al. 1988).
The nature of IRS 2, the second mid infrared source of the complex, is not well understood. Hot dust associated with the compact H ii region around star 26 is probably responsible for this emission. Studies beyond 10µm would be useful to be sure that IRS 2 is not a very deeply embedded object.
The surrounding molecular material has not been mapped with sufficient angular resolution. We suspect that it is very inhomogeneous as we observe large variations of the extinction over very small distances. We do not know with certainty which young object is at the origin of the observed molecular outflow; we suspect that this molecular outflow is associated with the most active object of the field, IRS 1, which drives the optical high velocity jet, and is probably also at the origin of the H2
condensation.
Acknowledgements. We thank C. Beichman for sending us his Ph.D. dissertation, and P.-O. Lagage for sending us 10 µm data of the region prior to publication. We thank our referee, T. Ray, for his pertinent comments. A. Zavagno is grateful for the financial support of an ESA fellowship.
References
Anglada G., Estalella R., Mauersberger R., Torrelles J.M., Rodriguez L.F., Canto J., Ho P.T.P., D’Alessio P., 1995, ApJ 443, 682 Armand C., Deharveng L., Caplan J., 1992, A&A 265, 504
Bachiller R., Terebey S., Jarrett T., Martin-Pintado J., Beichman C.A., Van Buren D., 1994, ApJ 437, 296
Bally J., Lada E.A., Lane A.P., 1993, ApJ 418, 322 Black J.H., Dalgarno A., 1976, ApJ 203, 132 Becker W., Fenkart R., 1971, A&AS 4, 241 Beichman C.A., 1979, Thesis, University of Hawaii Bessell M.S., 1979, PASP 91,589
Brocklehurst M., 1971, MNRAS 153,471
Carpenter J.M., Snell R.L., Schloerb F.P., 1990, ApJ 362, 147 Carpenter J.M., Snell R.L., Schloerb F.P., Skrutskie M.F., 1993, ApJ
407, 657
Castelaz M.W., Hackwell J.A., Grasdalen G.L., Gehrz R.D., Gullixson C., 1985, ApJ 290, 261
Chevalier C., Ilovaisky S.A., 1991, A&AS 90, 225
Christian C.A., Adams M., Barnes J.V., Butcher H., Hayes D.S., Churchwell E.,Walmsley C.M., Cesaroni R., 1990, A&AS 83, 119 Cohen M., Kuhi L.V., 1979, ApJS 41, 743
Cruz-Gonz´alez I., Carrasco L., Ruiz E., Salas L., Skrutskie M., Meyer M., Sotelo P., Barbosa F., Gutierrez L., Iriarte A., Cobos F., Bornal A., Sanchez B., Valdez J., Argelles S., Conconi P., 1994, SPIE, 2198, 774 (Instrum. in Astronomy VIII)
Davies C.J., Eisl¨offel J., 1995, A&A 300, 851
Dent W.R.F., Matthews H.E., Walther D.M., 1995, MNRAS in press Draine B.T., Roberge W.G., Dalgarno A., 1983, ApJ 264, 485 Draine B.T., Lee H.M., 1984, ApJ 285, 89
Feinstein A., Vazquez R.A., Benvenuto O.G., 1986, A&A 159, 223 Fich M., Treffers R.R., Dahl G.P., 1990, AJ 99, 622
Finkenzeller U., Mundt R., 1984, A&AS 55, 109
Georgelin Y.M., Georgelin Y.P., Roux S., 1973, A&A 25, 337 Georgelin Y.M., Georgelin Y.P., 1976, A&A 49, 57
Hamann F., Persson S.E., 1989, ApJ 339, 1078 Hamann F., Persson S.E., 1992a, ApJ 394, 628 Hamann F., Persson S.E., 1992b, ApJS 82, 285 Harris G.L.H., 1976, ApJS 30, 451
Hart L., Pedlar A., 1976, MNRAS 176, 135
Hartigan P., Curiel S., Raymond J., 1989, ApJ 347, L31 Herbig G.H., Soderblom D.R., 1980, ApJ 242, 628
Hillenbrand L.A., Strom S.E., Vrba F.J., Keene J., 1992, ApJ 397, 613 Hodapp W.K., 1994, ApJS 94, 615
Hollenback D., McKee C.F., 1989, ApJ 342, 306
Kelly D.M., Rieke G.H., Campbell B., 1994, ApJ 425, 231
Kenyon S.J., Whitney B.A., Gomez M., Hartmann L., 1993, ApJ 414, 773
Koornneef J., 1983, A&A 128, 84
Kurtz S., Churchwell E., Wood D.O.S., 1994, ApJS 91, 659 Lada E.A., 1992, ApJ 393, L25
Lada C.J., Adams F.C., 1992, ApJ 393, 278 L´eger A., Puget J.-L., 1984, A&A 137, L5
Leinert CH., Richichi A., Weitzel N., Haas M., 1994, ASP Conference Series, Vol. 62, 155
Leisawitz D., Bash F.N., Thaddeus P., 1989, ApJS 70,731 Lenzen R., 1987, A&A 173, 124
Levreault R.M., 1988, ApJ 330, 897
Li W., Evans II N.J., Harvey P.M., Colom´e C., 1994, ApJ 433, 199 Lightfoot J.F., Glencross W.M., 1986, MNRAS 221, 993
Loren R.B., Wootten H.A., 1978, ApJ 225, L81
Massey P., Lang C.C., DeGioia-Eastwood K., Garmany C.D., 1995, ApJ 483, 188
Mathis J.S., 1990, ARA&A 28, 37
Miller G.E., Scalo J.M., 1979, ApJS 41, 513 Moffat A.F.J., 1972, A&AS 7, 355
Moore C.E., 1959, A Multiplet Table of Astrophysical Interest, Nat.Bur.Standards, Washington (NBS Technical Note 36) Panagia N., 1991, The Physics of Star Formation and Early Stellar
Evolution, C.J. Lada & N.D. Kylafis (eds.), NATO ASI Ser., Ser. C, 342, 565
Pottasch S., 1956, B.A.N. 13, 77
Poetzel R., Mundt R., Ray T.P., 1992, A&A 262, 229
Price S.D., Walker R.G., 1976, The AFGL Four-color Infrared Sky Survey, AFGL TR-76-0208
Raga A., Cabrit S., 1993, A&A 278, 267
Ray T.P., Poetzel R., Solf J., Mundt R., 1990, ApJ 357, L45 Richer J.S., Hills R.E., Padman R., 1992, MNRAS 254, 525 Rieke G.H., Lebofsky M.J., 1985, ApJ 288, 618
Rith M., Tapia M., Rubio M., Rodriguez L.F., 1989, A&A 222, 211 Scalo J.M., 1986, Fundamentals of Cosmic Physics, Vol 11, 1 Sellgren K., 1984, ApJ 277, 623
Snell R.L., Huang Y.-L., Dickman R.L., Claussen M.J., 1988, ApJ 325, 853
Stetson P.B., 1987, PASP 99, 191
Strom, S.E., Strom K.M., Yost J., Carrasco L., Grasdalen G., 1972, ApJ 173, 353
Sugitani K., Fukui Y., Ogura K., 1991, ApJS 77, 59 Sugitani K., Tamura M., Ogura K., 1995, ApJ 455, L39
Thronson H.A., Thompson R.I., Harvey P.M., Rickard L.J., Tokunaga A.T., 1980, ApJ 242, 609
Wilking B.A., Harvey P.M., Lada C.J., Joy M., Doering C.R., 1984, ApJ 279, 291
Wootten A., Sargent A., Knapp G., Huggins P.J., 1983, ApJ 269, 147 Yoshida S., Kogure T., Nakano M., Tatematsu K., Wiramihardja S.D.,
1992, PASJ 44, 77
Zavagno A., Deharveng L., Caplan J., 1994, A&A 281, 491 (ZDC) Zealey W.J., Williams P.M., Sandell G., Taylor K.N.R., Ray T.P., 1992,
A&A 262, 570
Zinchenko I., Forsstr¨om V., Lapinov A., Mattila K., 1994, A&A 288, 601
This article was processed by the authors using Springer-Verlag LaTEX A&A style file L-AA version 3.

![Table 3. Identifications and fluxes of the observed lines λ 0 Identification Flux W λ ( ˚ A) (10 − 17 erg s − 1 cm − 2 ) ( ˚ A) 6363.88 [O i ] 142: 0.8: 6432.654 Fe ii (40) 139: 0.8: 6456.376 Fe ii (74) 193: 1.1: 6516.053 Fe ii (40) 185: 1.0: 6562.800 Hα 2](https://thumb-eu.123doks.com/thumbv2/123doknet/14771657.591532/12.918.452.831.61.324/table-identifications-fluxes-observed-lines-identification-flux-hα.webp)