An Assessment of Electric STOL Aircraft
by
Christopher B. Courtin
B.S.E, Mechanical and Aerospace Engineering,
Princeton University (2010)
Submitted to the Department of Aeronautics and Astronautics
in partial fulfillment of the requirements for the degree of
Master of Science in Aeronautics and Astronautics
at the
MASSACHUSETTS INSTITUTE OF TECHNOLOGY
September 2019
@
Massachusetts Institute of Technology 2019.
Author
...
Signaturer
Depprment of Aerona
Signatur
Certified by...
T. Wilson P
All rights reserved.
edacted
utics and Astronautics
August 31, 2019
e
redacted
R. John Hansman
rofessor in Aeronautics
Thesis Supervisor
Signature redacted
A ccepted by ...
...
MASSACHUSETS INTITUTE
Sertac Karaman
OFTECHNOLOGY
ssociate Professor of Aeronautics and Astronautics
OCT
09 2019
Chair, Graduate Program Committee
An Assessment of Electric STOL Aircraft
by
Christopher B. Courtin
Submitted to the Department of Aeronautics and Astronautics on August 22, 2019, in partial fulfillment of the
requirements for the degree of
Master of Science in Aeronautics and Astronautics
Abstract
Distributed electric propulsion (DEP) is an emerging set of technologies which en-able new vehicle configurations by allowing the efficient distribution of many smaller propulsors around the airframe. One application of this technology is to greatly en-hance the short takeoff and landing (STOL) capability of a fixed-wing aircraft. STOL aircraft may have advantages over vertical takeoff and land (VTOL) configurations being considered for urban passenger transport missions due to lower risk associated with the certification process and improved performance or reduced weight due to smaller required propulsion systems. To be useful for these missions, STOL vehicles require short-field performance competitive with vertical lift configurations.
One pathway to achieving this is by placing many electric motors and propellers along the leading edge of the wing, an arrangement referred to as a DEP blown wing. This arrangement increases the effective lift of the wing through interaction of the propeller slipstream with the trailing edge flap. Previous blown wing concepts, based on large propellers or turbine engines, were mechanically complex and adopted only for specialized applications.
A DEP blown wing offers a simpler and potentially more efficient way to enhance the high-lift capability of a wing, but the performance is not reliably predictable using existing theoretical or empirical methods.
A wind tunnel test of a representative 2D blown wing section was undertaken, and section lift coefficient values up to 9 were measured at moderate power settings. The results of this wind tunnel testing were used to predict the takeoff and landing performance of reference vehicles with wing and power loading representative of mod-ern GA aircraft. The results of this analysis suggest that a DEP blown wing may enable takeoff and landing ground rolls of less than 100 ft. Landing distance over a 50 ft obstacle is identified as the likely driver of runway requirements for a super-short takeoff and landing vehicle.
Thesis Supervisor: R. John Hansman Title: T. Wilson Professor in Aeronautics
Acknowledgments
First, I would like to thank my advisor Professor Hansman for his wisdom and advice during this project. I would also like to thank Professor Drela for all his patient guidance.
I am grateful to many at Aurora Flight Sciences, especially Tony Tao, Brian Yutko, and Alex Mozdzanowska, for their valuable advice and financial support of the project. I would also like to acknowledge the support of Ken Knopp and the FAA Joint University Program.
Thank you to all the members of ICAT, especially Clement, Jacquie, Nicolas and Parker, for making these last few years so enjoyable.
I would also like to acknowledge the contribution of the students in the vari-ous 16.82x classes who worked hard to advance the STOL concept, especially Dev Agrawal, Faisal As'ad, Blake Berk, Trevor Long, and Jackson Lubin for their efforts on the wind tunnel testing, as well as Dave Robertson for his cheerful support of those tests.
I am thankful for my parents, John and Sharon, and sisters, Allison and Kate, who have provided a lifetime of love and encouragement.
Finally, I am most grateful to my wife Alex, for being a constant and invaluable source of love, support, and joy.
Contents
1 Introduction 21
2 Background 25
2.1 Blown Lift Overview ... . 25
2.1.1 Mechanisms of Blown Lift . . . . 28
2.2 Thin Airfoil Theory Model of a Blown Wing . . . . 29
2.3 Key Flow Parameters . . . . 32
2.4 3D Corrections . . . . 35
3 2D Wind Tunnel Testing 39 3.1 Experimental Overview . . . . 39
3.1.1 Experimental Procedures . . . . 41
3.2 K ey R esults . . . . 43
3.3 Comparison With Theory . . . . 46
4 Performance of STOL Aircraft 49 4.1 A pproach . . . .. . 49
4.2 Takeoff and Landing Modeling . . . . 52
4.2.1 Takeoff Equations . . . . 52
4.2.2 Landing Equations . . . . 54
4.3 3D Polars . . . . 55
4.4 Expected Takeoff Performance . . . . 57
4.4.2 Takeoff Over a 50ft. Obstacle . . . . 4.5 Expected Landing Performance . . . . 4.5.1 Landing Ground Roll . . . . 4.5.2 Landing Over a 50ft. Obstacle . . . .
5 Conclusion
A Electric Aircraft Certification
A.1 Certification Pathways . . . . A.2 Emerging Electric Aircraft Architectures . . . . A.3 Preliminary Emerging Hazard Assessment . . . . A.3.1 Common Mode Power System Failure . . . . A.3.2 Battery Thermal Runaway . . . . A.3.3 Battery Energy Uncertainty . . . . A.3.4 Fly-By-Wire System Failure . . . . A.3.5 High Level Autonomy Failure . . . . A .3.6 Bird Strike . . . . A .4 Sum m ary . . . .
B Wind Tunnel Testing of a Blown Flap Wing B.1 Abstract ...
B.2 Nomenclature . . . . B.3 Introduction . . . . B.4 Blown Airfoil Theory . . . B.4.1 Physical Mechanism B.4.2 Vortex Sheet Model B.5 Methodology . . . . B.5.1 Test Parameters . . B.5.2 Test Rig . . . . B.5.3 Wing Section . . . B.5.4 Data Processing . . 62 64 67 69 75 79 80 83 88 89 96 98 100 103 104 106 109 109 109 111 112 112 112 115 115 116 117 119
B.5.5 Data best-fit functions . . . . 120
B .6 R esults . . . . 123
B.6.1 Force and Moment Coefficients . . . . 123
B.6.2 Wake Characterization . . . . 125
B .7 D iscussion . . . . 125
B.7.1 Force Coefficient Polars . . . . 125
B.7.2 Effect of Motor Axis Angle . . . . 126
B.7.3 Blown Wing Performance Relative to Hover . . . . 128
B.7.4 Separation of Upper Surface . . . . 129
B.7.5 Pitching Moment Behavior . . . . 130
B.8 Conclusion . . . . 130
B.9 Derivation of jet excess power coefficient . . . . 131
B.9.1 Load cell calibration matrix . . . . 132
List of Figures
1-1 Categorization of emerging electric aircraft architectures, based on method of lift generation and use of distributed electric propulsion.
Vehicle categories are described in Appendix A. . . . . 22
1-2 The NASA X-57 Maxwell will demonstrate the feasibility of distributed electric propulsion and enhanced cruise efficiency. Image from NASA
[1]
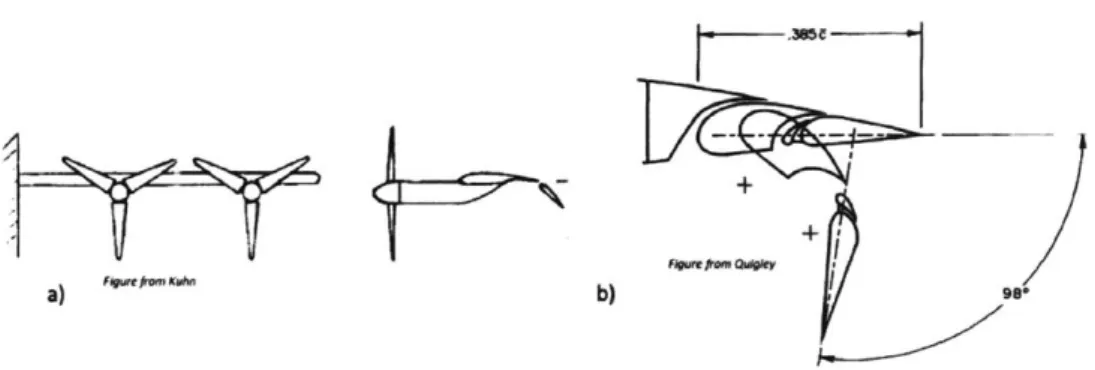
23 2-1 Methods of lift augmentation based on both propeller-wing interactions (a) and jet-wing interactions (b-d). a) from/,
b)-d) from3. . . 262-2 The Breuget 941 used a blown wing to achieve exceptional short-field perform ance. . . . . 26
2-3 a) Representative geometry from wind tunnel tests exploring blown wing performance. b) Landing flap configuration for the Breuget 941. a) from 4], b) from /5] . . . . 27
2-4 Actual blown airfoil flow (top), and vortex sheet model (bottom).Figure by M ark D rela . . . . 29
2-5 Jet sheet of finite thickness h, and vortex sheet model. The turning of the jet's momentum-excess AJ' implies an apparent pressure load on the vortex sheet.Figure by Mark Drela . . . . 30
2-6 Multiple propellers spaced along the leading edge generate a jet sheet of uniform height hd . . . . 33
2-7 Momentum theory model of jet contraction . . . . 33
3-1 Overview of the wind tunnel test setup. . . . . 40
3-3 Top view showing the wind tunnel data collection system layout . . . 41
3-4 ce, c, cm plotted against angle of attack for angle for various flap and
motor power settings. Points represent measured data and the lines represent the best-fit functions, for Acj between 0 and 4.5 in incre-ments of .5.Figure from /6] . . . . 45 3-5 c-c, polars, where points represent measured data and the lines
rep-resent the best-fit functions, for Acj between 0 and 4.5 in increments o f .5 . . . . . 4 6 3-6 A comparison between the measured ci values (points) and those
pre-dicted by an inviscid model based on thin airfoil theory (lines) . . . . 47 3-7 A comparison between the measured ce values and inviscid theory, with
the initial jet deflection angle reduced to account for inefficient turning ofthe flow . . . . . 48
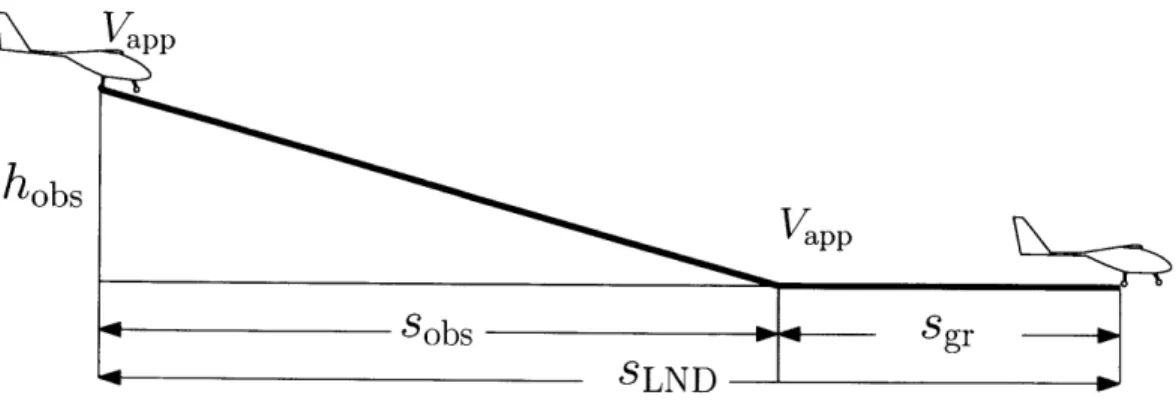
4-1 Overview of the aircraft takeoff distances . . . . 53 4-2 Overview of the aircraft landing distances . . . . 55 4-3 Wind tunnel data corrected for 3D effects, assuming blowing across
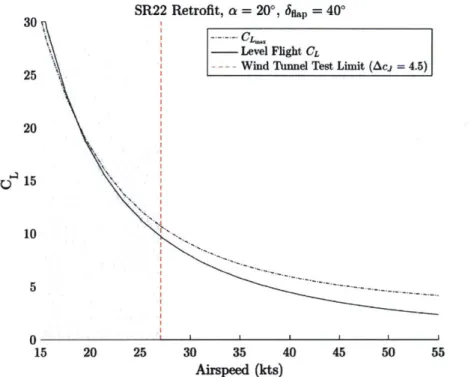
85% of the wing . . . . 56 4-4 In blown lift configurations, there is substantial variation of CL with
airspeed, which complicates takeoff and landing calculations . . . . . 58 4-5 Plot of the relationship between takeoff ground roll and design max
CL, for the SR22 retrofit with a blown wing. . . . . 60 4-6 Plot of the relationship between takeoff ground roll and design max
CL, for the enhanced STOL aircraft. . . . . 61 4-7 Plot of the relationship between takeoff ground roll and passenger
hor-izontal acceleration, for the enhanced STOL aircraft. . . . . 62 4-8 Plot of the relationship between takeoff distance over a 50 ft. obstacle
and design max CL, for the retrofit aircraft. . . . . 63 4-9 Plot of the relationship between takeoff distance over a 50 ft. obstacle
4-10 Variation of steepest achievable descent angle with increasing CL . . . 65 4-11 Variation of steepest achievable climb angle with increasing CL . . . . 66
4-12 Airspeed/flight path angle operational envelopes, for 0°,20,and 40° flap deflections. . . . . 67 4-13 Landing ground roll variation with flap deflection . . . . 68 4-14 Total landing distance over a 50 ft obstacle . . . . 69 4-15 Total landing distance, landing ground roll, and obstacle clearance
distance shown for the enhanced STOL configuration at two landing flap settings. . . . . 70
A-i Risk matrix showing high-(red), medium-(yellow), and low-(green) sever-ity risk areas. . . . . 82 A-2 Categorization of emerging electric aircraft architectures. . . . . 85 A-3 Key hazards for each electric aircraft configuration group, with a
base-line risk severity assessment for each. . . . . 90 A-4 Baseline risk severity associated with common mode power system
fail-ure for each vehicle architectfail-ure group. . . . . 91 A-5 The demonstrated (dark blue) and likely successful (light blue) parachute
deployment envelopes for a Cirrus SR20. . . . . 95 A-6 Battery thermal runaway presents a significant source of risk for any
all- electric aircraft architecture utilizing lithium-polymer batteries. . 97 A-7 The hazard severity rankings associated with battery energy
uncer-tainty reflect the increased probability that an all-electric vehicle will deplete its batteries before reaching its intended destination . . . . . 99 A-8 Unmitigated risk associated with fly-by-wire system failure. . . . . 102 A-9 There is uncertainty around the likelihood of bird strikes on low-altitude,
high-speed UAM vehicles that could increase the severity of this haz-ard . . . . 10 5
B-2 Jet sheet of finite thickness h, and vortex sheet model. The turning of the jet's momentum-excess AJ' implies an apparent pressure load on the vortex sheet. . . . . 113 B-3 Cross-section schematic of experimental set up. . . . 116 B-4 Photos of test rig. The left shows a front view of the setup, and the
right shows a closeup of the wake survey rake. . . . 116 B-5 CAD rendering of the wing sections displayed in side and rear isometric
view s. . . . 117 B-6 Two CAD renderings demonstrating the motor mount design. . . . . 118 B-7 Combined motor and propeller characterization test results. (a) Thrust
and electrical power coefficients, (b) Overall power efficiency curve of motor. Colors show the different angle of attacks of the motor relative to free stream . . . 121 B-8 c, c2, cm against angle of attack for 200 motor axis angle. Points
rep-resent collected data and the lines reprep-resent the best-fit functions (ex-plained in B.5.5) at constant Ac, plotted at Acj increments of 0.5. . 123 B-9 c, c2, cm against angle of attack for 10° motor axis angle. Points
rep-resent collected data and the lines reprep-resent the best-fit functions (ex-plained in B.5.5) at constant Ac, plotted at Acj increments of 0.5. . 124 B-10 Illustration depicting the alignment of 2D rake data plots to the
phys-ical m odel . . . 125 B-11 Wake profiles for (a) unpowered, and (b) powered wing at = 4. Both
profiles are at 6 = 200 and a = 0. The spanwise consistency demon-strates uniform jet profile. Projected motor locations are indicated w ith red lines. . . . 126 B-12 Vertical wake profile for (a) a = 00 and (b) a = 10. Both are at
of
= 200126B-13 cl-c polars for 100 motor axis angle. Points represent collected data,
lines are polynomial fit. . . . 127 B-14 ct-c polars for 20° motor axis angle. Points represent collected data,
B-15 cj - c. fit function polars for 6m = 100 and
m = 20°, for a ranging from
-50 to 23. The data points have been excluded for ease of visualization.128 B-16 Ratio of excess power in blown-lift to excess power of hovering for
equivalent thrust and disk area, at different flap angles and at a which m axim izes cf . . . . 129
List of Tables
3.1 Key geometric parameters of the wind tunnel model . . . . 41
3.2 Key wind tunnel test parameters . . . . 42
4.1 Key physical parameters for the reference aircraft. . . . . 50
4.2 Key performance parameters for the reference aircraft. . . . . 52
4.3 Takeoff Performance Summary . . . . 64
4.4 Takeoff and landing performance summary, showing calculated perfor-mance numbers and relative perforperfor-mance to the baseline or published data. All distances given in ft. . . . . 71
A.1 Hazard consequence is ranked based on the impact to passengers, crew, and aircraft
[71.
. . . . 82A.2 Quantitative definitions of differing likelihood levels based on the num-ber of passengers and engine numnum-ber and type.
[7].
. . . . 84A.3 Mitigation strategies for common mode power system failures . . . . 93
A.4 Mitigation strategies for battery thermal runaway . . . . 98
A.5 Mitigation strategies for battery energy uncertainty . . . . 99
A.6 Mitigation strategies for flight control system failures . . . 102
A.7 Mitigation strategies for bird strike . . . 106
B.1 Controlled Test Parameters . . . . 115
B.2 NRMSE of the fits cj generated for different 6f and
om
. . . . 122B.3 NRMSE of the c, fits generated for different
of
and m . . . . . 122B.5 cf fit coefficients . . . . 134 B.6 c,, fit coefficients . . . . 134
List of Symbols
span chord
2D jet energy coefficient 2D jet momentum coefficient
2D jet momentum-excess coefficient 2D jet mass flow coefficient
2D lift coefficient
2D pitching moment coefficient 2D net streamwise force coefficient
fraction of wing with blowing downstream jet height
effective jet height at propeller disk dynamic pressure
Distance
jet local velocity downwash velocity Wing aspect ratio
3D jet energy coefficient 3D jet momentum coefficient
3D jet momentum-excess coefficient 3D jet mass flow coefficient
3D lift coefficient b C CE CJ Acj CQ Cm CxM fb hd q =
jpV
2 a w AR CE ACs CQ CLCx D'I MTOW Re S T' TO Vo0 vJ W X=D-T a as
of
7 0 7 p p3D net streamwise force coefficient
Drag per span
Maximum takeoff weight Reynolds number
Wing reference area Thrust per span Static thrust freestream velocity jet velocity
weight
Net streamwise force angle of attack
induced angle at wing
far downstream induced angle flap deflection angle
efficiency
angle of streamline from the x-axis wake vortex strength
flight path angle streamline curvature density
Chapter 1
Introduction
Within the aviation industry there is currently widespread interest in the develop-ment of electric aircraft for a variety of missions. One significant way electric aircraft may differ from existing vehicles is in having primary propulsion systems comprised of many small propulsors distributed around the airframe, with power supplied elec-trically to each. The benefits of this concept, which is known as distributed electric propulsion or DEP, arise from increased design freedom and opportunities for bene-ficial aero-propulsive interactions [8]. Figure 1-1 shows an overview of the space of emerging electric aircraft architectures, grouped by the method of lift generation as well as whether or not they utilize DEP. Here, DEP defined as having more than four propulsors fed from a centralized energy storage system, which could be a battery, hybrid-electric generator, or some other alternative.
The performance benefits of DEP differ depending on the design mission of the vehicle. One mission of particular interest for electric vehicles is short-range passenger transport within and around major urban areas, using small aircraft operating off a distributed network of small takeoff and landing sites. This concept is commonly referred to as Urban Air Mobility (UAM)
19].
A defining requirement for UAM missions is the need to be able to take off and landing using ground infrastructure much shorter than a traditional runway. The exact size requirements are unclear but for most UAM concepts to be viable the required takeoff and landing area must be small enough that a useful number can
Tilting Hybrid Static Hybrid Conventional
Rotor Lift Lift Lift Blown Lift Wing
Few Propulsors Nocurrent
(1-3) L _ t
Image from Airbus Imagefrom Elytron Imagefromiaunt examples Im . m Pi-p Harr Helicopter Tilt-lift Static Hybrid Fixed Wing
Many
Propulsors (4+) '""efrom"Va" "pter htiiA.. D Blmo ne Imageif- irb u
DEP Blown
Multirotor DEP Tilt-lift Stopped Rotor Wing DEP Fixed Wing
Figure 1-1: Categorization of emerging electric aircraft architectures, based on method of lift generation and use of distributed electric propulsion. Vehicle cate-gories are described in Appendix A.
be placed in and around densely populated urban areas. This precludes the use of vehicles with conventional takeoff and landing (CTOL) capability [10].
It is widely assumed that adding vertical takeoff and landing (VTOL) capability is the only way to develop a vehicle with sufficiently small infrastructure demands, as vertical flight minimizes the ground area required J10][11]. Many VTOL aircraft being proposed for UAM missions use DEP to increase cruise efficiency, reduce mechanical complexity, and reduce noise. These typically fall under the Rotor Lift, Tilting Hybrid Lift, or Static Hybrid Lift columns of Figure 1-1. Because of this reliance on electric power distribution, the term eVTOL is common to describe this class of aircraft [12].
However, there are significant challenges associated with developing this new class of eVTOL aircraft. One is that VTOL capability requires large vertical lift systems, which add weight and reduce vehicle efficiency in other phases of flight
12].
This reduces the mission utility or increases the weight of the vehicle; vehicle weight is highly correlated with vehicle cost [13]. Another is that, as discussed in detail in Appendix A, eVTOL aircraft may face challenges during the FAA airworthiness cer-tification process due to the complexity of the required flight control systems and the potential for catastrophic loss of control in the event of a low-altitude power system failure.meet-ing the UAM mission requirements, referred to here as as Super-Short Takeoff and Landing (SSTOL) aircraft. In this configuration, which is similar to the NASA X-57 shown in Figure 1-2, the lifting capabilities of the wing are greatly enhanced by the beneficial interaction between the trailing edge flap and propellers distributed along the leading edge of the wing. The term "blown wing" or "blown lift" will to describe this system. This alternative use of DEP has, as this work will show, the potential to greatly reduce the runway requirements of a fixed wing aircraft, potentially to the point where SSTOL vehicles could be competitive with VTOL configurations.
The motivation for investigating the SSTOL concept comes from benefits re-lated to the performance and certifica-tion of these aircraft, compared to
eV-TOLs. Oneofthemainfindingsofthe Figure 1-2: The NASA X-57 Maxwell will demonstrate the feasibility of distributed certification analysis in Appendix A is electric propulsion and enhanced cruise ef-that fixed wing aircraft have lower cer- ficiency. Image from NASA [I]
tification risk associated with them than
eVTOL configurations, primarily because they avoid the control system complexity and loss of power hazard described above. While there are many systemic challenges to be overcome before a UAM system can be implemented, certification of new vehicle types is especially critical because it is a prerequisite for commercial operations at any scale [9]. Historically, this process is time-consuming and expensive, especially for novel vehicle configurations.
SSTOL aircraft are also expected to have improved utility or reduced weight and cost relative to eVTOLs, because of the lower required thrust-to-weight ratios and improved aerodynamic efficiency. The magnitude of these performance benefits are clearly dependent on the relationship between the power input to the blown wing and the resulting takeoff and landing performance of the vehicle. Currently, that relationship is not well understood for this class of aircraft. While power-augmented high-lift systems have been used on other types of aircraft as described in Chapter 2,
the methods developed to predict the performance of those vehicles do not extend reliably to the DEP blown lift concept.
The goal of the NASA X-57, which does have a DEP blown lift system, is to demonstrate the feasibility of DEP, as well as enhanced cruise efficiency by enabling a smaller wing without compromising takeoff and landing performance
[1].
Its runway requirements therefore will not be indicative of what may be possible with an aircraft designed for SSTOL performance. At the time of this writing, the X-57 is still under development and only preliminary results of ground tests of the high-lift system have been published [14].The goal of this thesis is to assess the potential of the SSTOL concept by combin-ing the results of a 2D wind tunnel test of a representative blown wcombin-ing section with established methods for preliminary estimates of takeoff and landing performance. The performance of reference aircraft with wing and power loading representative of typical GA vehicles will be assessed. This will give a first estimate of achievable runway requirements, as well as to highlight key trade-offs in the vehicle design and challenges that will have to be overcome to achieve reliable SSTOL performance. Chapter 2 provides background on the blown lift concept, and introduces theoretical models to predict the performance of a blown wing. Chapter 3 presents and overview and key findings of the blown lift wind tunnel testing, which is described more com-pletely in Appendix B. Chapter 4 uses the results of this testing to estimate the takeoff and landing performance of reference blown lift aircraft.
Chapter 2
Background
2.1
Blown Lift Overview
Several different systems have previously been developed where power added to a wing-flap system significantly increases the effective lift coefficient. In the existing literature such systems are generically termed "powered-lift" configurations
[15],
al-though the meaning of that term has evolved; currently it describes any aircraft with VTOL capability that is also capable of wing-borne flight [16].Lift-enhancing powered-lift systems can be broadly divided into two categories. The first uses interactions between the wing and the propeller slipstream to augment the lift of the wing. These systems are commonly called blown lift, blown wing, or deflected slipstream vehicles and are shown notionally in Figure 2-1(a). The second category uses the interaction of jet turbine exhaust gasses, bypass air, or high pressure bleed air with aerodynamic surfaces to provide the lift enhancement. These systems are often referred to as jet flaps, augmentor wings, or blown flaps. There are many different variants
[31;
three main ones are shown in Figure 2-1 (b)-(d).Propeller-wing interactions have been used to improve high-lift system perfor-mance on several aircraft concepts, perhaps most significantly the Breuget 941 STOL transport shown in Figure 2-2, which had total takeoff and landing distances of less than 850 ft over a 50 ft obstacle, at a gross weight of 40,800 lbs. There is also a substantial existing body of work focused on predicting the high-lift performance of
T .N
a) b) C) iOWNgueova d) DATNAuY M OWN
Figure from McCormick FiguresfromDATCOM J
Figure 2-1: Methods of lift augmentation based on both propeller-wing interactions (a) and jet-wing interactions (b-d). a) from /21, b)-d) from 3].
these systems, largely based on empirical wind tunnel test results [4]. [17] offers a good summary of different methods of modeling wing-propeller interactions.
For the best performance from a
blown lift vehicle, it is desirable to have blowing over as much of the span as possible. Because of the mechanical
complexity associated with having many
small engines in non-electric
configura-tions, previous blown lift aircraft have Figure 2-2: The Breuget 941 used a blown been restricted to the case where there wing to achieve exceptional short-field
per-formance. are one or two large propellers per
semi-span, and wind tunnel testing to date has
focused on these configurations. Figure 2-3 (a) shows a representative test setup from [4], which shows a typical test propeller size relative to the wing span and chord.
This testing identified the ratio of rotor diameter to flap chord as critical for the performance of a blown wing. When the rotor diameter is small relative to the flap chord, the slipstream is more effectively turned by the flap and the lifting performance is enhanced. This trades directly with the need to for the slipstream to cover the entire wing, which in the case of one or two propellers per semi-span can only be done with relatively large propellers.
To generate sufficient high lift and high drag on landing with these large propellers, large and complex flaps deflected to very high angles are required. Figure 2-3 (b) shows the double-slotted inboard flaps of the Breguet 941 in the landing configuration;
+i
a) b) 98•
Figure 2-3: a) Representative geometry from wind tunnel tests exploring blown wing performance. b) Landing flap configuration for the Breuget 941. a) from
[4],
b) from [5]the slots enhance the maximum deflection angle of the slipstream [4]. The need to descend at high power settings presents a particular challenge for blown lift aircraft, as high lift coefficients that are only achievable with large net thrust are not usable on landing.
Jet flaps, such as those shown in Figure 2-1 (b)-(d), offer an advantage over propeller-based systems in that the height of the jet can be quite small relative to the chord of the flap. This enables very efficient turning of the jet flow, or even direction control over the deflection angle in the case of the internally ducted jet flap, shown in Figure 2-1 b). This corresponds to higher lift for lower power settings, and as a consequence less excess thrust on landing. However, these systems are typically restricted to use on military aircraft because of weight, cost, and complexity, especially in the case where internal ducting of engine bleed air is required[181.
The DEP blown wing configuration proposed for SSTOL applications does not fit neatly into either category. It is not clear that existing blown wing test results, based on one or two propellers per semi-span, are applicable to the case where there are many small propellers arranged along the leading edge. In the limit where the propeller diameter is small compared to the flap chord, the performance of this system is expected closely approximate the performance of a jet flap [2]. Therefore, the main advantage of DEP blown wing is that it provides equivalent or superior performance to jet flap or deflected slipstream vehicles, without the complexity of internal ducting
or the requirement of large flap systems.
However, it is also unclear how well an array of small electric motors approximates jet flap performance. This uncertainty motivates the wind tunnel testing described in Chapter 3. The results of this test are compared to theoretical models that describe the idealized performance of the jet flap. While they are not able to capture all the relevant physical interactions that effect the performance of a blown lift system, they do offer useful insight into the key relationships between the various components of the system.
In the remainder of this chapter, Section 2.1.1 describes the physical mechanisms
by which blowing enhancing lift. Sections 2.2 and 2.3 develop a theoretical model
for the 2D section performance of a jet flap or DEP blown wing, and define key parameters that affect the system performance. Section 2.4 describes corrections to
2D data used to predict the performance of a finite-winged vehicle.
2.1.1
Mechanisms of Blown Lift
There are several physical mechanisms by which blowing augments the lift of the wing. The key similarity between all jet flap and blown wing configurations is the deflection of a high-momentum stream of air - the jet or propeller slipstream - downward from the trailing edge of the airfoil. After leaving the airfoil, this jet is turned from some initial jet deflection angle back towards the freestream. This turning coincides with a pressure difference between the upper and lower surfaces of the jet, which in turn further deflects the freestream flow. Because the jet can sustain this pressure load, the pressure differences between the upper and lower surface of the airfoil do not have to vanish at the trailing edge. Therefore, the lift of the airfoil is substantially increased [2].
Another significant mechanism which contributes to increased lift of blown wings or externally blown flaps is the delayed bursting of the main-element wake and the delayed separation of the flap boundary layer [19]. This effect is mainly achieved through the injection of the blowing jet's high total pressure flow through the flap gap. If there is sufficient flow over the airfoil upper surface, leading-edge separation is
21
also suppressed, allowing blown wings to achieve higher angles of attack and/or flap deflections.
In finite-wing vehicles, the jet does not ultimately align itself with the freestream but rather with the downwash far behind the wing. This flow turning produces a vertical force that also contributes to lift
12].
There are well-developed inviscid models for the performance of a jet flap, which account for the change in lift as a function of wing angle of attack, flap deflection, and jet momentum. While at high angles of attack or flap deflection angles the performance of a jet flap is dominated by viscous phenomena (separation) that this model can't capture, it is useful for developing a sense of the key physical relationships and defining parameters.
2.2
Thin Airfoil Theory Model of a Blown Wing
Actual Flow
fla angle
freestream ve y
jet angle at TE
total velocity jet height
Vortex Sheet Model 0 _-vortex-sheet velocity
z(x) camber
Svortex shee
Figure 2-4: Actual blown airfoil flow (top), and vortex sheet model (bottom).Figure by Mark Drela
Following the formulation of Thwaites
120]
and Spence [21], an airfoil with jet blowing can be modeled using a vortex sheet both over the airfoil and in the wake, as shown in Figure B-1. The vorticity in the wake arises from the curvature the jet, which has an initial trailing deflection angle 9TE = 6f and far downstream is aligned
which is associated with an external velocity increase across the wake. This can be modeled as an idealized velocity jump across a vortex sheet, as shown in Figure B-2. The strength of the wake vorticity is determined by the jet curvatureK = , which,
Actual Flow Model
P= n n
P / /
h di Y JE'
r
r
Figure 2-5: Jet sheet of finite thickness h, and vortex sheet model. The turning of the jet's momentum-excess AJ' implies an apparent pressure load on the vortex
sheet.Figure by Mark Drela
combined with the free-vortex velocity distribution u - 1/r within the jet, is related
to the velocity change within the jet Au.
AU = U1 -U2 = UaKh (2.1)
a= (ui + U2) is the average jet velocity. The external velocity jump AV can
be similarly defined.
AV = V1 - V2 (2.2)
The average external velocity Va= 1(Vi
+
V2) ~ ,Voo.Because the pressure is continuous across the jet boundaries, the pressure dif-ference in the external flow must be the same as the pressure difdif-ference across the jet.
(P2 - Piouter = (P2 - Pi)inner (2.3)
The velocity jumps can therefore be related using Bernoulli's equations, applied in both the inner flow and in the jet.
1 2 1
-U V2)= -pj(u -n) (2.4)
This equation can also be expressed in terms of velocity jumps and average velocity.
PVaAV = PJUasU = pJu 2Kh (2.5)
The wake vortex strength is related to the velocity jump by
(2.6) pju2 _y2
Y = AV - Vanh = a -a Kh PVa
where the Varh term represents the extrapolation of the effects of a vortex sheet at the wake centerline to its boundaries at a distance h/2.
Approximating Va V, renaming 'a as the jet velocity V, and defining the jet
momentum per span J' as
Ih/2
-h/2(2.7)
the expression for the vortex strength can be rewritten as
J' -pVh AJ'
V0 pV2 pxV2 (2.8)
where the term AJ compactly expresses the jet momentum-excess per span. This can be represented in terms of the dimensionless momentum-excess coefficient Ac
A J'
Acj = (2.9)
pxV2c
which allows Equation 2.8 to be approximated as
__- Acj dO
(2.10)
V... 2 dx
This identifies the parameter Acj as the critical parameter for determining the strength of the wake vorticity, and thus the effect of blowing on the lift and moments generated.
The streamline angle can be determined from the vortex strengths by
w(x) 1 j y (x') dx' Acj 1 °° d1 dx'
6(x) = a + = a +
+
-_ c (2.11)Vo0 27 00
Vo
x 2 27 dx' x'-xwhich is an integro-differential equation that in practice must be solved numerically using a discretized wake and airfoil geometry to determine the airfoil vortex sheet strength y and the wake curvature 0. Once these values are known, ci and cm can be determined by integration of the pressure difference across the wing.
Spence [21] presents an numerical solution to this equation for the case of a thin wing at small angles of attack. This is used to develop a linear approximation of ct based on a given angle of attack a, jet deflection angle 6f, and momentum coefficient
c, which shows close agreement with the numerically computed values.
C j (2.12)
pV2c
Poo 00 c
cj is closely related to Acj = cj - 2); in the limit where Vj >> Voo they areC, approximately equivalent. Spence's model is presented in Eqn. 2.13- 2.15.
ci = a + 6 F (2.13) Oa 86 F act = 27(1 + 0.151/cj + 0.219cj) (2.14) 8ci = 29rc (1 + 0.1519'2 + 0.139cj)2 (2.15)
2.3
Key Flow Parameters
This section defines additional dimensionless parameters useful for assessing the per-formance of a blown wing. In this model, the propellers are assumed to be spaced closely enough that they create a uniform jet over the entire blown portion of the wing. This is shown graphically in Figure 2-6, where the dashed line represents the effective jet height and the solid lines represent the propellers. The frontal area of
the jet is assumed to be the same as the area of height of the jet at the propeller disk hd is given
It is important to note that the downstream jet height hj will differ from the jet height at the propeller disk hd because of contraction of the propeller wake, shown notionally in Figure 2-7. This effect can be estimated from classical propeller momentum theory, which assumes a in-stantaneous pressure jump across the propeller disk 12].
the propellers, and so the effective by Equation 2.16.
-- - -- - - - -- ub --
j
hd
-b
Figure 2-6: Multiple propellers spaced along the leading edge gen-erate a jet sheet of uniform height
hd
Ahd
h
jPoo
VD
Ji P i Ataor DiskFigure 2-7: Momentum theory model of jet contraction
hd- brhub)Nprop "Irrrop (2.16)
Mass flow conservation along the jet
hd pdVD = hipVi (2.17)
can be combined with the classical momentum theory result
V vJ+V00
2 (2.18)
and the assumption of constant density throughout, which is valid for the low-speed cases being considered here, to give the relationship between jet height at the propeller
and far downstream.
h = 1( ° + 1)hd
2 Vi (2.19)
Similar to the jet momentum and momentum-excess coefficients defined in Equa-tions 2.12 and 2.9, the jet mass and energy flow coefficients can be defined.
CQ n - f2 P u dn_ h Vi.
l
hd VJpoVc pooVooc c Vo, 2 c
Vo
E' 2 f u3 dn hV3 V2
CE V3 1 3 CV3CQV2
2 poo c 2PooI c V V
(2.20)
(2.21)
It is also convenient to express cj and Acj in terms of the effective jet or disk height and velocity ratios, assuming constant density.
h jV2 hd(Vj Vo.
cj = 2--
---cVi c V V (2.22)
(2.23)
Acj is similar to the propeller thrust coefficient CT, which is given by
Equa-tion 2.24.
T' phiVi(Vi - Vo.) hi VJV
CT 2-(
)
1/2pV c 1/2pooV2c c V2 Voo (2.24)
Combining Equations 2.23 and 2.24 gives the ratio of Acj to CTas
Zacj V/oo
c V +
CT VJ (2.25)
which shows that the two are approximately equivalent in the limit where the jet velocity is much larger than the freestream Vj >> Voo.
In this highly-coupled system, it is ambiguous to separate thrust and drag as is done for conventional vehicles. Therefore, it is convenient to define the net streamwise for coefficient c, which can be measured directly, and avoids the ambiguities between
hi j2 hd ( Li2 oo
drag and thrust inherent in blown wing systems.
T' D'
Cx - CT - cd (2.26)
qc qc
2.4
3D Corrections
The models presented so far describe the performance of an ideal 2D wing section, with infinite span. To predict the performance of a finite wing, additional corrections are required. Two main effects are induced drag and additional jet lift, both of which are caused by the downwash due to shed vorticity in the wake, especially near the wingtips. Additionally, uniform blowing across the entire wing will be difficult to achieve in practice, especially at the fuselage attachment point. This will also reduce the performance of the system relative to the ideal 2D case.
A simple approach to these corrections, following the method of [22] and [23],
is presented here. This approach assumes a span efficiency e of the wing, a constant average downstream induced angle ais, and uniform blowing across a constant frac-tion of the wing fb. The wing chord and twist are also assumed to be constant across the span.
The lift of the airfoil is the sum of the lift from wing and jet sheet circulation Lc, as well as the lift from thrust LT. This is the vertical component of the jet momentum at some far downstream deflection angle ai,.
L = Lc + LT (2.27) 1 V b/2 Lc=-pV / cecdy (2.28) 2 J-b/2 LT = drhj Vj sinai, ~ b fb p h j V sinai,, (2.29) J-b/2
sources of drag.
X = Dc+Dp -T+DT (2.30)
Dc is the usual circulation-induced drag, DT is the increased drag or thrust re-duction associated with the downstream deflection of the jet and associated rere-duction in streamwise jet momentum. Dp is the profile drag, associated with losses due to skin friction and separation.
Dc pV2 c ci a dy (2.31)
2 J-b/2
DT = /2 dhiV(1 - cosai (2.32)
J b/2
Since this method will be applied to experimental data, it is useful to reformulate Equation 2.30 terms of a measured streamwise force Xmeas = Dp - T, which accounts
for the thrust and profile drag of the wing, as well as any interference drag, propeller effects, regions of separation, and losses associated with the jet deflection.
1 Pv b/2
Xmes = - pVI c c dy (2.33)
2 -b/2
X = Dc + Xmeas + DT (2.34)
In this case, X only describes the blown wing system. Additional drag terms to account for the rest of the airframe, as well as any additional non-interacting thrust sources, must be added to determine the total vehicle streamwise force. The section values of ct and cx are assumed to be known, either from theoretical predictions or experiment.
For convenience the 3D dimensionless jet performance coefficients are defined only over the fraction of the wing that has blowing over it, making them numerically equivalent to the section values for the blown sections.
C 1
f
cQcdy = Vih (2.35)1 jab/2 V2 hi C Sfff- cjcdy = 2 (2.36) Sf6 -166/2 V" C 1 fab/2 j hi CE Sf--- /CECdy = V 3 (2.37) Sf6 -_fb2 V C
The required shaft power Pshaf to develop a given Vj over the blown sections is therefore
1
Iffb/2
1PshaftT/p = 2pV (cE- C C 2 VcfbSref (CE- CQ)
-fab/2
(2.38)
The lift coefficient CLcdue to circulation can be calculated from the 2D cf mea-sured in the wind tunnel experiments, or predicted by theory. The lift due to thrust deflection CL, is an additional lift source that is not present in the wind tunnel experiments. The circulation-related lift and drag force coefficients are
CLC - Lc- I ccdy qS S Dc CDC qS-~ CLC e (2.39) (2.40)
If the wing chord and twist are constant along the span, CLc can be expressed in terms of the blowing fraction.
CLC (Cfb Cf,o (1- fb)) cOS2ai (2.41)
ce(a, 6f, ACj) is the 2D lift coefficient at the specified flight condition. cj(ag, 0)
is the lift of the wing section with zero blowing. The cos2 ai term represents the reduction in the apparent freestream at the wing due to large downwash angles aj. For typical wings these angles are small and so the change in apparent freestream is usually neglected.
The induced angle at the wing ai is given by
e CLC
and is related to the induced angle far downstream ai, by
a = 2ai-'
The thrust-related lift and drag coefficients are
LT CLT -qS DT CDT ~T qS C sin ai.fb ~
2 C
ai fb CJfb(1 - cos aci, ~ 2 Cj fb alCXmeas can also be represented based on fb
Cxmeas c fb + c,o (1 - fb) (2.46)
where cx(a, 6f, ACj) and cz(a, 6f, 0) are known from the section data. Defining
CD Dr + CD, Equation 2.34 becomes
CX = CX_, + CD ,. (2.47)
and the total CL is given by
CL = CLC + CLT (2.48)
These equations allow CL and Cx to be determined as a function of wing a, 6f,and Acj. In practice, because CL depends on ai and vice versa, some iteration is required to determine CL and CX for a specified flight condition.
These corrections are limited in their application as they do not consider the effect of varying spanwise induced angle, blowing, flap deflection, or chord/twist distribu-tions. All of those will be significant in an actual vehicle design. However, they are useful to obtain a preliminary estimate of the performance of a blown wing aircraft, especially at high power settings where blowing effects will dominate.
(2.43)
(2.44)
Chapter 3
2D Wind Tunnel Testing
This chapter describes results from wind tunnel testing to determine the performance of a blown wing with multiple propellers distributed along the span. The performance of the test article approximates the 2D section performance of a blown wing with a single-slotted trailing edge flap over a range of angles of attack, flap deflections, and blowing power settings. The results of the experiment described in this section were published in the paper Wind Tunnel Testing of a Blown Flap Wing [6], which provides a more complete description of the experimental setup and results and is included as Appendix B. A brief overview of the experiment and the results that are relevant to the subsequent analysis is provided here.
3.1
Experimental Overview
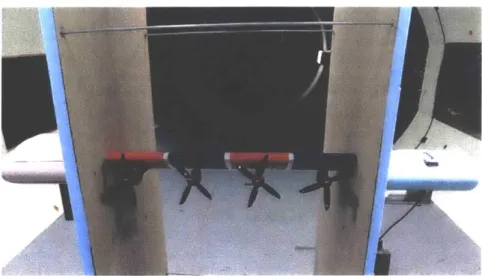
The goal of the wind tunnel testing was to measure how the wing lift, streamwise force, and pitching moment coefficients cj, c, and cm change with flap deflection, motor power, angle of attack, and other key parameters. In order to do this, a representative section of a blown wing was mounted in the MIT Wright Brothers Wing Tunnel, with endplates on either side to eliminate tip effects and approximate an ideal 2D flow. Figure 3-1 shows an overview of the experimental setup.
A cross section of the wing is shown in Figure 3-2. The wing is printed in PLA
No
Figure 3-1: Overview of the wind tunnel test setup.
c/4 point. The motor mounts were printed from ABS to prevent melting; the flap is also printed from PLA. The flap is not hinged but mounted using removable steel brackets. Changing the brackets allows different flap angles and gap geometries to be tested.
Figure 3-3 shows the layout of the
Mounting Spar
data collection system, which uses load cells to measure the lift, streamwise
Flap Bracket Flap
force, and moment generated by the
Motor Mount
blown lift system. The spar is mounted directly to the drag and lift load cells via a U-joint just outboard of the endplates.
Figure 3-2: Cross section of the wing test Ashaft collarconnectsoneendofthe article
moment arm to the spar. Force
mea-sured at the other end of the arm, by the moment load cell, is used to determine the wing pitching moment. Adjustment to the shaft collar changes the wing angle of attack. Key parameters of the motors, propellers, and model are shown in Ta-ble 3.1. The span of the test article is 23.9in, and the chord with flap retracted is a uniform 9 in. The motors used in the test were small motors designed for RC aircraft (T-Motor F40 Pro II), each of which has a maximum power of 750W. In practice, motor maximum power was not usable for testing because of excessive motor heating.
AIMM16-U-Joint IIhaft Collar
Pillow Block
X-Force Load Cell
Lift Load Cell Top View Moment Load Cell
End Plate Not to scale
Figure 3-3: Top view showing the wind tunnel data collection system layout
This limited the testable power range of the experiment to a maximum Acj ~ 4.5. Four-bladed COTS propellers were used (APC 5x4E-4), and 40A YEP ESCs were used for motor control. Table 3.1 describes the geometry of the test article. h C is the average jet height at the propeller disk as defined in Section 2.3.
Wing span 23.9 in cflap/C .38 Wing chord 9 in dprop/c .56
Flap chord 3.4 in hd/c .35
Prop. diameter 5 in Sef 215 in2
Cflap/dprop .68 hd/Cflap .93
Table 3.1: Key geometric parameters of the wind tunnel model
3.1.1
Experimental Procedures
The procedures for taking and reducing the data are summarized here; see Appendix B for a full description. Dimensional force and moment data was calculated from mea-suring load cell voltages, corrected using wind-off tare values and a calibration matrix generated based on known weights. Motor RPM was controlled via commanded PWM signal to the ESC, and measured via a stroboscope. Tunnel speed was calculated from measured dynamic pressure. Motor jet velocity was calculated curves of propeller thrust coefficient vs. advance ratio J - at the measured RPM. These curves were determined experimentally, using measured thrust of the same motor-propeller combination. Thrust and jet velocity are assumed to be related by the actuator disk relationship given in Equation 3.1. Angle of attack was measured directly from the
Variable Symbol Tested Range Angle of attack a - -10°to ~ 200
Flap deflection 6
flap 0,20,40,55,90 Jet momentum-excess AcJ 0 to 4.5
Freestream velocity Voc 17.4 kts Table 3.2: Key wind tunnel test parameters
model using an inclinometer. Due to play in the mounting joints when the shaft collar was tightened there was ~ 2.50 of movement possible in the angle of attack. Both the high and low value of angle of attack were measured. The actual angle of attack was taken to be either the high or the low end of the measured range, depending on the sign of the pitching moment (positive pitching moment was associated with higher angle of attack).The tested range of key independent variables is shown in Table 3.2.
T = AdiskPVJ(V - Voc) (3.1)
The motor control signal was set manually, based on a reading of the motor current. In practice, this meant that motor RPM varied between each test run, and hence the effective Acj values varied between runs. Since motor RPM was measured directly this did not introduce a new source of error into the experiment, but it complicated visualization of the data. For clarity, the results of this experiment were fit using a polynomial function described in Appendix B. Functions were fit to cf, c,, amd Cm based on a,Acj and 6f. In the following sections, experimental data is shown as points. The lines show the results of the polynomial fit for uniformly spaced Acj values, across the same range of angle of attack and flap deflections. No corrections were performed on the data for blockage or other wind tunnel effects. For a 2D test these effects are small, especially compared to the large ce and c. values being investigated
[241.
3.2
Key Results
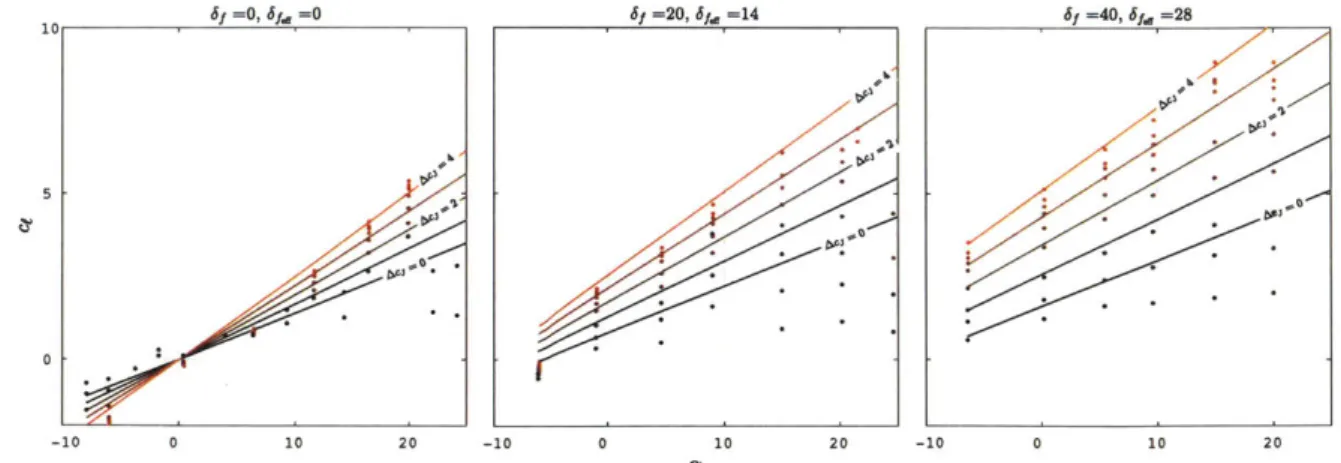
The main results of this study are shown in Figure B-9, which displays variations in
cilcx and cm across varying angles of attack, motor power settings, and flap deflections.
The measured data points are shown as the points in the various subfigures and the lines represent a polynomial fit to the data as described above.
Significant lift enhancement is shown to be possible with a DEP blown wing system, with maximum 2D lift coefficients up to 9 measured. There is a flap deflection which provides maximum lift enhancement; 40 deg in this case, above and below which the system is not as effective. It also shows that, at high angles of attack, there is an apparent increase in cx for constant motor power settings, i.e. an increase in drag. This is likely due to separation on the upper surface of the airfoil and flap, as well as other losses associated with the jet turning.
The increase of stall angle of attack with increased blowing is also observable, most clearly in the 0° polar. In the unblown case the stall angle appears to be around 100. As blowing power increases, the stall angle of the wing also increases. This is in agreement with predictions in literature
[15].
It is unclear from this data set if the wing is stalled at the highest blowing power, or if continued increase in angle of attack would increase lift further. This effect is also observable in the 20° and 40° data.There is also an interesting trend observable in the pitching moment data on the bottom row. It can be seen that when the flap is retracted, increasing motor power adds a positive (nose-up) pitching moment, due to the fact that the motors are located below the wing and that the flap is not significantly affecting the motor wake.
At higher flap deflections and angles of attack, this trend is reversed and increas-ing motor power increases the nose-down pitchincreas-ing moment, as it moves the airfoil center of pressure rearward through interactions with the flap. At very high angles of attack, the pitching moment rapidly changes towards a nose-up moment, likely to due separation of the the flow over the flap, which moves the center of pressure forward.
stall will present one challenge in the design of a SSTOL vehicle. The horizontal stabilizer must be large enough to trim out a wide range of large pitching moments. Additionally, significant trim changes or elevator inputs will be required near stall due to the moment sign reversal, which may adversely effect the handling qualities of a SSTOL aircraft. It is also expected that high blowing levels will have an effect on the horizontal tail effectiveness; this is an area for further research that is not captured in this study.
65 =20° 10 - f=0 5 0 0 .Ac= 4.5 2 0 0 -6 Ac = 4.5 0.4 A=45 -0.4 0 0 -0.8 -20 -10 0 10 20 65 =40° Ac 4.5 0 0 Ac,=4.5 0
06•
Ac=4.5 20 Ac,= 4.5 -10 0 10 20 -10 0 10 20 a 65 =55° Acj= 4.5 Ac 4.5 -10 0 10 20 -10 0 10 20 0 4.5 AcjFigure 3-4: ce, c, cm plotted against angle of attack for angle for various flap and motor power settings. Points represent measured data and the lines represent the best-fit functions, for Acj between 0 and 4.5 in increments of .5.Figure from /6]
6f =90 Ac,= 4.5 r4 , .0 Ac 4.5 0 0 Ac= 4.5 Ac,= 4.5 0 Acj= 4.5 I Ac= 4.5
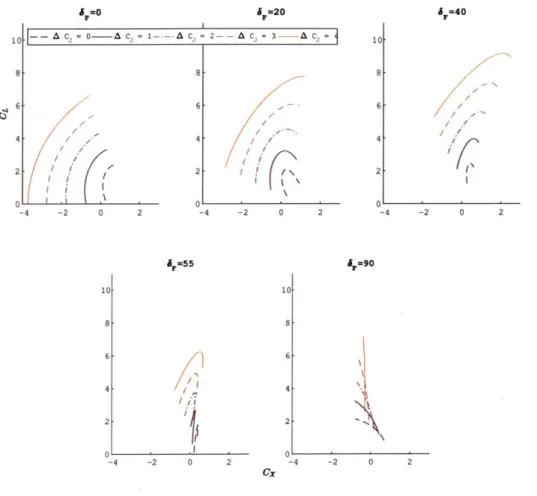
Figure B-13 shows another useful way to visualize this data, as a ce vs c, polar.
This shows that with the flap deflected, there are significant sources of drag associated with the blown wing. At 40 flap deflections, it is possible to generate high lift coefficients at high power settings with positive net drag, if the angle of attack is increased sufficiently. This is an important finding, as it suggests that blown lift is useful for both takeoff and landing, with moderate flap deflections.
6f =00 Acj= 4.5 . ' o0 -6 -4 -2 0 10 -5 a0 0 6f =20° 2 -6 8J =55 Ac,= 4.5 0 0 -4 -2 0 2 65 =900 5f =40° Ac,= 4.5 -6 -4 -2 cX 4.5 0 0 2 AcJ -6 -4 -2 0 2 -6 -4 -2 0 2
Figure 3-5: c-c polars, where points represent measured data and the lines represent the best-fit functions, for Acj between 0 and 4.5 in increments of .5.
3.3
Comparison With Theory
It is interesting to compare this data with the theoretical predictions described in Section 2.2, which describes the idealized performance of a jet flap. This comparison is shown in Figure 3-6, for 0°, 20°, and 40° degree flap deflections. In this case, the solid lines represent the theoretical prediction for the given flap, angle of attack, and
10 5 0 Ac,= 4.5 0 J'i Ac,= 4.5 •0