doi:10.1017/S0003055411000207
Horizontal Inequalities and Ethnonationalist Civil War:
A Global Comparison
LARS-ERIK CEDERMAN
ETH Z ¨urich
NILS B. WEIDMANN
Yale University
KRISTIAN SKREDE GLEDITSCH
University of Essex
C
ontemporary research on civil war has largely dismissed the role of political and economic grievances, focusing instead on opportunities for conflict. However, these strong claims rest on questionable theoretical and empirical grounds. Whereas scholars have examined primarily the relationship between individual inequality and conflict, we argue that horizontal inequalities between politically relevant ethnic groups and states at large can promote ethnonationalist conflict. Extending the empirical scope to the entire world, this article introduces a new spatial method that combines our newly geocoded data on ethnic groups’ settlement areas with spatial wealth estimates. Based on these methodological advances, we find that, in highly unequal societies, both rich and poor groups fight more often than those groups whose wealth lies closer to the country average. Our results remain robust to a number of alternative sample definitions and specifications.A
lthough logistical and power-related conditions—such as low state-level per capita income, weak state institutions, and peripheral and inaccessible territory—enjoy near-consensus sup-port as explanations of civil war onset, most of the contemporary literature regards explanations rooted in political and economic grievances with suspicion (Blattman and Miguel 2010). In fact, the debate over the status of grievances in such explanations dates back at least to the 1960s, with the introduction of relative deprivation theory. Inspired by psychological theories of conflict, Gurr (1970) and his colleagues argued that economic and other types of inequality increase the risk of internal strife through frustrated expectations. In contrast, today’s most influential quantitative studies of civil war give short shriftLars-Erik Cederman is Professor, Center for Comparative and In-ternational Studies, Swiss Federal Institute of Technology (ETH) Z ¨urich, IFW D 49.2, 8092 Z ¨urich, Switzerland ([email protected]). Nils B. Weidmann is Postdoctoral Fellow, Jackson Institute for Global Affairs, Yale University, P.O. Box 208206, New Haven, CT 06520 ([email protected]).
Kristian Skrede Gleditsch is Professor, Department of Govern-ment, University of Essex, Wivenhoe Park, Colchester, Essex, UK CO4 3SQ ([email protected]).
All authors are also affiliated with Centre for the Study of Civil War, PRIO, Oslo, Norway.
We thank the coeditors of the APSR, the anonymous reviewers, Carles Boix, David Cunningham, Kathleen Cunningham, Erik Me-lander, and Gudrun Østby for helpful comments and discussions, as well as participants in seminars at the Centre for the Study of Civil War, PRIO; the University of Arizona, the University of Z ¨urich; the Center of Comparative and International Studies, Z ¨urich; the University of Maryland; Yale University; and the 7th SGIR Pan-European International Relations Conference, Stockholm. Christa Deiwiks, Luc Girardin, and Julian Wucherpfennig offered crucial research support. Cederman acknowledges support from the Eu-ropean Science Foundation (06_ECRP_FP004) through the Swiss National Science Foundation (105511-116795). Weidmann acknowl-edges support from the Air Force Office of Scientific Research (Grant FA9550-09-1-0314). Gleditsch acknowledges the support of the European Science Foundation (06_ECRP_FP004) through the Economic and Social Research Council (RES-062-23-0259) and the Research Council of Norway (180441/V10).
to grievance-based accounts, based on reports that unequal individual wealth distributions have no statistically distinguishable relationship to internal conflict (e.g., Collier and Hoeffler 2004; Fearon and Laitin 2003).
Yet, despite these alleged nonfindings, the debate over grievances is far from dead. Indeed, inequality continues to occupy a prominent place in the qual-itative literature on civil wars and has repeatedly been linked to conflict processes (Sambanis 2005, 323; Stewart 2008b; Wood 2003). Moreover, in the last few years, some quantitative studies have started to appear that argue that the current literature’s failure to con-nect distributional asymmetries with conflict behavior may actually be due to inappropriate conceptualization and imperfect measurements, rather than reflecting a fundamental absence of any causal effect (Østby 2008b; see also Stewart 2008b).
Also relying on quantitative evidence, we join these recent contributions in shifting the explanatory focus from individualist to group-level accounts of inequal-ity and conflict. Because formidable problems of data availability associated with the uneven coverage and comparability of surveys have stood in the way of assessing such “horizontal inequalities” (HIs), most scholars have had to content themselves with selective case studies or statistical samples restricted to particu-lar world regions.
To overcome these difficulties, we combine our newly geocoded data on politically relevant ethnic groups’ settlement areas with Nordhaus’s (2006) spa-tial wealth measures, both with global coverage. Based on this novel strategy, we present the first truly world-wide comparison of horizontal inequality and ethnona-tionalist civil wars. Controlling for political power ac-cess, we show that both advanced and backward ethnic groups are more likely to experience such conflict than groups whose wealth lies closer to the national average. Moreover, in agreement with a broad conception of horizontal inequalities, we find that both political and economic inequalities contribute to civil war. Extensive
sensitivity analysis confirms that our findings are robust to various model specifications, alternative inequality measures, and sample definitions.
We proceed as follows: First, we review the extensive literature on inequality and conflict before narrowing down the scope to our own theoretical framework, which connects HIs with collective violence through grievance-based mechanisms. Based on this approach, we derive our main hypotheses on the effect of HIs on civil war onset. To test the hypotheses, we then introduce the datasets and describe our spatial method of wealth estimation in detail, including how to use the contours of the ethnic groups’ settlement areas as “cookie cutters,” which allows us to extract the rel-evant wealth estimates from the spatial wealth map. After specifying the variables used in our empirical analysis, we then expose the hypotheses to systematic tests in the main models, followed by another section that assesses the robustness of our findings. Finally, concluding at least tentatively that both economic and political inequality at the group level increase the risk of ethnonationalist civil war, we argue that the civil war literature’s tendency to downplay the importance of grievances as a source of internal conflict is both premature and misguided.
INEQUALITY IN THE CIVIL WAR
LITERATURE
Intimately related to issues of power and wealth dis-tribution in society, inequality plays a central role in classical theories of conflict. In an influential article, Davies (1962) argued that revolutions were motivated by frustration resulting from an evolving gap between individual aspirations and actual economic status. Also adopting an explicitly psychological perspective, Gurr’s (1970) well-known theory of relative deprivation char-acterizes various types of collective violence as reac-tions to frustrareac-tions stemming from unfulfilled aspira-tions, usually related to material well-being (see review in Brush 1996). Such a perspective differs radically from earlier sociological theories of mob behavior that explained collective violence as a societal pathology (e.g., Le Bon 1913). Instead, relative deprivation theo-rists argue that individuals’ widespread discontent with their social situation triggers conflict, especially where modernization fuels a “revolution of rising expecta-tions” (Davies 1962).
Although related indirectly to inequality through this psychological mechanism, relative deprivation the-ory does not explicitly focus on interpersonal or inter-group wealth comparisons (Hogg and Abrams 1988; Regan and Norton 2005; cf. Gurr and Duvall 1973). Other theories adopt a structural perspective, linking various types of inequality explicitly to structural im-balances in society, such as uneven income or land dis-tribution (Acemo ˘glu and Robinson 2005; Muller 1985; Muller and Seligson 1987; Russett 1964). Partly un-der the inspiration of Marxist principles, the literature on peasant rebellions explains violent collective action as a response to unequal wealth allocation (Moore
1966; Scott 1976). Frustrated with their lot, the peasant masses and other underprivileged groups are expected to take up arms as a way to seize power and redistribute wealth in their favor.
Relative deprivation theory remains perhaps the most prominent explanation that connects grievances with conflict, but has a very mixed record as regards em-pirical evidence (Brush 1996; Oberschall 1978). Early on, the theory attracted criticism from Snyder and Tilly (1972), who argued that opportunity-based mobi-lization rather than grievances causes internal conflict and revolutions. Contending that all societies contain a number of aggrieved and frustrated individuals, they did not think “there is any general connection between collective violence and hardship such that an observer could predict one from the other” (Tilly 1972, 520; see also Skocpol 1979; Tilly 1978). Along similar lines, a series of studies challenged the results pertaining to income inequality, which was usually seen as closely connected to the notion of relative deprivation (see, e.g., Weede 1987). By the end of the 1980s, the de-bate remained unresolved, with virtually all possible causal connections—negative, positive, curvilinear, or none—being represented in the literature (Lichbach 1989).
As the end of the Cold War brought with it a new wave of conflict, most of which was ethnonationally motivated, Gurr (1993, 2000a, 2000b) extended his previous theory and began to study ethnic minorities’ reactions to state-imposed disadvantages and discrim-ination. In agreement with Horowitz’ (1985) seminal study of ethnic groups in conflict, Gurr found that ethnic grievances contributed indirectly to collective violence through ethnic mobilization.
In contrast, the contemporary civil war literature has been pioneered by scholars who take issue with such reasoning. Positioning themselves explicitly against grievance-based theories in political science and sociol-ogy, Collier and Hoeffler (2004) follow in the footsteps of earlier critics of relative deprivation (although with-out referring to them explicitly). Very much as Snyder and Tilly had done three decades earlier, Collier and Hoeffler (2004, 564) point to the ubiquity of frustra-tion around the world, asserting that this fact deprives the theory of explanatory value: “Misperceptions of grievances may be very common: All societies may have groups with exaggerated grievances. In this case, as with greed-rebellion, motive would not explain the incidence of rebellion.” Explicitly classifying inequali-ties as grievance-related indicators, these authors rely on the Gini coefficient to measure the income distri-bution among individuals. Having found no statistical effect for this and other hardship proxies, Collier and Hoeffler feel vindicated in their wholesale rejection of grievances and inequality as causes of civil war. In his best-selling book The Bottom Billion, Collier (2007, 18) confirms these doubts:
So what causes civil war? Rebel movements themselves justify their actions in terms of a catalogue of grievances: repression, exploitation, exclusion. Politically motivated academics have piled in with their own hobbyhorses, which
usually cast rebels as heroes. I have come to distrust this discourse of grievances as self-serving.1
In another influential study that stresses political and institutional causes of civil war, Fearon and Laitin (2003) present findings that cast doubt on ethnic and political grievances as explanations of conflict onset. Like Collier and Hoeffler, Fearon and Laitin rely on a series of individual-level statistical proxies, includ-ing the Gini coefficient, which provide no evidence of economic inequality increasing the risk of conflict. Summing up these and other studies, Laitin (2007, 23) concludes that
ethnic grievances are commonly felt and latent; the factors that make these grievances vital and manifest differentiate the violent from the nonviolent cases. Ex ante measures of grievance levels are not good predictors of the transforma-tion of latent grievances into manifest ones. And it is the factors that turn latent grievances into violent action that should be considered as explanatory for that violence.
Despite these negative findings, a number of schol-ars find the rejection of grievances and inequalities premature. Although the poor quality of distributional economic data within and across countries should per-haps be reason for pause by itself,2 the main reason
that grievance-based arguments cannot be so easily re-jected is that these studies largely miss their theoretical target. Insisting that conflict-inducing inequality can-not be reduced to household-level measures of income distribution such as the Gini coefficient, Cramer (2003) calls for an alternative that is explicitly relational and theoretically grounded.3In the concluding chapter of a
two-volume compilation of case studies testing Collier and Hoeffler’s (2004) model, Sambanis (2005) draws the same inference. Noting that there is a major dis-crepancy between the quantitative nonfinding and the repeated references to inequality in the case studies, Sambanis (2005, 324) considers a number of explana-tions, including problems relating to interpretation and sampling of case evidence, as well as the fundamental issue of aggregation level:
There may exist a relationship between inequality and popular revolutions or class conflict, which is another rea-son to consider disaggregating the cases of civil war. But ethnic or secessionist wars should, in theory, be driven more by group-based inequality . . . than by interpersonal inequality.
A more promising way to capture the link between uneven wealth distributions and conflict has been pro-posed by Stewart (2008b) and her colleagues, who
1In more recent research, Collier, Hoeffler, and Rohner (2009) maintain that civil wars are caused by factors associated with “feasi-bility” rather than by grievances and other types of motivations. 2Using a different conceptualization of vertical inequality condi-tioned on factor mobility, Boix (2008) reports a strong effect on internal conflict.
3Likewise arguing against misplaced individualism, Cederman and Girardin (2007) criticize the use of the ethnolinguistic fractionaliza-tion index as a general proxy for ethnonafractionaliza-tionalist frustrafractionaliza-tion.
contrast vertical, or individual-level inequalities, with horizontal inequalities. Defining the latter as “inequal-ities in economic, social or political dimensions or cul-tural status between culcul-turally defined groups,” Stew-art (2008a, 3) argues that to a large extent, scholars have failed to find evidence of inequality’s war-causing effect because of their reliance on individualist, rather than group-based, measures of income and power dif-ferences:
But the majority of internal conflicts are organized group conflicts—they are neither exclusively nor primarily a mat-ter of individuals committing acts of violence against oth-ers. What is most often involved is group mobilization of people with particular shared identities or goals to attack others in the name of the group. (Stewart 2008a, 11)
Following the lead of Horowitz and Gurr, Stewart (2008a) conceptualizes horizontal inequality broadly by considering political, economic, social, and cultural dimensions explicitly. Political HIs entail blocked or limited access to central decision-making authority within the state. The economic dimension taps the dis-tribution of wealth among households. Social HI mea-sures primarily groups’ uneven social access, for exam-ple, in terms of education and societal status. Finally, the cultural aspect captures group-level inequalities with respect to cultural policies and symbols, including national holidays and religious rights.
Recognizing the difficulties of measuring HIs, Stew-art’s team has so far primarily relied on case stud-ies rather than large-N comparisons. The picture that emerges from this research suggests that both disad-vantaged and advanced groups have a higher likeli-hood of getting involved in internal conflict than groups closer to the country average (Stewart 2008b). Yet some quantitative researchers have attempted to gen-eralize from the case studies to a larger set of countries. In a pioneering statistical test, Barrows (1976) detected an influence of group-level differences on conflict in sub-Saharan Africa. Relying on household surveys conducted in 39 developing countries, Østby (2008b) finds evidence that social horizontal inequality causes civil war, although the economic dimension appears to be weaker (see also Østby 2008a). In a follow-up study based on geocoded conflict and survey data from sub-Saharan Africa, Østby, Nord ˚as, and Rød (2009) reach firmer conclusions, showing that both economic and social group-level differences are likely drivers of conflict behavior.
THEORIZING HORIZONTAL INEQUALITIES
We now turn to our own account of inequality and conflict. The starting point of our approach to ethnona-tionalist warfare is the realization that ethnic groups find themselves in radically different situations for var-ious historical reasons. Whereas some ethnic groups came out on top of the geopolitical game, others were conquered early on, and therefore lost out in the com-petition for wealth and influence. Moreover, the un-even spread of nationalism delayed mass-level political
mobilization in many parts of the world, thus creating differences in both economic and political develop-ment that were often exploited by alien rulers (Gellner 1964). As argued by Tilly (1999), nationalism can be thought of as a case of “categorical inequality” because
it asserts and creates paired and unequal categories, either (a) rival aspirants to nationhood or (b) members of the authentic nation versus others. It involves claims to prior control over a state, hence to the exclusion of others from that priority. It authorizes agents of the nation to subor-dinate, segregate, stigmatize, expel, or even exterminate others in the nation’s name. (172)
Adopting Stewart’s definition of HI, we focus on the political and economic dimensions of HI.4 Although
these two types of inequality are often likely to be related, we follow Stewart in treating the distribu-tion of power and of wealth as conceptually separate components. Previous quantitative research has exam-ined the role of political exclusion of ethnic groups on the risk of civil war, but has not considered explicitly the economic aspect of exclusion and the relationship between the two (see e.g., Cederman, Buhaug, and Rød 2009; Cederman and Girardin 2007; Cederman, Wimmer, and Min 2010; though see Gurr 1993, 2000b). By contrast, some critics of the role of ethnicity, such as Woodward (1995), argue that alleged ethnic conflicts are really driven by underlying economic inequalities that lead ethnic identities to become politicized. A strong version of this argument would hold that ethnic political inequalities are irrelevant in the absence of economic inequalities.
Building on our previous work, we view HIs as struc-tural asymmetries that make ethnonationalist civil war more likely and adopt an indirect research strategy that explains the effect of inequality by postulating a set of causal mechanisms. To close the gap between the struc-tural background conditions and behavioral patterns, we propose intermediate analytical steps.5 First, we postulate that objective political and economic asym-metries can be transformed into grievances through a process of group comparison driven by collective emo-tions. Second, we argue that such grievances trigger violent collective action through a process of group mobilization.
From Horizontal Inequalities to Grievances
As opposed to objective conditions such as horizontal inequalities, grievances are intersubjectively perceived phenomena. As we have noted earlier in the text, this makes them very hard to measure, but we can draw on an extensive experimentally supported literature
4As we have seen, HIs also involve social and cultural policies (see Stewart 2008a). We acknowledge that these aspects may be linked to conflict, but these conflict mechanisms fall outside the scope of this article.
5See Gurr (2000b, Chap. 3) for a similar theory based on four conditions, namely the salience of ethnocultural identity, collective incentives for action, collective-action capacity, and environmental opportunities.
in social psychology as a way to construct plausible mechanisms connecting structural asymmetries with collective violence. Obviously, it may be possible to find ways to connect HIs with conflict through causal mech-anisms that do not feature grievances, but we leave this possibility to other researchers to explore.6
Before grievances can be acted upon, they need to be cognitively linked to social identities through self-categorization (Hogg and Abrams 1988, 21). Clearly the salience of ethnic distinctions varies over time and from case to case (Gurr 2000b), but once group iden-tities become salient, members of the involved groups are prone to make social comparisons that hinge on the distinction between in-group and out-group categories (Turner 1981). According to “realistic conflict theory,” conflicting claims to scarce resources, including power, prestige, and wealth, are likely to produce ethnocen-tric and antagonistic intergroup relations (Tajfel and Turner 1979). In stratified social systems, social compar-ison reflecting superiority or inferiority should be es-pecially likely to trigger conflict (see Horowitz 1985).7 These processes of social comparison and intergroup evaluation are far from emotionally neutral. As argued by Kalyvas (2006) and Petersen (2002), attempts to reduce the violent excesses of civil wars to entirely calculative and cognitive processes fly in the face of countless testimonies of the emotional escalation pro-cesses leading to the outbreak of collective violence.8
In particular, violations of norms of justice and equal-ity will typically arouse feelings of anger and resent-ment among members of the disadvantaged group.9
As observed in a pioneering study by T. H. Marshall, such emotional responses are present in class systems, which “are based structurally on chronic asymmetries of power and reward” (Barbalet 1992, 153).
What is true for cases of class resentment also ap-plies to inequalities among ethnic groups. In agreement with Petersen (2002), we postulate that resentment based on intergroup comparisons involving HIs often
6It should be noted that the presence of HIs presupposes the ex-istence of well-defined groups (Stewart 2000), which is not a trivial precondition (e.g., Kalyvas 2006). Although it is undoubtedly true that modern politics is to a large extent group-based, and social life hinges on social categories (Gellner 1964; Hogg and Abrams 1988), we argue that the extent to which cohesive groups can actually be said to exist is ultimately a matter of empirical analysis. Yet, be-cause our goal is to evaluate the conflict-inducing effect of HIs, we join Horowitz (1985), Gurr (1993; 2000b) and others in adopting a self-consciously group-based framework, although restricting our substantive focus to groups defined through ethnic categorization rather than through other cleavages.
7In addition to such direct consequences of objective differences, “social identity theory” tells us that mere awareness of social out-groups may be sufficient to provoke competitive behavior even in the absence of objective issues of contention (Tajfel and Turner 1979). 8Indeed, although social identity theorists stress the cognitive com-ponent of group behavior, they allow for an important element of emotional engagement, as group membership is assumed to be inti-mately associated with self-esteem (Hogg and Abrams 1988). 9Modern sociological theories of emotions tell us that, contrary to the views of early crowd theorists, and contrary to lingering popular belief, emotions are not irrational, but serve distinctly goal-directed purposes in social and political life (e.g., Emirbayer and Goldberg 2005; Petersen 2002).
provokes ethnic mobilization. Inspired by Horowitz’s (1985) “positional psychology,” Petersen explains that “resentment is the feeling of being politically domi-nated by a group that has no right to be in a supe-rior position. It is the everyday experience of these perceived status relations that breeds the emotion” (40).
From Grievances to Collective Action
Clearly, emotions do not automatically trigger violent behavior. Under some institutional circumstances, re-dress can be sought through peaceful means (Hogg and Abrams 1988). Yet most governmental incumbents will only reluctantly abandon their advantaged positions by sharing power or letting minorities secede. Without resources and organization, anger alone can do little to challenge powerful defenders of the status quo (Tilly 1978). Moreover, since Olson’s classic treatment of the free-rider problem, we know that collective action cannot be taken for granted, especially where the costs incurred by volunteering individuals may be high (Lichbach 1995). However, there are good reasons to believe that the collective-action dilemma may have been overstated in the context of civil wars. As con-vincingly argued by Kalyvas and Kocher (2007), the existence of a dilemma hinges on the questionable as-sumption that participation in combat is costlier than nonparticipation. Although armed conflict undoubt-edly poses acute risks to members of rebel organiza-tions, there is no guarantee that staying away from the fighting is the safer option, especially where collat-eral violence affects civilians more than combatants, or where noncooperating civilians are at risk for targeted punishment for nonparticipation.
Collective-action theorists may object that punish-ment is also costly and should be subject to free riding, but experimental evidence shows that individuals are often more than willing to invest in costly punishment of free riders and norm violators (Fehr and G ¨achter 2000; see also references in Blattman and Miguel 2010). Thanks to preexisting social networks, ethnic groups may also provide organizational structure at the micro-level that can be used to overcome free riding (Hechter and Okamoto 2001). Moreover, a number of studies show that collective identities, such as those constitut-ing ethnic groups, facilitate collective action (e.g., Gates 2002; Simpson and Macy 2004).
Even though organizational and cognitive factors are central to mobilization, it would be a mis-take to overlook the contribution of emotionally charged grievances. Indeed, “emotional ties and invest-ments are a potential source of power in their own right, alongside social-structural sources of power” (Emirbayer and Goldberg 2005, 507). As we have seen, the perception of injustice generates grievances that serve as a formidable tool of recruitment. In addi-tion, detailed studies of social movements, including those that fight civil wars, demonstrate that “injustice frames” play a central role in mobilization processes and are reflected in organizations’ media messages
and grassroots participants’ justifications of action (Gamson 1992). Thus, rather than classifying inequality as a pure “grievance” factor, we view its impact as a mobilizational resource.
DERIVING TESTABLE HYPOTHESES
ON HORIZONTAL INEQUALITIES
AND CIVIL WAR
Having postulated our causal mechanisms, we now re-turn to the macro-level to perform the actual empirical analysis. It is in principle possible to measure directly grievances (Petersen 2002) and to trace mobilization processes (e.g., Beissinger 2002), but such detailed analysis is beyond the scope of the current study. As will become clear later, collecting and evaluating structural data on economic HIs is a major challenge in its own right.
What are the observable implications of our analyti-cal framework? The first, and most obvious, hypothesis expects a positive effect of economic HIs on civil war onset. If the causal chain operates as we have postu-lated, there should be a statistically discernible signal indicating that ethnic groups with GDP per capita far from a country’s average have a higher risk of experi-encing conflict:
H1. Economic HIs increase the likelihood of civil war.
However, as we have seen, an uneven wealth dis-tribution is not the only possible type of structural asymmetry. Drawing on Stewart’s multidimensional conceptualization of HIs, we hypothesize that both economic and political HIs contribute jointly to the outbreak of civil war. Even controlling for political HIs, such as groups’ exclusion from political power, income inequalities among ethnic groups should increase the risk of civil war. These theoretical expectations dove-tail with Stewart’s (2008a, 18) hypothesis that “political mobilization is especially likely when there are consis-tent HIs, that is both political and economic HIs run in the same direction.” Based on statistical evidence from sub-Saharan Africa, Østby (2008b) finds support for a strong effect of interaction between interregional asset inequality and political exclusion. Case studies of C ˆote d’Ivoire (Langer 2005) and Nepal (Murshed and Gates 2005) confirm this finding (see also Stewart, Brown, and Langer 2008, 289–90; cf. Hegre, Østby, and Raleigh 2009).10 Our second hypothesis summarizes
these theoretical expectations:
H2. Economic and political HIs both increase the
likeli-hood of civil war.
So far, we have not differentiated between advanced and backward groups’ conflict-proneness. As Horowitz
10See also Hechter’s (1975) notion of “internal colonialism.” Hechter argues that economically peripheral ethnic groups are less likely to become integrated in larger nation states and more likely to maintain or reinforce separate identities.
(1985) explains, arguments can be advanced for both types of economic HIs leading to a higher risk of con-flict. Poorer groups, especially those residing in back-ward and peripheral regions, often desire to break away from the cores of their countries regardless of the cost, because they perceive themselves to be systematically disadvantaged compared to their wealthier compatri-ots in terms of economic development and distribution of public goods. Perceptions of disadvantage also char-acterize members of some relatively wealthy groups, especially if they feel that state-level redistribution denies them the fruits of their success: “Advantaged regions usually generate more income and contribute more revenue to the treasury of the undivided state than they receive. They believe that they are subsidiz-ing poorer regions” (Horowitz 1985, 249–50). Because these groups have more to lose, and are sometimes demographically represented outside their original set-tlement areas, however, they can be more cost-sensitive as regards secession, but such cases do occur, as illus-trated by Slovenia and Croatia (cf. Gourevitch 1979). Nevertheless, there is no reason to assume that the ef-fect of group inequality is peref-fectly symmetric around relative equality. Remaining agnostic as to the relative frequency of HIs in either direction, we therefore sub-mit these arguments to separate tests by dividing H1 into two subhypotheses:
H1a. Relatively poor ethnic groups are more likely to
ex-perience civil war.
H1b. Relatively wealthy ethnic groups are more likely to
experience civil war.
GLOBAL DATA ON HORIZONTAL
INEQUALITIES AND OTHER DIMENSIONS
Our theoretical expectations must now be confronted with empirical evidence. As we have seen, data avail-ability constitutes a major stumbling block in studies of inequality and conflict. So far, virtually all exist-ing statistical studies of HIs have used survey data on economic welfare by households, as collected by the Demographic and Health Surveys (DHS) project.11
Although these data offer a relatively direct measure of well-being, and are therefore useful as grievance indicators, the information source and survey approach are associated with a number of practical limitations. The DHS project is limited to a selection primarily of developing countries, and information on ethnic af-filiation or the geographic location of households is only available in some of the surveys.12 Although the
surveys are constructed to be nationally representative, the number of responses for an ethnic group or loca-tion may often be very low, and there is no guarantee that the samples will be representative. Finally, survey
11For these data, see http://www.measuredhs.com/.
12See, e.g., Baldwin and Huber (2010), who draw on survey data from 46 countries to evaluate the impact of ethnic diversity on public goods provision. As noted earlier, Østby (2008a, 2008b) also uses survey data in her studies of HIs and conflict in sub-Saharan Africa (see also Østby, Nord ˚as, and Rød 2009).
data are subject to a host of potential response biases, both conscious and unconscious. For example, aggre-gate responses from surveys may well be systematically biased against finding evidence of inequality if poorer individuals overstate their assets and richer individuals consistently understate theirs. In sum, survey data may be helpful for many purposes, but the DHS data do not provide a plausible alternative for evaluating the role of horizontal inequalities on a global basis.
Given these difficulties, it makes sense to consider spatial datasets as an alternative to survey-based meth-ods. In fact, the only broadly available cross-national data source on variation in wealth within countries is the G-Econ data, developed by Nordhaus (2006; see also Nordhaus and Chen 2009).13The G-Econ dataset
tries to assemble the best available data on local economic activity within countries for geographical grid cells, and convert these to comparable figures in purchasing power parity to allow meaningful compar-isons. The resolution of the spatially explicit data set is 1◦ grid cells. The data are constructed from a variety of sources, including regional gross product data for the lowest available political subdivision, estimates of regional income by industry, and estimates of rural population and agricultural income. The specific methodologies differ by countries and data availability (see Nordhaus et al. 2006 for a detailed discussion). The database has global coverage, but the temporal scope is limited to a single year, 1990.14We therefore
restrict our analysis to the post–Cold War period, although we present supplementary results extending back to 1946 in the sensitivity analysis that follows. Because it is well known that relative inequality, as opposed to absolute wealth, is characterized by considerable inertia, these assumptions would seem plausible (Stewart and Langer 2008; Tilly 1999).15
Despite their relatively broad coverage, there are a number of disadvantages to the Nordhaus data for testing propositions on HIs. Any measure of the value of economic production is strictly speaking a “flow” measure and hence an imperfect proxy for the “stock” of wealth, although this criticism obviously applies with equal force to national-level productivity measures. Because the quality varies considerably across coun-tries, the data are likely to understate the extent of in-equality in countries with poor data coverage. Indeed, in some countries the official data may be of such poor quality that the variance is suppressed and accuracies
13Another promising avenue is to use light emissions as a proxy for economic activity; see, e.g., Min (2008). Chen and Nordhaus (2010) report that the usefulness of this data source may be mostly limited to cases where official statistics are especially poor.
14G-Econ 2.2 provides separate estimates for gross cell products in 1995 and 2000. A closer inspection of the documentation (see Chen 2008), however, indicates that these estimates simply adjust the 1990 estimates for updated population figures for 1995 and 2000. As such, the 1995 and 2000 figures contain no independent economic data over the 1990 values.
15Time-varying data from the Minorities at Risk (MAR) dataset and time series on the relative wealth of Yugoslav and Indian regions confirm that this is a reasonable assumption. See Sec-tion 1.5 of the supplemental online Appendix, available at http:// www.journals.cambridge.org/psr2011010.
of survey reports may be questionable. We will return to these issues in the section on sensitivity analyses.
Based on the G-Econ data, Buhaug et al. (n.d.) present the first global results on the relationship between spatial inequalities and civil war violence. However, their research design focuses on local mea-sures of inequality across geographic grid cells and the specific locations where conflict first breaks out, and does not capture group-level participation or wealth differences. Another useful approach estimates the wealth of regional subunits of states (Sambanis and Milanovic 2009). A more direct assessment of HIs re-quires geocoded data on ethnic groups, and in view of H2, also information about their access to executive power. Fortunately, the Ethnic Power Relations dataset (EPR), together with its recent geocoded extension, GeoEPR, fulfills these requirements.
The EPR dataset identifies all politically relevant ethnic groups around the world and measures how ac-cess to state power differs among them in all years from 1946 to 2005 (Cederman, Wimmer, and Min 2010). Based on an online expert survey, the sample includes 733 politically relevant ethnic groups in 155 sovereign states.16 The coding rules define as politically relevant
all ethnic groups for which at least one political or-ganization exists that promotes an ethnically oriented agenda in the national political arena, or ethnic groups that are subject to political discrimination. This dataset improves significantly on previous efforts to code eth-nic groups’ access to power, such as the Minorities at Risk (MAR) dataset (Gurr 1993), which restricts the sample to mobilized and/or discriminated-against mi-norities and thus largely overlooks the ethnopolitical constellation of power at the center, and Cederman and Girardin (2007), who rely on preliminary, static measures of the political status of ethnic groups and limit their sample to Eurasia and North Africa.
Because the politically relevant groups and their ac-cess to political power may change over time, the EPR dataset provides separate coding for subperiods from 1946 to 2005. For each such time period, the demo-graphic size and access to power enjoyed by repre-sentatives of an ethnic group are specified. Focusing on executive power only, i.e., representation in the presidency, the cabinet, and senior posts in the ad-ministration, including the army, the coding rules cate-gorize all politically relevant ethnic groups according to whether (1) their representatives enjoyed absolute power through monopoly or a dominant position in the executive branch,17 (2) they shared power with other
16The dataset includes all 155 sovereign states with a population of at least 1 million and a surface area of at least 5,000 square kilometers as of 2005. Countries in which no meaningful ethnic cleavage exists in national politics were coded as having no politically relevant ethnic groups and are thus not included in the group-level sample used in this article. See http://dvn.iq.harvard.edu/dvn/dv/epr. An updated version of the EPR and GeoEPR datasets valid through 2009 will be made available at http://www.icr.ethz.ch/data.
17As opposed to Monopoly, which excludes any executive represen-tation of other groups, Dominance applies to situations where elite members of the group hold dominant power in the executive but there is some limited inclusion of “token” members of other groups.
groups in a junior or senior role,18or (3) they were
ex-cluded altogether from executive decision making but enjoyed regional or separatist autonomy, or were pow-erless or discriminated against.19 In our analysis that
follows, we drop category 1, because according to our conflict coding, dominant and monopoly groups cannot by definition stage rebellions against themselves, and base the dummy variable of exclusion on the difference between categories 2 and 3.
To obtain spatial estimates of economic performance for EPR groups based on the Nordhaus grid, we need information on their settlement areas or regions. Be-cause this overlay operation requires data on the pre-cise extent of these regions rather than a simple textual description, existing datasets such as Minorities at Risk (Gurr 1993) are insufficient. We therefore rely on the recently completed GeoEPR dataset, a comprehensive geocoded version of the EPR groups (Wucherpfennig et al. n.d.). GeoEPR provides two types of informa-tion about ethnic groups. First, for each group in EPR, the dataset categorizes the type of settlement pattern, distinguishing between regional, urban, and migrant groups (plus mixed categories). For all groups with re-gional bases, GeoEPR represents the settlement area of a group as a polygon (or a set of polygons, if there is more than one group region in a country). In contrast to earlier geocoding attempts, GeoEPR also tracks major changes in the settlement pattern of a group over time, including those resulting from ethnic cleansing.
Our analysis requires conflict coding at the group level. Because groups as a whole typically do not par-ticipate in conflict (e.g., Kalyvas 2006), we use a re-fined procedure that codes whether a group has links to a rebel organization that was actively involved in fighting. These new data represent an improvement on previous group-level conflict coding used with the EPR data (cf. Cederman, Wimmer, and Min 2010). More precisely, we code our dependent variable as “1” if a rebel organization expresses its political aims (at least partly) in the name of the group and a significant number of members of the group were participating in the conflict. For a full sample of rebel groups and their conflict involvement, we rely on the Non-State Actors dataset (Cunningham, Gleditsch, and Salehyan 2009) that identifies the fighting organizations involved in civil wars (according to the Uppsala/PRIO Armed Conflicts Data, see Gleditsch et al. 2002). The link be-tween these organizations and our EPR groups is pro-vided by NSA2EPR, a new conflict resource that iden-tifies organizations fighting for, and recruiting from, particular EPR groups. We provide a list of the conflict onset cases in the article.
18A group is classified as playing a Senior or Junior role in a power-sharing regime depending on the relative importance of the positions controlled by group representatives.
19Regional Autonomy applies if the group is excluded but enjoys au-tonomous power at the regional level granted by the government. In the case of Separatist Autonomy, the group has unilaterally declared autonomy in opposition to the center. Powerless groups hold no political power at either the national or regional level. Discriminated-against groups are not only excluded but also subjected to targeted discrimination with the intent of excluding them from power.
FIGURE 1. G-Econ Cells for Yugoslavia, Overlaid with GeoEPR Group Polygons for Slovenes and Albanians
Note: The darker the shading, the wealthier the cells.
DERIVING OPERATIONAL MEASURES
The G-Econ data allow deriving ethnic group–specific measures of wealth by overlaying polygons indicating group settlement areas with the cells in the Nordhaus data. Dividing the total sum of the economic produc-tion in the settlement area by the group’s populaproduc-tion size enables us to derive group-specific measures of per capita economic production, which can be compared to either the nationwide per capita product or the per capita product of privileged groups.
A visual illustration helps explain the estimation of group GDP from Nordhaus data. Figure 1 shows the G-Econ estimates as gray cells; darker shadings indicate wealthier cells. The map shows the spatial variation in wealth across the Yugoslav federation in 1990, based on the CShapes dataset for the historical boundaries (Wei-dmann, Kuse, and Gleditsch 2010). Relatively wealthy pockets appear primarily in the northwest of the coun-try, in the constituent republics of Slovenia and Croatia. Compared to the other parts of the country, Serbia shows up as a generally poor region.
Together with the settlement areas of GeoEPR, the G-Econ data can now be used to estimate group wealth spatially. Figure 1 also shows the settlement regions for the Slovenes and the Albanians. Using techniques similar to those pioneered in Cederman, Buhaug, and Rød (2009), we derive an indicator of group wealth by summing up the (population-weighted) propor-tions of the Nordhaus cells covered by a group.20 For
20This spatial aggregation process retrieves all the G-Econ cells that are covered by a group polygon and computes the total wealth
FIGURE 2. Result of Spatial Wealth Estimation for Groups in Yugoslavia
example, as a result of this procedure, the Slovenes get a high score, because their settlement region is located in the rich parts of Yugoslavia. Figure 2 shows hori-zontal inequality for Yugoslavia, measured as the ratio of the group’s GDP per capita estimate to the aver-age value for the entire country, depicting wealthier groups in darker shades and poorer ones in brighter shades. Slovenes and Croats receive high scores, but the opposite is true for the Albanians in Kosovo, which are among the poorest groups in the country.
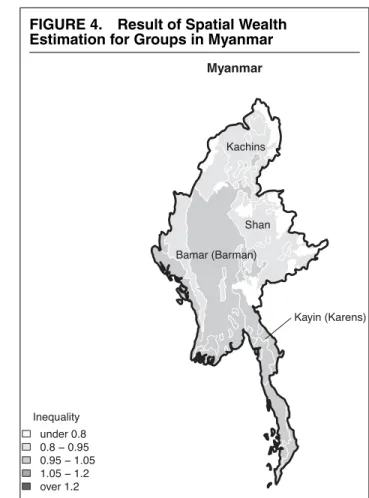
As a further illustration, Figure 3 shows the same information for the Sudan. Unsurprisingly, the south-ern and westsouth-ern groups, the latter including the Fur, emerge as the most impoverished in that state. Ex-tending the comparison to Myanmar, we also illus-trate the limitations of our spatial approach (see Figure 4). Despite considerable wealth discrepancies between peripheral and central areas, the Nordhaus data exhibit very limited variation, because of under-lying data quality issues. To the extent that similar measurement problems afflict other countries that
estimate as the sum of the cell values. However, in a number of cases cells do not align perfectly with group polygons, and there is only partial overlap between a cell and a group polygon. For these cases, only the overlapping area’s wealth should enter the group wealth computation. We estimate the wealth of a partial G-Econ cell by distributing its total value as given in the dataset to much finer cells of 2.5 arc-minutes (approximately 5 km, 1/24 of the size of a G-Econ cell). This distribution is population-weighted; i.e., it assumes that wealth is proportional to the number of peo-ple in each of the smaller cells. This weighting was done using the
Gridded Population of the World dataset (Version 3, available at
FIGURE 3. Result of Spatial Wealth Estimation for Groups in the Sudan
experienced conflict, we can expect the effect of in-equality to be underestimated by our study.
As explained by Mancini, Stewart, and Brown (2008), there are many different ways to operationalize horizontal inequalities, most of which apply to entire countries. In this article, we use two group-level mea-sures of inequality, namely a symmetric logged form (see H1) and an asymmetric, nonlogged form (see H1a, 1b). The former indicator defines inequality as the square of the logarithmized ratio between g, the GDP per capita of the ethnic group, and G, the average GDP per capita of all groups in the country:
lineq2= [log(g/G)]2.
This definition captures deviations from the country av-erage symmetrically and is zero for groups at the coun-try average. As a complement to this symmetric indi-cator, we also measure inequality asymmetrically with two variables that correspond to groups that are poorer and wealthier than the country average, respectively:
low ratio= G/g if g < G, 0 otherwise; high ratio= g/G if g > G,
0 otherwise.
This operationalization guarantees that deviations from the country mean are always positive numbers greater than one. For example, a group that is twice as
FIGURE 4. Result of Spatial Wealth Estimation for Groups in Myanmar
wealthy as the average has low_ratio= 0 and high_ratio = 2, and a group that is three times poorer has low_ratio = 3 and high_ratio = 0. See Table 1, which offers de-scriptive statistics for these indicators and all other in-dependent variables used in the analysis that follows.21
We use the nonspatial EPR dataset to derive vari-ables capturing political HIs and group sizes. As we have seen earlier, the EPR dataset provides a time-varying indicator for groups’ exclusion from central power. In addition, we measure the group’s demo-graphic power balance with the ethnic group(s) in power (EGIP) as its share of the dyadic population.22
We use a combination of the linear and squared terms to capture the logic of bargaining theory, according to which intermediate power levels are the most conflict-prone, given that weaker groups stand no chance of prevailing in contests, whereas stronger ones do not necessarily have to resort to violence to get concessions (see Wucherpfennig 2011).
At the country level, we control for GDP per capita, based on nonspatial, time-varying statistics drawn from
21We offer summary statistics for the restricted sample as used in Models 2–9. For summary statistics based on the unrestricted sample, see Section 1.6 in the supplemental online Appendix.
22Formally, denoting the populations of the group and the EGIP as
s and S, respectively, the power balance is defined as s/(s+S) if the
group is excluded, and as s/S otherwise. Small groups thus have close to a zero share of the dyadic population, whereas those groups that are larger than the EGIP have a power balance greater than 0.5.
TABLE 1. Summary Statistics for Independent Variables
Variable Mean Std. Dev. Min Max Inequality (lineq) −0.067 0.303 −1.799 1.207 Inequality (lineq2) 0.096 0.291 0.000 3.238 Ineq. (low_ratio) 0.766 0.766 0.000 6.046 Ineq. (high_ratio) 0.496 0.614 0.000 3.344 Excluded 0.528 0.499 0.000 1.000 Power balance 0.248 0.262 0.000 1.000 Power balance (sq.) 0.130 0.222 0.000 1.000 GDP per capita (log) 7.944 1.060 5.231 10.494 No. excluded groups 8.405 13.706 0.000 46.000 Year 1998.093 4.300 1991.000 2005.000 Peace years 34.421 18.118 0.000 59.000
the Penn World Tables and World Bank sources, and num_excl, the total number of excluded groups in the country, as defined by EPR. Both measures should have a negative impact on conflict probability. A large number of studies find a negative association between national GDP per capita and civil war onset (see Hegre and Sambanis 2006). According to Walter’s (2006) strategic argument, the num_excl variable can be ex-pected to be negatively related to the risk of conflict, because governments facing many ethnic groups fear domino effects and will thus be less willing to make concessions to single groups, as illustrated by Moscow’s hard line in dealing with the Chechens’ claims. This firmness can be expected to deter other groups from challenging the government. In addition, we also con-trol for the calendar year, because we anticipate a de-clining trend in terms of conflict probability during the Cold War, thanks to benign effects in the international environment such as peaceful international norms and institutions (Gurr 2000b). Finally, the models also con-tain nonparametric corrections for temporal depen-dence based on the peace_years variable, which mea-sures the number of years a group has lived in peace, as proposed by Beck, Katz, and Tucker (1998).23
EMPIRICAL ANALYSIS
We are now ready to present the results. Given the limited temporal availability of inequality data, we re-strict the sample to group years after the Cold War, from 1991 through 2005. All groups represented in GeoEPR are included, except the dispersed ones that cover their respective countries’ entire territory. This leaves us with about 450 groups per year or a total of 6,438 group years, with only 52 conflict onsets (see the supplemental online Appendix available at http://www. journals.cambridge.org/psr2011010). Unless otherwise stated, our analysis therefore relies on rare-events logit models. We compensate for country-level dependen-cies by estimating clustered standard errors.
Table 2 presents the main results. Our starting point is Model 1, which subjects the inequality hypothesis
23This method also features three cubic splines.
H1 to a first test based on the lineq2 variable. The result is both substantively and statistically significant, suggesting that groups with wealth levels far from the country average are indeed more likely to experience civil war.24 Moreover, the other variables behave as
expected. The coefficients of the variables measuring the demographic power balance point in the right di-rection, but fail to reach statistical significance. At the country level, both GDP per capita and calendar year have strongly negative effects on the probability of con-flict, as theoretically expected. The coefficient for the variable capturing the number of ethnic groups is also negative, but nowhere near statistical significance at conventional levels. Finally, the temporal controls do not seem to make much of a difference, but are retained for comparative purposes.
To improve the precision of our inequality measures, Model 2 discards ethnic groups with a spatially esti-mated population less than 500,000. Although this cen-soring limits the number of group-year observations to 3,967 and the conflict onsets to 42, we prefer to rely on this specification.25Our spatial method becomes unre-liable for small population sizes, primarily because of the low resolution of the G-Econ data and the limited precision of the population estimates for tiny groups.26
Consequently, the group-size restriction almost triples the inequality coefficient reported in Model 2 with-out affecting the size of the standard error. Except for this important change, there are few other surprises,
24We refrain from including the nonsquared term, because its effect cannot be separated from zero and should be nil according to H1. 25This sample restriction drops a number of tiny groups, especially in China and Russia, for which no reliable spatial estimate can be computed. See also Section 1.6 in the supplemental online Appendix for further details.
26Although the lack of comparable group-level data makes it dif-ficult to assess measurement error for the spatial GDP per capita estimates, it is possible to compare the spatial group-size values with those based on the EPR expert survey. By successively increasing the lower size threshold, it can be established that 500,000 is the value where the reduction in the standard deviation between spatial and nonspatial flattens out, thus suggesting that this threshold is appro-priate for population estimation. A further increase of the threshold would lead to serious information loss, thus making it difficult to discern the measured effect.
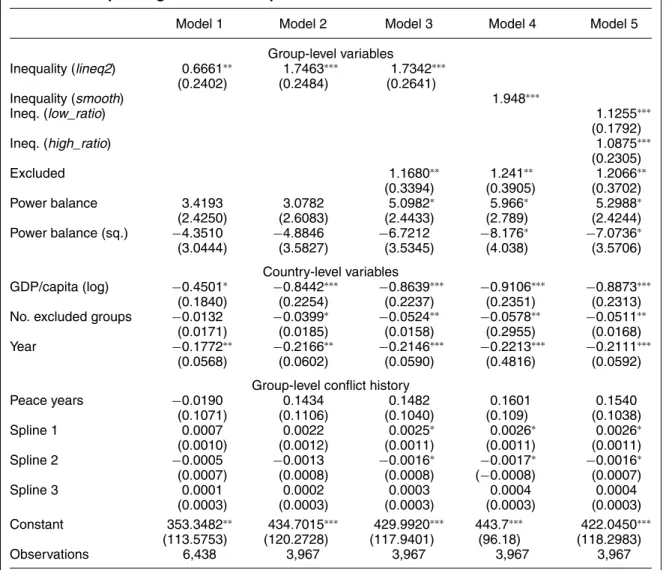
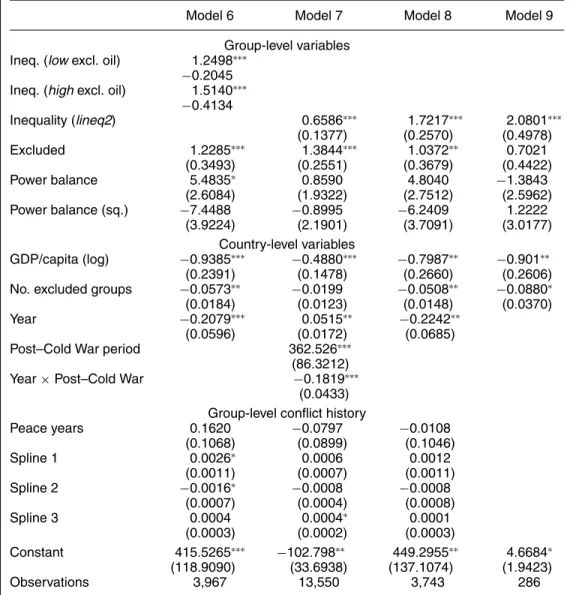
TABLE 2. Explaining Onset of Group-level Conflict
Model 1 Model 2 Model 3 Model 4 Model 5 Group-level variables Inequality (lineq2) 0.6661∗∗ 1.7463∗∗∗ 1.7342∗∗∗ (0.2402) (0.2484) (0.2641) Inequality (smooth) 1.948∗∗∗ Ineq. (low_ratio) 1.1255∗∗∗ (0.1792) Ineq. (high_ratio) 1.0875∗∗∗ (0.2305) Excluded 1.1680∗∗ 1.241∗∗ 1.2066∗∗ (0.3394) (0.3905) (0.3702) Power balance 3.4193 3.0782 5.0982∗ 5.966∗ 5.2988∗ (2.4250) (2.6083) (2.4433) (2.789) (2.4244) Power balance (sq.) −4.3510 −4.8846 −6.7212 −8.176∗ −7.0736∗ (3.0444) (3.5827) (3.5345) (4.038) (3.5706) Country-level variables GDP/capita (log) −0.4501∗ −0.8442∗∗∗ −0.8639∗∗∗ −0.9106∗∗∗ −0.8873∗∗∗ (0.1840) (0.2254) (0.2237) (0.2351) (0.2313) No. excluded groups −0.0132 −0.0399∗ −0.0524∗∗ −0.0578∗∗ −0.0511∗∗
(0.0171) (0.0185) (0.0158) (0.2955) (0.0168) Year −0.1772∗∗ −0.2166∗∗ −0.2146∗∗∗ −0.2213∗∗∗ −0.2111∗∗∗
(0.0568) (0.0602) (0.0590) (0.4816) (0.0592) Group-level conflict history
Peace years −0.0190 0.1434 0.1482 0.1601 0.1540 (0.1071) (0.1106) (0.1040) (0.109) (0.1038) Spline 1 0.0007 0.0022 0.0025∗ 0.0026∗ 0.0026∗ (0.0010) (0.0012) (0.0011) (0.0011) (0.0011) Spline 2 −0.0005 −0.0013 −0.0016∗ −0.0017∗ −0.0016∗ (0.0007) (0.0008) (0.0008) (−0.0008) (0.0007) Spline 3 0.0001 0.0002 0.0003 0.0004 0.0004 (0.0003) (0.0003) (0.0003) (0.0003) (0.0003) Constant 353.3482∗∗ 434.7015∗∗∗ 429.9920∗∗∗ 443.7∗∗∗ 422.0450∗∗∗ (113.5753) (120.2728) (117.9401) (96.18) (118.2983) Observations 6,438 3,967 3,967 3,967 3,967
Notes:Robust, country-clustered standard errors in parentheses. ∗∗∗p< .001.∗∗p< .01.∗p< .05.
except that the coefficient for the num_excl variable now becomes significant.
Having considered H1, we now test H2, which pos-tulates that both economic and political HIs increase the risk of internal conflict. Retaining the size restric-tion of the previous specificarestric-tion, Model 3 introduces a dummy variable for excluded groups that has a strong and statistically discernible impact on onset likelihood. However, this does not undermine the results with regard to economic inequality. This is an important result that strengthens our confidence that different types of grievances operate together and enables us to rule out the possibility that economic inequality could be an artifact of groups’ access to executive power (and vice versa). Moreover, it is clear that the addition of the exclusion dummy either preserves or increases the effect of the other variables.27 We illustrate the
effect of inequality in Figure 5, which indicates how
27Although both the inequality indicators and the exclusion dummy have a strong, independent effect in this model specification, adding a
the predicted probability of conflict increases as the group’s wealth level deviates from the country average in both directions, for a median observation for the post-1990 sample, for excluded and included groups, respectively. The figure reveals that, other things being equal, excluded groups (see the solid curve) are much more likely to experience conflict than included ones (see the dashed curve). However, the increases in risk from greater relative deviations in economic wealth are also substantial, especially for an excluded group, consistent with our argument that both political and economic grievances increase the risk of conflict.
So far we have made the simplifying, but question-able, assumption that the effect of inequality is the same for groups below and above the country’s average level of wealth. We therefore need to test Hypotheses
multiplicative interactive term does not yield a statistically significant coefficient. Inequality and exclusion appear to have additive effects, and the effect of one feature does not depend on the level of the other.
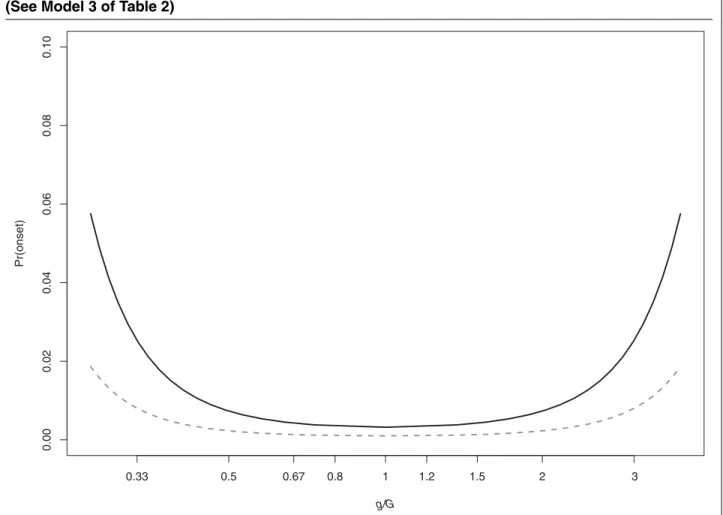
FIGURE 5. Predicted Effect of Horizontal Inequality on Probability of Civil War (See Model 3 of Table 2)
0.00 0.02 0.04 0.06 0.08 0.10 g/G Pr(onset) 0.33 0.5 0.67 0.8 1 1.2 1.5 2 3
Note: The solid line corresponds to a median profile for excluded groups; the dashed one to the median profile for included groups. The horizontal axis is on a log scale, with tick marks indicating specific values of theg/Gratio.
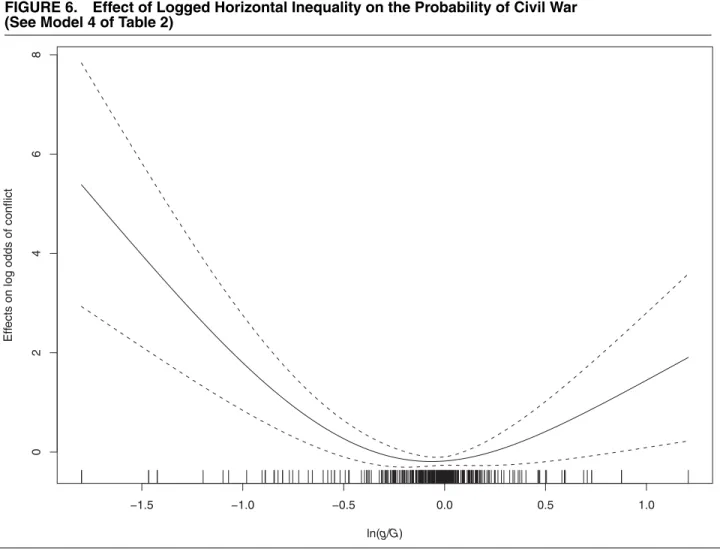
H1a and H1b separately. As a way to do so, Model 4 relaxes the assumption of a parabolic functional form by relying on a smoothed, spline-based local regression specification with three knots. Even if not perfectly symmetric, the estimated functional form shown in Fig-ure 6 tells us that both relatively poorer and wealthier groups are more likely to experience civil war, thus confirming both H1a and H1b. The error bands are relatively broad but clearly separate from zero, at least for the poorer groups.28
Further increasing our confidence in the separate effects, Model 5 uses the two linear ratio indicators low_ratio and high_ratio while still controlling for po-litical exclusion. The results are strongly positive for both directions of inequality, lending further support to H1a and H1b. With this model specification, the demographic measures of power balance also become significant in the expected direction. Furthermore, the impact of the control variables at the country level also becomes stronger compared to Model 3.
28Because Model 4 was estimated as a GAM in R without clustered standard errors, these cannot be directly compared with the other models.
SENSITIVITY ANALYSIS
Because the number of onsets is quite limited, our findings need to be treated with some caution. There-fore, the current section presents the results of sev-eral robustness checks. Table 3 introduces four mod-els that evaluate different sensitivity aspects. As noted earlier, the GDP per capita data used in the article include all economic activity, including exploitation of raw material. This in itself does not necessarily un-dermine a grievance interpretation, especially where disadvantaged groups are deprived of the riches ex-tracted from their homelands (Østby, Nord ˚as, and Rød 2009, 307; Stewart, Brown and Langer 2008, 346). Ex-amples include the Aceh in Indonesia (Ross 2005) and the Ijaw in Nigeria (Osaghae 2008). Although our data sources do not enable us to separate a pure grievance effect from the low_ratio and high_ratio ables, Model 6 reports the coefficients of these vari-ables, excluding wealth deriving from oil production, based on data from Nordhaus’s dataset. The results tell us that the conflict-proneness of wealthy groups is not primarily driven by oil income. In fact, once oil income has been subtracted, the coefficient of
FIGURE 6. Effect of Logged Horizontal Inequality on the Probability of Civil War (See Model 4 of Table 2)
−1.5 −1.0 −0.5 0.0 0.5 1.0
02468
ln(g/G)
Eff
ects on log odds of conflict
high_ratio increases considerably compared to that in Model 5.29
We continue the sensitivity analysis by extending the sample back to 1946. Although we prefer to base our conclusions on the period explicitly following the point of measurement, this backward projection of inequal-ity values is not completely unreasonable, because of the already noted durability of inequality. In any case, this rough robustness test tells us whether the findings should be seen as an artifact of the post–Cold War sam-ple or whether they can be potentially generalized be-yond this time period. Extending the sample of Model 3 to the entire post-WWII period, Model 7 reveals that the main inequality result holds in this case as well.30
Because the Nordhaus data represent a temporal snapshot, there are also reasons to be concerned that endogeneity could have distorted the results. We there-fore discard all groups that were experiencing ongo-ing conflict in 1990, which could have affected these groups’ relative wealth estimates. The results of this
29A simple test (not shown) based on a dummy variable that indi-cates whether the group’s settlement area intersects with oil fields also fails to make any substantial difference in the effect of the in-equality variables (see data at http://www.prio.no/CSCW/Datasets). 30Similar results can be derived by extending the sample in Model 5 (see Model 11 in the supplemental online Appendix).
test are presented in Model 8, which indicates that the inequality effect reported in Model 3 cannot be dismissed as being driven by endogenous influences. In fact, the coefficient of lineq2 hardly changes at all and remains discernibly greater than zero, and the other variables behave in a fashion very similar to that in the original model.31
Finally, to rule out potentially distorting temporal dependencies, we present a static model that uses the group list in 1992 as the basis of comparison, while coding the dependent variable as one if there is any group-level onset from 1992 through 2005.32 Again,
we find that the inequality result in Model 8 becomes even stronger than in the dynamic models. As would be expected, however, the exclusion dummy loses sig-nificance, because this measure is sensitive to shifts of groups’ power access that cannot be captured by the static analysis. We find no positive result for the power
31Despite this result, endogeneity may of course still undermine causal inference, although we believe this to be less likely given the stability of economic HIs (see Section 1.5 in the supplemental online Appendix).
32Very similar results can be obtained based on the 1991 and 1993 data, but we prefer to focus on 1992 because this is the first year after the collapse of the Soviet Union (cf. Models 18a and 18b in the supplemental online Appendix).
TABLE 3. Explaining the Onset of Group-level Conflict (Sensitivity Analysis)
Model 6 Model 7 Model 8 Model 9 Group-level variables
Ineq. (low excl. oil) 1.2498∗∗∗ −0.2045 Ineq. (high excl. oil) 1.5140∗∗∗
−0.4134 Inequality (lineq2) 0.6586∗∗∗ 1.7217∗∗∗ 2.0801∗∗∗ (0.1377) (0.2570) (0.4978) Excluded 1.2285∗∗∗ 1.3844∗∗∗ 1.0372∗∗ 0.7021 (0.3493) (0.2551) (0.3679) (0.4422) Power balance 5.4835∗ 0.8590 4.8040 −1.3843 (2.6084) (1.9322) (2.7512) (2.5962) Power balance (sq.) −7.4488 −0.8995 −6.2409 1.2222 (3.9224) (2.1901) (3.7091) (3.0177) Country-level variables GDP/capita (log) −0.9385∗∗∗ −0.4880∗∗∗ −0.7987∗∗ −0.901∗∗ (0.2391) (0.1478) (0.2660) (0.2606) No. excluded groups −0.0573∗∗ −0.0199 −0.0508∗∗ −0.0880∗ (0.0184) (0.0123) (0.0148) (0.0370) Year −0.2079∗∗∗ 0.0515∗∗ −0.2242∗∗
(0.0596) (0.0172) (0.0685) Post–Cold War period 362.526∗∗∗
(86.3212) Year× Post–Cold War −0.1819∗∗∗
(0.0433) Group-level conflict history
Peace years 0.1620 −0.0797 −0.0108 (0.1068) (0.0899) (0.1046) Spline 1 0.0026∗ 0.0006 0.0012 (0.0011) (0.0007) (0.0011) Spline 2 −0.0016∗ −0.0008 −0.0008 (0.0007) (0.0004) (0.0008) Spline 3 0.0004 0.0004∗ 0.0001 (0.0003) (0.0002) (0.0003) Constant 415.5265∗∗∗ −102.798∗∗ 449.2955∗∗ 4.6684∗ (118.9090) (33.6938) (137.1074) (1.9423) Observations 3,967 13,550 3,743 286
Notes:Robust, country-clustered standard errors in parentheses. ∗∗∗p< .001.∗∗p< .01.∗p< .05.
balance, but the two remaining country-level variables retain a statistically significant negative effect.
Obviously, this set of sensitivity tests does not ex-haust all possibilities. We refer the reader to our supple-mental online Appendix for detailed results, but report here on the most important findings. For example, dis-aggregation of the dependent variable into territorial and governmental conflict, based on the contested in-compatibility, shows that it is really the former type that is influenced by our inequality indicators. This is to be expected, because our method is explicitly geography-dependent, and it therefore cannot be excluded that HIs trigger governmental onsets. However, confirming this would require complementing the current mea-surements with nonspatial information, for example, from surveys.33
33See specifically the multinomial analysis presented in Model 10 in the supplemental online Appendix. Another potential concern is that
We also conducted several sensitivity tests by remov-ing extreme values, both among the (resource-)richest groups, such as the Ijaw in Nigeria and Arabs in Iran, and among the relatively poorest groups, such as the Chechens in Russia. Even if discarding these groups separately or together weakens the results, the inequal-ity effect remains statistically significant and strong. We also ran models controlling for world regions, which further confirm the robustness of our findings. Further-more, another test that entails replacing the dummy variable for excluded groups with the full set of EPR
the inequality effect could be driven by the difference between urban and rural communities. Yet this distinction does not in principle contradict our theory, and even though the GeoEPR data do not trace the ethnic compositions of major urban areas, adding a control variable for whether a group is “rural and urban” as opposed to merely “rural” does not affect our results (cf. Section 1.3 in the supplemental online Appendix).