HAL Id: hal-03190138
https://hal.archives-ouvertes.fr/hal-03190138
Submitted on 6 Apr 2021HAL is a multi-disciplinary open access
archive for the deposit and dissemination of sci-entific research documents, whether they are pub-lished or not. The documents may come from teaching and research institutions in France or abroad, or from public or private research centers.
L’archive ouverte pluridisciplinaire HAL, est destinée au dépôt et à la diffusion de documents scientifiques de niveau recherche, publiés ou non, émanant des établissements d’enseignement et de recherche français ou étrangers, des laboratoires publics ou privés.
Sodium Site Exchange and Migration in a Polar
Stuffed-Cristobalite Framework Structure
Alberto Fernández-Carrión, Aydar Rakhmatullin, Li Yang, Michael Pitcher,
Dominique Massiot, Florence Porcher, Mathieu Allix, Xiaojun Kuang
To cite this version:
Alberto Fernández-Carrión, Aydar Rakhmatullin, Li Yang, Michael Pitcher, Dominique Massiot, et al.. Sodium Site Exchange and Migration in a Polar Stuffed-Cristobalite Framework Structure. Inorganic Chemistry, American Chemical Society, 2021, 60 (7), pp.4322-4331. �10.1021/acs.inorgchem.1c00319�. �hal-03190138�
Sodium Site Exchange and Migration in Polar
Stuffed Cristobalite Framework Structure
Alberto J. Fernández–Carrióna, Aydar Rakhmatullinb, Li Yanga, Michael J. Pitcherb, Dominique Massiotb, Florence Porcherc, Mathieu Allixb, Xiaojun Kuanga,d*
aMOE Key Laboratory of New Processing Technology for Nonferrous Metals and Materials,
Guangxi Key Laboratory of Optical and Electronic Materials and Devices, College of Materials Science and Engineering, Guilin University of Technology, Guilin 541004, P. R. China.
bCNRS, CEMHTI UPR3079, Univ. Orléans, F-45071 Orléans, France.
cLaboratoire Léon Brillouin, CEA Saclay, 91191 Gif Sur Yvette, France.
dCollege of Chemistry and Bioengineering, Guilin University of Technology, Guilin 541004, P.
R. China.
Table of Contents. Two-dimensional exchange 23Na NMR spectroscopy evidences sodium site
Na1 Na2 30 0 10 20 30 30 0 10 20 30 0 10 20 30 0 10 20 30 d(23Na), ppm d ( 23 Na) , ppm 0 10 20 30 d(23Na), ppm 0 10 20 30
ABSTRACT:
The study of ionic dynamics in solids is essential to understand and develop modern energy technologies. Here we study the ionic dynamics of orthorhombic Na2MgSiO4, an interesting case
of a polar stuffed cristobalite-type structure that contains two inequivalent Na sites within the channels of the magnesium-silicate tetrahedral framework. Its preparation by solid state reaction method favours the presence of ~ 2% of Na vacancies, converting it into pure sodium ionic conductor with an optimized ionic conductivity of ~10–5 S cm–1 at 200 °C. The macroscopic migration has been characterized through impedance spectroscopy and molecular dynamics simulation which proves the pure sodium ionic character of the compound through hopping between Na1 and Na2 sites, forming three-dimensional migration zig-zag shaped paths. High– resolution solid–state 23Na magic MAS–NMR spectroscopy is employed to characterize the local structure and microscopic dynamics of sodium ion transport in Na2MgSiO4. Remarkably,
variable temperature 23Na MAS NMR and two-dimensional exchange spectroscopy evidence for the first time a sodium site exchange phenomenon at room temperature, which further triggers the sodium ionic conduction at elevated temperatures.
Among the different techniques characterizing solid state inorganic materials at local scale, solid state magic angle spinning nuclear magnetic resonance (MAS NMR) is a powerful tool. It has been widely employed to explore the local environment of certain atoms allowing, for instance, the concrete crystallographic description of unit cells, local structure around defects and so on. The application of this technique has been further enhanced by the possibility to acquire MAS NMR spectra at variable temperatures (VT MAS NMR),7 which expands the possibility to study the dynamic processes of mobile species present in solid state ionic conductors as a function of temperature.8 Moreover, for materials possessing multiple sites for mobile ions, it enables distinguishing ions moving on inequivalent sites that can lead to multiple possible pathways for diffusion. For this kind of materials, the clearest sign of diffusive dynamics is the merging of spectral peaks, initially assigned to atoms in different structural environments, with increasing temperature.9 The information on the ionic dynamics by NMR spectroscopy can be
1 Introduction
Ionic migration in solid state materials is a key physical phenomenon in numerous technologically important compounds such as solid state electrolytes used in batteries,1 electrochromic displays,2 sensors3 or solid oxide fuel cells (SOFCs).4 It is important to understand the interplay between ionic migration and structural chemistry, which helps improving the ionic conduction and guiding the materials design. Electrochemical impedance measurements (EIS) are frequently used to characterize the macroscopic long-range diffusional migration coupled to molecular dynamic (MD) simulations.5, 6 Nevertheless, detailed knowledge of the microscopic dynamic processes (set by the distance between neighboring atoms sites, i.e. at atomic and/or molecular scale) underlying ionic conductance is still required in order to fully understand and predict the behavior of ionic conducting materials.
further extended using two-dimensional exchange NMR spectroscopy (2D EXSY)10 that allows detecting exchange processes between ions on multiple sites during the initial migration stages. These techniques to study the ionic dynamics in solids have been frequently employed for characterizing the dynamics in lithium ion conductors.11, 12 Nevertheless, studies about the dynamics in Na ion conductors still remain scarcely explored even when they are potential materials as solid state electrolytes for batteries.
In this study, we investigate the sodium dynamics in stuffed cristobalite Na2MgSiO4 using EIS
and MD simulations coupled to NMR spectroscopy. This compound exhibits a tetrahedral framework based on corner-linked [SiO4]4- and [MgO4]6- units with two inequivalent sodium
sites stuffing the channels formed in the tetrahedral network. It was initially identified as potential sodium ion conductor due to its framework structure, where three-dimensional (3D) conductivity might be expected.13, 14 Two different polymorphs have been reported at room temperature: firstly Baur synthesized it hydrothermally and described its structure in the non-polar Pn space group (m-Na2MgSiO4),13 then Withers et al.15 prepared it following a sol-gel
route and described its structure by using the polar Pna21 space group (o-Na2MgSiO4). Both
orthorhombic and monoclinic structures contain an ordered Si/Mg distribution but differ in the pattern of tetrahedral tilting (Figure 1). Herein we obtain the polar o-Na2MgSiO4 phase and
demonstrate remarkable sodium site exchange at room temperature between the two inequivalent Na sites, the subsequently triggered sodium migration and its mechanism at elevated temperatures in this polar stuffed cristobalite.
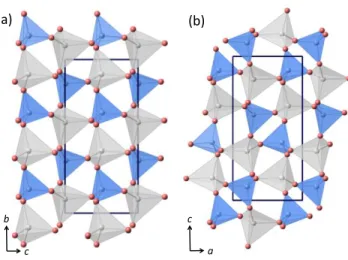
Figure 1. Tetrahedral framework structure comparison between m-Na2MgSiO4 (a) and
o-Na2MgSiO4 (b) as described by Baur (ICSD 15618) and Withers et al. (ICSD 84562),
respectively. Shaded blue and grey tetrahedra contain Si and Mg, respectively. The O atoms are illustrated by red balls atoms.
2 Methods 2.1 Synthesis
Na2MgSiO4 has been synthesized by solid state chemistry route. Starting reagents were high
purity Na2CO3 (99.99 %, Aladdin), MgO (99.8 %, Aladdin) and SiO2 (99.99 %, Aladdin). Both
Na2CO3 and MgO were initially dried at 350 °C and 1000 °C overnight, respectively. The
starting materials were weighed according to the stoichiometry and mixed in ethanol with an agate mortar and pestle. The dried mixtures were pressed under 4 Tons in a 12 mm diameter cylinder and calcined at 975 °C for 12 h for three times with intermediate grindings and pressings. The same batch of Na2MgSiO4 was used for the subsequent characterization
techniques. Additionally, in order to maximize the ionic conductivity while preserving the polar orthorhombic phase, Na2–2xMg1–xSi1+xO4 (x = 0.015, 0.025) compounds were prepared following
the same method through substitution of Mg for Si to induce sodium vacancies. In order to
(b) (a) a c c b
prepare pellets for EIS measurements, the powder was mixed with polyvinyl acetate (PVA) and then sintered at 975 °C.
2.2 Characterization
Second-harmonic generation (SHG) measurements were carried out on the powders using the Kurtz–Perry method.16 The measurements were performed with a Q-switched Nd:YAG laser at a wavelength of 1064 nm. The intensity of the frequency-doubled output emitted from the samples was collected by a photomultiplier tube and compared to crystalline KH2PO4 (KDP, serving as
reference).
Differential scanning calorimetry (DSC) data was acquired on a PerkinElmer STA 8000 simultaneous analyzer. About 20 mg of o-Na2MgSiO4 was placed in an Al2O3 crucible, heated at
a rate of 10 °C min–1 from room temperature to 800 °C, and then cooled to room temperature at the same rate under flowing air.
The identification of the crystalline phases was initially determined by laboratory X-ray powder diffraction (XRD), which were recorded on a Bragg−Brentano D8 Advance Bruker diffractometer (Cu Kα radiation) equipped with a LynxEye XE detector over an angular range of 10° < 2 < 130°. Variable temperature X-ray diffraction (VT–XRD) data were collected on Panalytical X’Pert PRO powder diffratometer (CuKα radiation) equipped with HTK1200N furnace over the 15–65° 2 range every 50 °C from RT up to 800 °C using 5°C/min heating and cooling rates, and allowing 3 min for temperature equilibration before collecting the data for 30 min at each set point.
High–intensity and high–resolution synchrotron X-ray powder diffraction (SPD) data was recorded on the 11–BM diffractometer at the Advanced Photon Source, Argonne National
∑ 𝑣𝑖 = 𝑒𝑥𝑝[(𝑅𝑖𝑗− 𝑑𝑖𝑗)/𝑏] (1)
where vi is the bond valence bond between the cation i and the anion j, b is a universal constant
(0.37), dij is the observed bond length and the Rij values have been taken as 1.803, 1.693 and 1.64
Å for Na–O, Mg–O and Si–O bonds, respectively as defined by Brown and Altermatt.18
The compositional homogeneity of the samples was analyzed by SEM and energy-dispersive X-ray spectroscopy (EDS) using a ZEISS Gemini SEM 300 scanning electron microscope (SEM, Germany), equipped with OXFORD EDS analyzer (ULTIM MAX 170, U.K.).
Solid state 23Na and 29Si NMR spectra were obtained using Bruker AVANCE I 400 (9.4 T), AVANCE III HD 750 (17.6 T), and AVANCE NEO 850 (20 T) NMR spectrometers. Chemical shifts were referenced to a 0.1 M NaCl solution for 23Na and tetramethylsilane (TMS) for 29Si.
23Na magic-angle spinning (MAS) NMR spectra were acquired at 17.6 T and 20 T using MAS
probes from Bruker, with 4 mm and 1.3 mm diameter rotors at the spinning rates of 12.5 kHz and 60 kHz, respectively. 29Si MAS NMR data were collected using a Bruker AVANCE I 400 (9.4 T) spectrometer with a single pulse experiment while samples were spun at a frequency of 7 Laboratory (USA). For this experiment, a sample of nominal composition Na2MgSiO4 was used.
SPD data was acquired over the 0.5–50° 2 range with a 0.001 step size at room temperature. Constant-wavelength (=1.2289 Å) neutron powder diffraction (NPD) data were collected at ambient temperature over the 10–120° 2 range at 2 intervals of 0.05° on the 3T2 diffractometer at LLB-Orphée source (France).
The diffraction patterns were analysed using the Rietveld method implemented in the Topas-Academic software17 to identify the corresponding phase and estimate the amount and distribution of Na content. The bond valence sum calculation for the Na–O, Si–O and Mg–O bonds obtained from Rietveld analysis were calculated according to the following expression18, 19
23Na 2D exchange spectroscopy (EXSY) experiments were conducted at 17.6 T in a 4 mm
rotor MAS probe while spinning at 12.5 kHz using the echo compensated EXSY pulse sequence developed by Messinger et al.23 The acquisition conditions were as follows: /2 pulse 7.75 s, mixing time 100 ms (1250 and 5000 rotor periods), recycle delay (d1) 2 s, with quadrature
detection in indirect dimension.
Alternating–current (AC) impedance spectroscopy measurements were performed with a Solartron 1260 frequency response analyzer over a frequency range of 10−1 – 107 Hz within the 100–800 °C temperature range. Platinum paste was coated on the opposite faces of the pellets kHz in 7 mm Bruker probe. For 29Si π/2 pulse width was 5s with a recycle delay of 7200 s. The NMR parameters (chemical shifts, chemical shift anisotropies, asymmetry parameters, line widths, and quadrupolar parameters) were fitted using the DMfit program.20 Spin–lattice relaxation (SLR) times (T1) were obtained using a saturation recovery pulse sequence and the
data were fitted to a stretched exponential of the form 1–exp[–(τ/T1)α] (2)
where τ are variable delays and α is the stretch exponential coefficient (between 0.85 and 1). Variable temperature 23Na MAS NMR data (up to 730 °C) were acquired on a Bruker AVANCE III 750 MHz NMR spectrometer using the diode laser–heated NMR probe head described previously.21 The sample was sandwiched between two layers of ground KBr which allowed for monitoring of the effective sample temperature through the shift of 79Br resonance signal of KBr.22 In the high temperature laser heating setting, the sample is contained in an aluminum nitride container placed in a zirconia rotor and immobilized with two O-rings made from the sodium-containing ceramic that give some secondary signals in the high temperature experiments.
(80% relative density) and heat treated at 600 °C for 30 minutes to burn out the organic components in the paste to form platinum electrodes. The impedance data analysis was carried out through the equivalent circuit fitting using the ZView software.24 The activation energies (Ea)
for ionic migration were determined from the slope of the conductivity curves by linear fitting of the Arrhenius equation:
log( )=logA-(Ea/2.303RT) (3)
where A is the pre–exponential factor, R is the gas constant, and T is the temperature in Kelvin.
2.3 Theoretical calculations
Density functional Theory (DFT) calculations for NMR parameters were performed using the CASTEP DFT code,25 employing the gauge including projector augmented wave (GIPAW) NMR calculations26 following the methodology previously reported.27
The atomistic static–lattice and molecular dynamics (MD) atomistic simulations have been carried out on the basis of the interatomic potential approach employing the General Utility Lattice Program (GULP) program.28, 29 The Buckingham potential function was employed to describe the interactions between ions with the shell model30 to describe the polarizability for the structure modeling of Na2MgSiO4. A three-body potential term was employed to describe the
O-Si-O interaction.31 The potentials parameters used for the atomistic simulations are summarized in Table S1,31, 32 and tested well to reproduce the crystal structure of Na2MgSiO4 (Table S2). The
MD simulation for sodium migration in Na2–2xMg1–xSi1+xO4 were performed with the
DL_POLY33 code in the NVT ensemble with a Berendsen34 thermostat on a 3×6×5 supercell model containing 2862 atoms (with the inclusion of the shell model) and having compositions of Na2MgSiO4 and Na1.95Mg0.975Si1.025O4. The system was equilibrated under a constant pressure of
the main MD simulations for 100 ps at specific temperatures within the 600 °C to 1000 °C temperature range. The substitutions of Mg with Si were randomly distributed in the supercell, resulting in Na vacancies uniformly distributed. The Visual Molecular Dynamic package35 was adopted to view the migration pathways of Na ions, and the data of mean square displacements (MSDs) were exported by using nMoldyn code.36 Sodium diffusion coefficients were obtained from the MSDs plots as a function of simulation time through linear fitting.
3 Results and Discussion 3.1 Long range structure.
The as-prepared Na2MgSiO4 compound exhibits weak second harmonic generation response
(~0.125 × KDP at room temperature), confirming a non-centrosymmetric structure. The laboratory XRD pattern of Na2MgSiO4 can be correctly indexed in the Pna21 space group with a ~10.89 Å, b ~ 5.29 Å, c ~ 7.06 Å, similar to the unit cell reported by Withers et al (ICSD
84562).15 This indexation was confirmed by high-resolution SPD pattern recorded at the 11BM beam line, with no evidence for symmetry reduction to the maximal non-isomorphic subgroups
P1a1, Pn11 or P1121. These data revealed a strong and systematic asymmetry in the peak
profiles, which is present throughout the pattern and is strongly hkl-dependent. In particular, the
h00 peaks were found to exhibit substantial asymmetry with long tails towards high angles,
whilst 00l exhibited similar tails towards low-angles, but the 0k0 peak were almost completely symmetrical (Figure S1). This is indicative of a complex microstrain with a- and c-parameters (which lie orthogonal to the channels in the framework) strained by compression and elongation respectively, with little apparent strain along the b-axis (which runs parallel to the channels, Figure 2a). The peak asymmetry was not apparent in the corresponding neutron diffraction pattern, due to the lower resolution of the instrument. The homogeneity of the sample was then
Figure 2. (a) [010] projections of the average o-Na2MgSiO4 structure emphasizing the
b
a
c
2.24 2.29 2.34 2.39 3.5 3.6 I nt ens ity (a. u) (310) (004) (020) Q spacing (Å-1) (400) 1 2 3 4 5 6 7 8 9 Int ens ity (a. u. ) Q spacing (Å-1 )(a)
(c)
(b)
(d)
0.990 0.995 1.000 1.005 0 20 40 60 80 100 a/ao b/b0 c/co V/V0 wt (%)Normalised cell parameters
tetrahedral framework. Grey and blue colors represent the Mg and Si atoms, respectively. Navy blue and yellow green colors indicate Na1 and Na2, respectively. (b) Representative portion of the Rietveld plots from SPD (Rwp= 9.16%, Rp = 7.11%, χ2 = 1.01) and (c) NPD (Rwp= 2.61%, Rp
checked by EDS-SEM analysis which further evidenced a homogeneous distribution of elements at m-scale (see Figure S2) and no segregation of elements could be detected. We performed chemical analysis in different grains giving the average at% 46±1, 27±1, 27±2 for Na, Mg and Si, respectively. Thus, the EDS-SEM data further confirmed that our sample is well reacted as well as the presence of some Na defect probably arising from Na volatilization which is commonly reported in the preparation of Na-based ceramics at high temperatures.14, 37, 38
= 2.01%, χ2 = 3.00) data using the multiple cells (seven) based on the Pna2
1 structure model.
Experimental (circles), fitted (dark green line) and difference curve (purple). The sets of vertical lines correspond to the reflection positions for each one of the seven unit cells of o-Na2MgSiO4
employed. Overall reliability factors: Rwp= 5.72%, Rp = 5.26%, χ2 = 1.44. d) Normalized refined
lattice parameter distribution and unit cell weighting data obtained from SPD-NPD combined refinement.
We then carried out a combined Rietveld refinement using the SPD and NPD datasets. To account for the peak asymmetry in the SPD pattern, we constructed a multiple-unit-cell Rietveld model starting from the published Pna21 structure of Na2MgSiO415 as explained in
supplementary Note 1. Figure 2b depicts a representative view of the SPD final refinement (a general view can be found in Figure S3). Figure 2c presents the final refinement of the NPD pattern. The resulting refined structure represents a weighted average of the seven unit cells, whose refined lattice parameter distribution and weighting is shown in Figure 2d. The final refined composition was Na1.968(3)Mg0.968(4)Si1.032(4)O4, leading to a mechanism in which sodium
volatilization induces sodium vacancies that are compensated by Si substitution for Mg according to Na2-2xMg1-xSi1+xO4. The multi-cell refinement results indicate that the sample
contains a small sub-micro compositional distribution arising from uncontrollable Na volatilization that is strongly coupled to an anisotropic local distortion of the crystal structure that shortens/elongates the a/c lattice parameters respectively (see Figure 2d), while the b parameter is only weakly affected because the channels are distributed along this [010] direction (Figure 2a). This is possible because of the high flexibility of the framework structure through the tetrahedral connections even when the Si/Mg tetrahedra are quite rigid.39 Overall this causes the unit cell volume to be strained towards smaller values, which is consistent with the presence
29Si MAS NMR. The room temperature 29Si MAS NMR spectrum (Figure S6) mainly contains
one Si site in very symmetrical tetrahedral Si(4Mg) environment, confirming an ordered Si/Mg distribution in the structure. The value of the 29Si chemical shift, –69.3 ppm, and the full width at half-maximum (FWHM), 76 Hz (1.0 ppm), are close to those obtained by Withers et al., i.e., – of vacancies on the Na sites as well as the Si4+ substitution for the larger Mg2+. It is worth noting that careful examination of the final refinement of SPD data evidenced a set minor unindexed reflections (Figure S4). Although we could not assign them to any known compound within the Na2O-MgO-SiO2 phase diagram, it is consistent with the proposed mechanism in which sodium
vacancies from sodium volatilization are compensated by the substitution of Si for Mg, which drove the final composition of the sample into a multiple-phase coexistence. The validity of our multiple-unit-cell model was further corroborated with the preparation of two additional non-stoichiometric compounds belonging to the Na2-2xMg1-xSi1+xO4 system, i.e. x = 0.015, 0.025
which exhibit the same unit cell parameters evolution (smaller a axis, longer c axis but nearly unchanged b axis and overall unit cell volume reduction, Figure S5a-b).
Table S1-2 gather the refined structural parameters and main bond distances of the main phase. The two inequivalent Na sites hosted within the channels in the -cristobalite structure exhibits similar number of vacancies (~1% and 2% in Na1 and Na2, respectively). Both are coordinated by twelve oxygens, although a careful observation of the Na–O bond lengths indicates the presence of five and four nearest oxygen to Na1 and Na2 sites, respectively, within 2.31–2.75 Å as first coordination spheres, while the rest are placed further than 3 Å. Therefore, considering Na1 as five coordinated and Na2 as four coordinated seems reasonable given their respective bond valence sums (BVS) 0.88 and 1.08 close to unit.
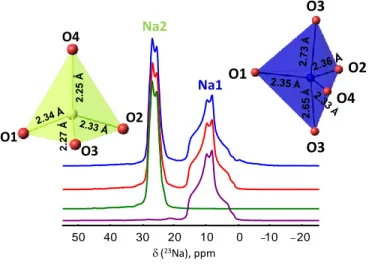
23Na MAS NMR. The room temperature 23Na MAS NMR spectrum revealed the presence of
two Na sites with relative multiplicities of 1:1 with well–defined quadrupolar line shapes (Figure 3), as expected. From the fitted spectrum, the chemical shifts (δiso) and quadrupolar parameters
(quadrupolar constant, CQ and asymmetry parameter, ηQ) were obtained and the assignment of 23Na resonances to sodium crystallographic sites based on the DFT computations considering the
68.9 ppm and FWHM = 1.2 ppm.15 In addition, there is another weak resonance around –75.3 ppm. This signal may be attributed to the secondary phase observed by SPD. Nevertheless, we have dismissed it because the relative amount of Si in different environments is 94/6 according to the 29Si MAS NMR spectrum fit, while the amount of the impurity phase has been estimated as 0.3 wt% from the SPD pattern (calculated from the A020/Ai ratio, being A020 the integrated area
of the (020) reflection and Ai the integrated area of the unindexed peak at 2 ~10.7°- Figure S4).
More likely, the presence of this signal can be assigned to the existence of a Si(3Mg, 1Si) site as described by Withers et al. for the non-stoichiometric compounds in Na2-2xMg1-xSi1+xO4 system
(i.e., -74.9 ppm).15 Moreover, the relative amount of Si in different environment (Si(4Mg) and Si(3Mg, 1Si)) determined as 94/6 is in reasonably good agreement to the refined composition, 97.8(3)/3.2(3).This further supports that some Si moves inside the Mg tetrahedra to compensate the charge imbalance due to Na volatilization. Theoretically, Si substitution for Mg in the fully ordered structure of Na2MgSiO4 would have led to formation of Si(0Mg, 4Si) and Si(3Mg, 1Si)
centers. Nevertheless, the presence of additional environments (e.g. Si(0Mg, 4Si), Si(1Mg, 3Si) or Si(2Mg, 2Si)) were not detected, which indicates that small amount of Si substitution for Mg in the ordered Na2MgSiO4 avoids condensation of SiO4 tetrahedra. This may interrupt locally
ordered Mg and Si distribution in Na2MgSiO4, which accounts for the swelling feature on the
Figure 3. Experimental (blue) and simulated (red) 23Na MAS NMR spectra at 20 T and 60 kHz recorded at room temperature. The fitting of the individual 23Na resonances at Na1 and Na2 sites are shown in purple and green, respectively. Inset: Sodium coordination polyhedra in Na1 and Na2 sites. The bond lengths have been obtained from Rietveld combined refinement on NPD-SPD data.
Table 1. 23Na isotropic chemical shifts (δiso), quadrupolar constants (CQ), integrated intensity (I)
and asymmetry parameters (ηQ) obtained from the simulation of the 23Na MAS at 17.6 T and 20
T and calculated 23Na NMR parameters (isotropic magnetic shielding constant σiso, chemical
shifts δisocalc,quadrupolar constant |CQcalc|, and asymmetry parameter ηQcalc) for o-Na2MgSiO4.
Site ±0.2ppm δiso CQ
±0.2MHz ηQ ±0.1 I(%) ±2% σiso ppm δppm isocalc |CMHz Qcalc| ηQcalc
Na1 16.0 3.3 0.74 50 537.9 16.1 3.86 0.72
Na2 28.7 2.1 0.42 50 521.6 29.8 2.33 0.32
3.3 Macroscopic ionic migration
b ) Na2 Na1 d(23Na), ppm -20 -10 0 10 20 30 40 50 2.65 Å O3 O2 O4 O3 O1 2.25 Å 2.27 Å O4 O1 O3 O2
Mg/Si fully ordered structural model is given in Table 1. Na1 site exhibits a larger quadrupolar coupling CQ (3.3 MHz) than that observed for Na2 (2.1 MHz), confirming the more distorted
2.9(2)×106 Ω·cm and C21.9(1)×10–12 F·cm–1. It must be indicated that a CPE element is not
included for the second element since its values are not meaningful and, indeed, a satisfactory fit was obtained. While increasing the temperature, the bulk response arc disappeared gradually and above 400 °C only electrode response was identified. The electrode response recorded at
Electrochemical impedance spectroscopy (EIS). The electrical behavior characterization of
the sample was undertaken by EIS. At temperatures below ~150 C, the spectra exhibit non-well defined shapes in the low frequency range (see Figure S7). Between ~150 – 400 °C, the spectra consist of one depressed semicircle arc in the high frequency region and one Warburg–type inclined line in the low frequency region with capacitances of >10–8 F·cm–1 at 10–1 Hz,40 indicative of ionic conduction. Figure 4a depicts the complex impedance plot of Na2MgSiO4
recorded at 154 °C, showing one asymmetric and depressed semicircular arc in high frequency region. In the C' vs. f plot two overlapping plateaus can be apparently discerned within 107–102 Hz region (Figure 4a, inset): the one in 102–103 Hz has capacitances ~2 pF·cm-1 and the other one within 105–106 Hz has smaller capacitances ~0.5 pF·cm-1. Both capacitance plateaus lie with the bulk responses,40 i.e. that the semicircular arc actually comprises two bulk components and may be indicative of the electrical inhomogeneous nature of the as-prepared Na2MgSiO4, probably due
to partial Na volatilization. Apart from the overlapping bulk response arc and electrode response line, no apparent grain boundary response was observed in the complex impedance plot. Therefore deconvolution of complex impedance plot was performed through equivalent circuit fitting with two bulk and one electrode components, which is shown in Figure S8. The high frequency part of the bulk impedance data is a series combination of one bulk component consisting of Rb1, Cb1, CPE1 in parallel and the other bulk component consisting of Rb2, Cb2 in
Figure 4c depicts the Arrhenius plots for the bulk conductivities of o-Na2MgSiO4. It exhibits σb 10–5 S·cm–1 at 300 °C, in good agreement with the values reported by Baur13 and Shannon,14 and at 800 °C its conductivity reaches 5×10⁻³ S·cm-1. Slight curvature was observed on the Arrhenius plot of bulk conductivity: the Ea is ~0.73(1) eV within 100 – 500 °C and then
decreases at higher temperatures (~0.51(2) eV between 500 – 800 °C). This evolution cannot be attributed to any structure change, as either VTXRD or DSC data do not evidence any structure rearrangement apart from the enlargement of the unit cell parameters and Na–O bonds (Figure S9-S10, respectively). The change of Ea may be related to a local order-disorder transition of
sodium vacancies at high temperature, where the sodium ions become progressively more mobile. Such local order-disorder of small amount of sodium vacancies is not enough to change significantly the environments of sodium ion in the structure. Therefore, it is hard to deduce the information on the order-disorder of sodium vacancies from the variable-temperature 23Na MAS NMR data described later. Moreover, the conductivity can be further improved by inducing more sodium vacancies through varying the stoichiometry allowing for the Mg substitution for Si in the tetrahedral network according to the Na2-2xMg1-xSi1+xO4 formula proposed above and
achieves ~10–5 S·cm–1 at 200 °C for the o-Na1.95Mg0.975Si1.025O4 nominal composition (Figure 4c)
while conserving the polar Pna21 structure.
650 °C does not show any evident collapse after changing the atmosphere from pure nitrogen to pure oxygen, in contrast with the typical behavior to partial oxygen pressure exhibited by oxide ion conductors (Figure 4b).5, 41-43 Moreover, its ionic conductivity is maintained at different pO2
values (Figure 4b-inset). Therefore, the ionic conduction in o-Na2MgSiO4 arises from sodium
Figure 4. (a) Experimental (open circles) and calculated (red line) complex impedance plot of
o-Na2MgSiO4 at 154 °C in air and its deconvolution to two bulk components (in blue and green
lines). The numbers denote the logarithms of the selected frequencies marked by filled circles. The inset shows the capacitance as a function of frequency of o-Na2MgSiO4 at 154 °C. (b)
Complex impedance plots for o-Na2MgSiO4 at 650 °C under N2, air and O2. The inset depicts the pO2 dependency of the conductivity of Na2MgSiO4 at 650 °C. (c) Arrhenius plots of total
conductivity for o-Na2-2xMgxSi1+xO4 (x = 0, 0.015, 0.025) compositions.
MD simulation. Atomistic static lattice and MD simulations were carried out on the basis of
the interatomic potential method for both o-Na1.95Mg0.975Si1.025O4 and o-Na2MgSiO4 nominal
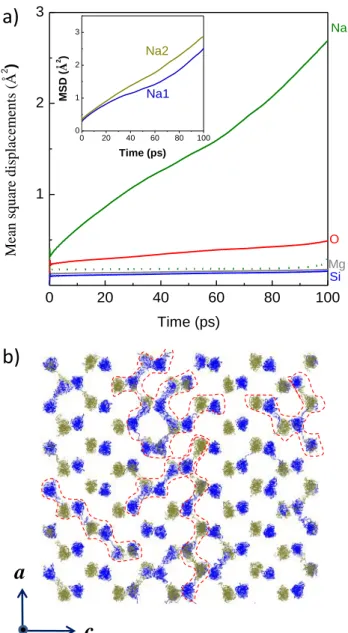
compositions. Figure 5a shows the calculated MSD values of Na, Mg, Si and O atoms in o-Na1.95Mg0.975Si1.025O4 obtained at 1000 °C (generally higher temperatures than the experimental
ones are required for the simulations to observe the long-range migration paths within the limited simulated time 100 ps). Only Na ions migrate through the structure; Mg, Si and O ions vibrate slightly around their lattice positions without long–range migration, in good agreement with the sodium ionic conduction character revealed by impedance spectroscopy. The sodium diffusion coefficients, calculated from the MSD values of Na ions, fall in the range of ~ 10–8–10–6 cm2·s–1
1.0 1.5 2.0 2.5 10-9 10-8 10-7 10-6 10-5 10-4 10-3 10-2 10-1 b (S ·cm -1) 1000/T(K-1) Na2MgSiO4 Na1.97Mg0.985Si1.015O4 Na1.95Mg0.975Si1.025O4 9 8 7 6 5 4 3 2 1 T (102 C) 0.0 0.5 1.0 1.5 0.0 0.5 1.0 1.5 3 4 5 -1 -Z "( ·cm ) Z'( ·cm) 100 102 104 106 10-13 10-11 10-9 C (F cm -1) Frequency (Hz) ~ 2 p F c m -1 ~ 0 .5 p F c m -1 Rb (a) 0 1 2 3 0 1 2 3 -Z "(10 3 ·c m ) Z' (103·cm) Air N2 O2 (b) Rb 10-4 10-2 100 10-4 10-3 10-2 10-1 b (S cm -1) pO2 (c)
Arrhenius plot of the sodium diffusion coefficients is 0.69(2) eV, which is between the experimental values in the high (0.73(1) eV) and low (0.51(2) eV) temperature ranges. The streaming and overlapping of positions of sodium ions originally at Na1 and Na2 sites in their scatter plots (Figure 5b), together with their MSD values suggest that both Na sites are involved in, and equally contribute to the sodium ion migration mainly through hopping between Na1 and Na2 sites, forming three-dimensional migration zig-zag shaped paths. For comparison, the MSD values for Na ions in Na2MgSiO4 (red dashed line in Figure 5a), i.e. free of vacancies, are
remarkably lower than those calculated for Na1.95Mg0.975Si1.025O4 at the same temperature. This
further supports that the presence of Na vacancies is strictly necessary to observe ionic conductivity in Na2MgSiO4.
Figure 5. (a) MSD values of Na, Mg, Si and O atoms in Na1.95Mg0.975Si1.025O4 as a function of
time from the MD simulations at 1000 ºC. The inset depicts the MSD values of Na1 and Na2 atoms. Green dashed line indicates the MSD for Na in vacancy-free Na2MgSiO4 compound at
1000 °C. (b) Scatter plots of sodium ion positions showing the diffusion paths consisting of both Na1 and Na2 sites at 1000 °C (marked by dashes lines) from MD simulations. Blue and greenish-olive dots denote sodium ions originally placed at Na1 and Na2 sites respectively.
0 20 40 60 80 100 1 2 3 0 20 40 60 80 100 0 1 2 3 Na2 Na1 Me an squa re displ ac eme nts (Å 2 ) Time (ps) Na O Mg Si MS D ( Å 2 ) Time (ps)
c
a
b)
a)
3.4 Microscopic ionic migration.
VT 23Na MAS NMR spectroscopy. Since the pure sodium ionic conduction nature is
demonstrated in o-Na2MgSiO4, the sodium migration dynamics at local scale was monitored by
VT 23Na MAS NMR spectroscopy. As aforementioned, the spectrum of o-Na2MgSiO4 recorded
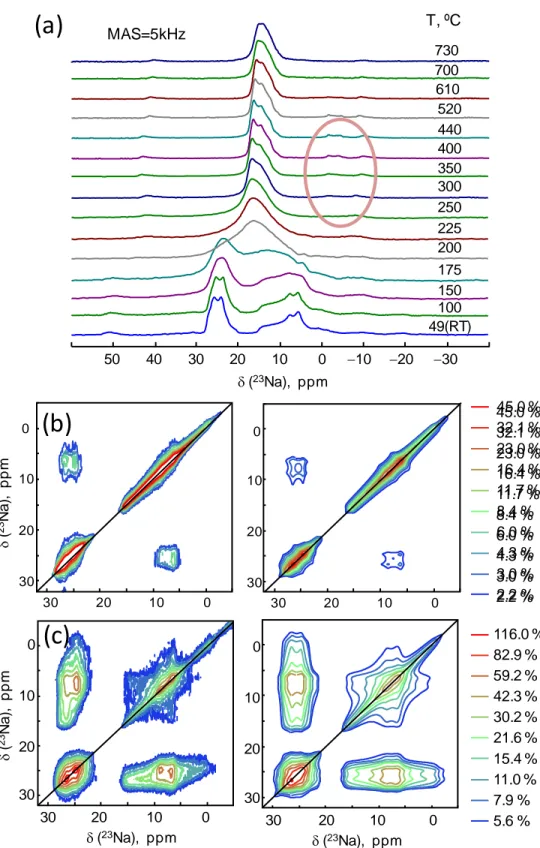
under a magnetic field of 17.6 T and spinning at 5 kHz exhibits two well–separated quadrupolar lines expressing second order line shapes. It is worth mentioning that when MAS NMR measurements were performed at room temperature, and without temperature regulation, the actual sample temperatures were 49±2 °C at 5 kHz (7 mm rotor) MAS and 52±2 °C at 12.5 kHz (4 mm rotor) due to frictional heating. Considering the 1D experiments (Figure 6a), we observed that the temperature increase from 49 °C up to 730 °C first led to the collapse of the quadrupolar line shapes merging to a single broad spectrum at 175–200 °C that then sharpened into an averaged line up to 730 °C. This behavior is closely related to what was observed for nepheline (a trydimite-type framework) at 500 °C and it is indicative of an ion exchange process.9, 44 As indicated by the VT-XRD data, this tendency cannot be attributed to any structure change within the analyzed temperature range. We have estimated the activation energy for Na migration from
23Na SLR time measurements (T
1) (Figure S12). The linear slope indicates an Ea = 0.321 eV for
fluctuations causing relaxation, which is much smaller than that obtained from conductivity measurements (0.51(2)–0.73(1) eV), probably because that NMR relaxation is occurring not only through cationic motion required for diffusion and conductivity, but also via local fluctuation of Na environment (via local ion hopping back and forth between sites and/or by motion of nearby defects). This may lead to lower activation energies than those needed for through-going (long-range) ionic diffusion alone.11, 47-49 It is worth noting that both techniques tends to reflect different averaging of the underlying distribution of dynamic processes and it is not surprising to
23Na 2D EXSY experiments. In order to better understand the dynamics of sodium mobility in
the material at moderate temperature and before the merging of quadrupolar line–shapes, we performed 23Na 2D EXSY experiments at 52 °C and 100 °C. The EXSY experiments (Figure 6b) allow evidencing slow ionic jumps between the 23Na crystallographic sites at the time scale of hundred of ms exchange or mixing time. Non-exchanged Na atoms do not change frequency during the mixing time but they sign on the diagonal which is homogeneously broadened by spin–spin relaxation (T2). Na atoms exchanging with a neighboring site will sign as off-diagonal
(direct exchange between different structural positions) or on-diagonal cross-peaks (relayed exchange). Thanks to the specific line shapes of the cross-peaks correlating two second order broadened line-shapes, we implemented a simulation of the different components in DMfit (available from version #20200728 available on request) and to retrieve their respective contributions (integrals of diagonal and cross peaks).20 At 52 °C and 100 ms exchange we observe 83 % of non-exchanged Na atoms, 17 % of exchange between Na1 and Na2 sites and negligible self exchange; at 100 °C and 100 ms exchange, we observe at 23% of non-exchanged Na atoms, 48% of exchange between Na1 and Na2 sites and 28 % self exchange (Table S5). observe such a mismatch. For instance, similar phenomenon of lower activation energy observed by NMR than those needed for the longer-range sodium ionic diffusion was also noticed in the glassy phase from the sodium-doped SrSiO3 compositions45 or other crystalline sodium-based
materials such as Na2B10H1046or Na3InCl6.47 Therefore the lower activation energy observed by
NMR may indicate that local hopping mechanism different from the long-range migration takes place in the sample.
Figure 6. (a) 23Na NMR spectra recorded at 17.6 T and MAS 5 kHz as a function of temperature. The weak 23Na signals between –5 and –2 ppm (red circle) arise from the ceramic O–rings used
(a)
-30 -20 -10 0 10 20 30 40 50 T, ºC 100 200 610 520 440 300 49(RT) 150 250 350 400 225 175 700 730 d(23Na), ppm MAS=5kHz 0 10 20 30 0 10 20 30 0 10 20 30 0 10 20 30 0 10 20 30 0 10 20 30 d(23Na), ppm d ( 23 N a ), ppm d ( 23 N a ), p p m(b)
(c)
0 10 20 30 d(23Na), ppm 0 10 20 30 5.6 % 7.9 % 11.0 % 15.4 % 21.6 % 30.2 % 42.3 % 59.2 % 82.9 % 116.0 % 2.2 % 3.0 % 4.3 % 6.0 % 8.4 % 11.7 % 16.4 % 23.0 % 32.1 % 45.0 % 5.6 % 7.9 % 11.0 % 15.4 % 21.6 % 30.2 % 42.3 % 59.2 % 82.9 % 116.0 % 2.2 % 3.0 % 4.3 % 6.0 % 8.4 % 11.7 % 16.4 % 23.0 % 32.1 % 45.0 %to fix the AlN sample holder in place within the zirconia rotor. (b-c) 23Na 2D EXSY NMR spectra (left) obtained with 100 ms mixing time, (b) at 52 °C; (c) at 100 °C and their fitting results (right).
3.5 Global sodium migration mechanism in o-Na2MgSiO4
According to our data covering the sodium dynamics from macroscopic to microscopic range, an atomistic point of view of the Na migration can be understood as follows. Four Na1 atoms located in the second coordination sphere of the Na2 atom and also four Na2 atoms are placed in the second coordination sphere of the Na1 atom. Since the distances between two different sodium sites (3.12; 3.23; 3.30; 3.36 Å) are shorter than the distances between the same sites (from 4.77 up to 5.61 Å), we only observe exchange between Na1 and Na2 sites in the 23Na EXSY NMR spectrum at 52 °C (this step is illustrated in Figure 7a). Upon slight heating (100 °C), the sodium atoms start to migrate-diffuse within and between the channels of the magnesium–silicate framework. Then, with a further increase in temperature, the movement of atoms becomes very fast and we cannot distinguish these two states anymore on the NMR timescale as inferred from 23Na EXSY NMR data and the long range diffusion of sodium atoms takes place though the 3D framework of the structure mainly along the paths composed of alternate Na1 and Na2 sites, as exemplified in Fig 7b.
Figure 7. (a) <010> view of the sodium site exchange at low temperatures. Si, Mg, Na1 and Na2
are represented as blue, grey, navy blue and greenish spheres, respectively. (b) <010> view of Na2MgSiO4 refined structure emphasizing the voids along (010) direction. The macroscopic Na
migration at high temperatures along the [100] (blue), [010] (red) and [001] (purple) directions are indicated. The interconnected Na atoms are placed at distances ranging 3.12-3.36 Å.
4 Conclusions
The sodium dynamics have been studied and described for the first time in polar stuffed-cristobalite o-Na2MgSiO4 through a complementary set of techniques (EIS, MD simulations, (VT) 23Na MAS NMR and 23Na EXSY NMR). o-Na
2MgSiO4 exhibits two inequivalent Na sites and it
should not exhibit ionic conduction on the strictly stoichiometric composition, according to molecular dynamics simulations. Yet, the synthesis route employed results partial Na
c b a c a (b) (a)
volatilization (~2 at%) that converts the material into a pure ionic conductor exhibiting moderated ionic conductivity (~ 10–5 S cm–1 at 300 °C) that can be further improved by inducing additional Na vacancies while keeping the polar structure according to Na2-2xMg1-xSi1+xO4
formula. 1D 23Na VT MAS NMR and 23Na EXSY NMR clearly evidence that a sodium site exchange at ~ RT takes place triggering the sodium ionic conduction at higher temperatures. This work demonstrates the sodium site exchange phenomenon for first time by 23Na EXSY NMR and paves the way to possible further identification of sodium ionic conductors from complex structures as 3D stuffed-cristobalite ones exhibiting multiple sites for mobile ions.
AUTHOR INFORMATION Corresponding Author
*E-mail: [email protected]
ACKNOWLEDGMENT
The authors thank the National Science Foundation of China (Nos. 21850410458, 22090043 and 21622101) Guangxi Natural Science Foundation (No. 2019GXNSFGA245006) as well as the CNRS (IR-RMN-THC Fr30560) for the financial support. Prof. Sangen Zhao is acknowledged for the help on SHG measurements.
ASSOCIATED CONTENT
Supporting Information. SPD diffraction refinements; SEM-EDS elemental mapping for
Na2MgSiO4; Laboratory XRD patterns of o-Na2-2xMg1-xSi1+xO4 samples and normalized refined
lattice parameters; 29Si MAS NMR spectrum; Complex impedance plot at 60 °C; Equivalent circuit to fit the EIS spectrum recorded at 154 °C; VTXRD, DSC and unit cell evolution
30–750 °C; Arrhenius plot of the sodium diffusion coefficient; 23Na spin–lattice relaxation times plotted against 1000/T; Structural parameters and selected interatomic distances at room temperature; Interatomic potential parameters used for the MD simulations and experimental and calculated structural parameters; Multiple-unit-cell Rietveld model description.
REFERENCES
1. Yabuuchi, N.; Kubota, K.; Dahbi, M.; Komaba, S. Research Development on Sodium-Ion Batteries. Chem. Rev. 2014, 114, 11636-11682.
2. Rosseinsky, D. R.; Mortimer, R. J. Electrochromic Systems and the Prospects for Devices.
Adv. Mater. 2001, 13, 783-793.
3. Sun, J. Y.; Keplinger, C.; Whitesides, G. M.; Suo, Z. G. Ionic Skin. Adv. Mater. 2014, 26, 7608-7614.
4. Mahato, N.; Banerjee, A.; Gupta, A.; Omar, S.; Balani, K. Progress in Material Selection for Solid Oxide Fuel Cell Technology: A Review. Prog. Mater Sci. 2015, 72, 141-337.
5. Yang, X.; Fernández-Carrión, A. J.; Wang, J.; Porcher, F.; Fayon, F.; Allix, M.; Kuang, X. Cooperative Mechanisms of Oxygen Vacancy Stabilization and Migration in the Isolated Tetrahedral Anion Scheelite Structure. Nat. Commun. 2018, 9, 4484.
6. Xu, J.; Wang, J.; Rakhmatullin, A.; Ory, S.; Fernández-Carrión, A. J.; Yi, H.; Kuang, X.; Allix, M. Interstitial Oxide Ion Migration Mechanism in Aluminate Melilite La1+xCa1–xAl3O7+0.5x
7. Kirchhain, H.; van Wüllen, L. Solid state NMR at very high temperatures. Prog. Nucl.
Magn. Reson. Spectrosc. 2019, 114-115, 71-85.
8. Stebbins, J. F. In Modern Methods in Solid-state NMR: A Practitioner's Guide; The Royal Society of Chemistry: 2018; pp 262-288.
9. Stebbins, J. F. Dynamics in Ceramics. Science 2002, 297, 1285-1287.
10. Böhmer, R.; Storek, M.; Vogel, M. In Modern Methods in Solid-state NMR: A
Practitioner's Guide; The Royal Society of Chemistry: 2018; pp 193-230.
11. Xu, Z.; Stebbins, J. F. Cation Dynamics and Diffusion in Lithium Orthosilicate - 2-Dimensional Li-6 NMR. Science 1995, 270, 1332-1334.
12. Verhoeven, V. W. J.; de Schepper, I. M.; Nachtegaal, G.; Kentgens, A. P. M.; Kelder, E. M.; Schoonman, J.; Mulder, F. M. Lithium Dynamics in LiMn2O4 Probed Directly by
Two-Dimensional Li-7 NMR. Phys. Rev. Lett. 2001, 86, 4314-4317.
13. Baur, W. H.; Ohta, T.; Shannon, R. D. Structure of Magnesium Disodium Silicate Na2MgSiO4 and Ionic Conductivity in Tetrahedral Structures. Acta Crystallogr. B 1981, 37,
1483-1491.
14. Shannon, R. D. Ionic Conductivity in Sodium Magnesium Silicates. Phys. Chem. Miner.
1979, 4, 139-148.
15. Withers, R. L.; Lobo, C.; Thompson, J. G.; Schmid, S.; Stranger, R. A Modulation Wave Approach to the Structural Characterization of Three New Cristobalite-Related Sodium
16. Kurtz, S. K.; Perry, T. T. A Powder Technique for the Evaluation of Nonlinear Optical Materials. J. Appl. Phys. 1968, 39, 3798-3813.
17. Coelho, A. A. TOPAS and TOPAS-Academic: an Optimization Program Integrating Computer Algebra and Crystallographic Objects Written in C++. J. Appl. Crystallogr. 2018, 51, 210-218.
18. Brown, I. D.; Altermatt, D. Bond‐Valence Parameters Obtained from a Systematic Analysis of the Inorganic Crystal Structure Database. Acta Crystallogr. B 1985, 41, 244-247.
19. O'Keeffe, M.; Brese, N. E. Bond-Valence Parameters for Anion-Anion Bonds in Solids.
Acta Crystallogr. B 1992, 48, 152-154.
20. Massiot, D.; Fayon, F.; Capron, M.; King, I.; Le Calve, S.; Alonso, B.; Durand, J. O.; Bujoli, B.; Gan, Z. H.; Hoatson, G. Modelling One- and Two-Dimensional Solid-State NMR Spectra. Magn. Reson. Chem. 2002, 40, 70-76.
21. Rakhmatullin, A.; Šimko, F.; Véron, E.; Allix, M.; Martineau-Corcos, C.; Fitch, A.; Fayon, F.; Shakhovoy, R. A.; Okhotnikov, K.; Sarou-Kanian, V.; Korenko, M.; Netriová, Z.; Polovov, I. B.; Bessada, C. X-ray DIffraction, NMR Studies, and DFT Calculations of the Room and High Temperature Structures of Rubidium Cryolite, Rb3AlF6. Inorg. Chem. 2020, 59,
6308-6318.
22. Venkatachalam, S.; Schröder, C.; Wegner, S.; Van Wüllen, L. The Structure of a Borosilicate and Phosphosilicate Glasses and its Evolution at Temperatures Above the Glass Transition Temperature: Lessons from in situ MAS NMR. Phys. Chem. Glasses-B 2014, 55,
280-23. Messinger, R. J.; Ménétrier, M.; Salager, E.; Boulineau, A.; Duttine, M.; Carlier, D.; Ateba Mba, J.-M.; Croguennec, L.; Masquelier, C.; Massiot, D.; Deschamps, M. Revealing Defects in Crystalline Lithium-Ion Battery Electrodes by Solid-State NMR: Applications to LiVPO4F. Chem. Mater. 2015, 27, 5212-5221.
24. Johnson, D. Zview for Windows, Impedance/Gain Phase Graphing and Analysis Software, Scribner Associates: North Carolina, 2001.
25. Segall, M. D.; Lindan, P. J. D.; Probert, M.; Pickard, C. J.; Hasnip, P.; Clark, S. J.; Payne, M. C. First-Principles Simulation: Ideas, Illustrations and the CASTEP Code. J. Phys.: Condens.
Matter 2002, 14, 2717-2744.
26. Clark, S. J.; Segall, M. D.; Pickard, C. J.; Hasnip, P. J.; Probert, M. J.; Refson, K.; Payne, M. C. First Principles Methods Using CASTEP. Z. Kyrstallogr. 2005, 220, 567-570.
27. Šimko, F.; Rakhmatullin, A.; Florian, P.; Kontrík, M.; Korenko, M.; Netriová, Z.; Danielik, V.; Bessada, C. (Oxo)(Fluoro)–Aluminates in KF–Al2O3 System: Thermal Stability
and Structural Correlation. Inorg. Chem. 2017, 56, 13349-13359.
28. Gale, J. D. GULP: A computer program for the symmetry-adapted simulation of solids. J.
Chem. Soc. Faraday Trans. 1997, 93, 629-637.
29. Gale, J. D.; Rohl, A. L. The General Utility Lattice Program (GULP). Mol. Simul. 2003, 29, 291-341.
30. Dick, B. G.; Overhauser, A. W. Theory of the Dielectric Constants of Alkali Halide Crystals. Phys. Rev. 1958, 112, 90-103.
31. Jackson, R. A.; Catlow, C. R. A. Computer Simulation Studies of Zeolite Structure. Mol.
Simul. 1988, 1, 207-224.
32. Heath, J.; Chen, H.; Islam, M. S. MgFeSiO4 as a Potential Cathode Material for
Magnesium Batteries: Ion Diffusion Rates and Voltage Trends. J. Mater. Chem. A 2017, 5, 13161-13167.
33. Todorov, I. T.; Smith, W.; Trachenko, K.; Dove, M. T. DL_POLY_3: New Dimensions in Molecular Dynamics Simulations Via Massive Parallelism. J. Mater. Chem. 2006, 16, 1911-1918.
34. Berendsen, H. J. C.; Postma, J. P. M.; Gunsteren, W. F. v.; DiNola, A.; Haak, J. R. Molecular Dynamics with Coupling to an External Bath. J. Chem. Phys. 1984, 81, 3684-3690.
35. Humphrey, W.; Dalke, A.; Schulten, K. VMD: Visual Molecular Dynamics. J. Mol.
Graph. 1996, 14, 33-38.
36. Róg, T.; Murzyn, K.; Hinsen, K.; Kneller, G. R. nMoldyn: A Program Package for a Neutron Scattering Oriented Analysis of Molecular Dynamics Simulations. J. Comput. Chem.
2003, 24, 657-667.
37. Shannon, R. D. Ionic Conductivity in Sodium Magnesium Silicates. Phys. Chem. Miner.
1979, 4, 139-148.
38. Nakashima, Y.; Sakamoto, W.; Maiwa, H.; Shimura, T.; Yogo, T. Lead-Free
Piezoelectric (K,Na)NbO3 Thin Films Derived from Metal Alkoxide Precursors. Jpn. J. Appl. Phys. 2007, 46, L311-L313.
39. Thompson, J. G.; Withers, R. L.; Palethorpe, S. R.; Melnitchenko, A. Cristobalite-Related Oxide Structures. J. Solid State Chem. 1998, 141, 29-49.
40. Irvine, J. T. S.; Sinclair, D. C.; West, A. R. Electroceramics: Characterization by Impedance Spectroscopy. Adv. Mater. 1990, 2, 132-138.
41. Kuang, X.; Green, M. A.; Niu, H.; Zajdel, P.; Dickinson, C.; Claridge, J. B.; Jantsky, L.; Rosseinsky, M. J. Interstitial Oxide Ion Conductivity in the Layered Tetrahedral Network Melilite Structure. Nat. Mater. 2008, 7, 498-504.
42. Li, M.; Pietrowski, M. J.; De Souza, R. A.; Zhang, H. R.; Reaney, I. M.; Cook, S. N.; Kilner, J. A.; Sinclair, D. C. A Family of Oxide Ion conductors Based on the Ferroelectric Perovskite Na0.5Bi0.5TiO3. Nat. Mater. 2014, 13, 31-35.
43. Yang, X.; Liu, S.; Lu, F.; Xu, J.; Kuang, X. Acceptor Doping and Oxygen Vacancy Migration in Layered Perovskite NdBaInO4-Based Mixed Conductors. J. Phys. Chem. C 2016,
120, 6416-6426.
44. Stebbins, J. F.; Farnan, I.; Williams, E. H.; Roux, J. Magic Angle Spinning NMR Observation of Sodium Site Exchange in Nepheline at 500° C. Phys. Chem. Miner. 1989, 16, 763-766.
45. Peet, J. R.; Widdifield, C. M.; Apperley, D. C.; Hodgkinson, P.; Johnson, M. R.; Evans, I. R. Na+ Mobility in Sodium Strontium Silicate Fast Ion Conductors. Chem. Commun. 2015, 51, 17163-17165.
46. Udovic, T. J.; Matsuo, M.; Tang, W. S.; Wu, H.; Stavila, V.; Soloninin, A. V.; Skoryunov, R. V.; Babanova, O. A.; Skripov, A. V.; Rush, J. J.; Unemoto, A.; Takamura, H.; Orimo, S.-i. Exceptional Superionic Conductivity in Disordered Sodium Decahydro-closo-decaborate. Adv.
Mater. 2014, 26, 7622-7626.
47. Yamada, K.; Kumano, K.; Okuda, T. Conduction path of the Sodium ion in Na3InCl6