Bioimage informatics
PALMsiever: a tool to turn raw data into results
for single-molecule localization microscopy
Thomas Pengo
1,2,*
,†, Seamus J. Holden
3and Suliana Manley
3 1Design of Biological Systems, Systems Biology, Center for Genomic Regulation, Dr. Aiguader 88, 08003 Barcelona,
Spain,
2Advanced Light Microscopy Unit, Center for Genomic Regulation, Dr. Aiguader 88, 08003 Barcelona, Spain,
and
3Laboratory for Experimental Biophysics, Institute for Physics of Biological Systems, School of Basic
Sciences, Swiss Federal School of Technology, 1015 Lausanne, Switzerland
*To whom correspondence should be addressed.
†Part of this work was developed when TP was affiliated with EPFL3.
Associate Editor: Robert F. Murphy
Received on March 31, 2014; revised on October 17, 2014; accepted on October 27, 2014
Abstract
During the past decade, localization microscopy (LM) has transformed into an accessible,
commer-cially available technique for life sciences. However, data processing can be challenging to
the non-specialist and care is still needed to produce meaningful results. PALMsiever has been
developed to provide a user-friendly means of visualizing, filtering and analyzing LM data.
It includes drift correction, clustering, intelligent line profiles, many rendering algorithms and 3D
data visualization. It incorporates the main analysis and data processing modalities used by
experts in the field, as well as several new features we developed, and makes them broadly
access-ible. It can easily be extended via plugins and is provided as free of charge open-source software.
Contact: [email protected]
Eight years since its inception, single-molecule localization micros-copy (LM;Betzig et al., 2006; Rust et al., 2006) has transformed from a specialist technique in the hands of a few labs, to an access-ible, commercially available technique, widely used in the life sci-ences (Patterson et al., 2010). Although the instrumentation required for LM is now readily available, the data processing aspects of the technique remain less well developed. Most recent develop-ments in LM data processing have focused on extracting single mol-ecule localizations from the raw data (ISBI LM Challenge 2012, http://bigwww.epfl.ch/palm/), or visualization of processed data (Baddeley et al., 2010). However, these represent just the first and last steps of analysis. Equally important are the post-processing steps required to convert raw localizations to meaningful data. Filtering out spurious localizations, grouping and tracking of mul-tiple localizations, correcting drift, choosing the appropriate render-ing and performrender-ing statistical analysis on the localizations are just a few equally important aspects for which little software support exists (Wolter et al., 2012), leaving the non-specialist with the unnecessary burden of developing ad hoc solutions.
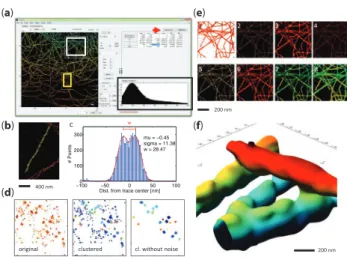
PALMsiever was made publicly available in 2012 (Pengo and Manley, 2012) to fill this void and has been under continuous devel-opment since then (ISBI LM Challenge 2012, http://bigwww.epfl.ch/ palm/). While other complementary tools have since been intro-duced (El Beheiry and Dahan, 2013; Ovesny et al., 2014), PALMsiever provides a single user-friendly extensible platform for LM data processing, combining visualization, post-processing, filter-ing and analysis features. The user interface (Fig. 1a) encourages data exploration, by rendering the data on-the-fly, interactively re-sponding to re-centering and zooming. Spurious localizations can be interactively eliminated by iteratively adjusting the display ranges for each of the available parameters, either directly by inspecting its histogram (Fig. 1ii), or automatically by removing the lower and upper 5% (Fig. 1a, arrow). Microscope drift during acquisition can be corrected using the 3D drift correction plugins, either by autocor-relation analysis or using fiducial markers. Line profiles (a simple right-click in the image) are automatically aligned to the underlying structure by principal components analysis and fitted to a Gaussian function. In the presence of curvilinear structures, the included
VCThe Author 2014. Published by Oxford University Press. 797
This is an Open Access article distributed under the terms of the Creative Commons Attribution Non-Commercial License (http://creativecommons.org/licenses/by-nc/4.0/), which permits non-commercial re-use, distribution, and reproduction in any medium, provided the original work is properly cited. For commercial re-use, please contact [email protected]
Bioinformatics, 31(5), 2015, 797–798 doi: 10.1093/bioinformatics/btu720 Advance Access Publication Date: 31 October 2014 Applications Note
tracing tool can automatically follow the structure (Fig. 1b) and gen-erate a fit from the projected profile (Fig. 1c). To compensate for the presence of multiple detections of the same molecule in successive frames, PALMsiever also includes a grouping algorithm, where de-tections are grouped into single molecules according to spatio-tem-poral proximity. Cluster analysis of interacting biomolecules is enabled by a plugin for the density-based cluster analysis DBSCAN (Endesfelder et al., 2013;Ester, 1996), which also facilitates noise removal (Fig. 1d, showing clustering of GaG-mEos2 data). Many rendering methods are available such as scatterplot, 2D histogram, blurred 2D histogram, automatic kernel density estimation (Botev, 2010), Delaunay triangulation, jittered 2D histogram, hue-encoded depth and a novel occluding hue-encoded depth (Fig. 1e, in the same order). Thanks to 3D data support across the software, 3D volumes can be easily exported to a TIFF stack, visualized as a 3D isosurface (Fig. 1f), explored using slicing, or rendered using either the classical hue-based depth coding, or a novel rendering that correctly accounts for overlapping structures. As an alternative, data can also be ex-ported for visualization with ViSP (El Beheiry and Dahan, 2013). PALMsiever has been designed with software interoperability in mind, so a number of predefined input file formats have been pro-vided, e.g. QuickPALM (Henriques et al., 2010), RapidSTORM (Wolter et al., 2012), Leica SR GSD (Leica Microsystems, Wetzlar, Germany), PeakSelector (courtesy of H.Hess, HHMI), uTrack (Jaqaman et al., 2008), Vutara (Vutara, Salt Lake City, Utah, USA) and Octane (Niu and Yu, 2008). It can also easily be extended to im-port other file formats by adding new imim-port filters or incorporate new analyses by writing plugins using MATLAB, and renderings can
also conveniently be made available to the system clipboard or saved as TIFFs for inclusion in presentations or publications. The software is open-source and can be downloaded (together with example data-sets) at http://code.google.com/p/palm-siever.
Acknowledgements
The authors thank N. Olivier for providing the 3D microtubule data (Olivier et al., 2013) and J. Gunzenha¨user for the Gag-mEos2 data (Gunzenhauser et al., 2012).
Funding
TP was supported by the Brazilian Swiss Joint Research Programme of the EPFL and the SystemTB Collaborative Project (Ref. 241587), funded by EU FP7. SH and SM were supported by ERC Starting Grant 243016. SH was sup-ported by a Marie Curie Intra-European Fellowship, PIEF-GA-2011-297918.
Conflict of Interest: none declared.
References
Baddeley,D. et al. (2010) Visualization of localization microscopy data, Microsc. Microanal. Off. J. Microsc. Soc. Am. Microbeam Anal. Soc. Microsc. Soc. Can., 16, 64–72.
Betzig,E. et al. (2006) Imaging intracellular fluorescent proteins at nanometer resolution. Science, 313, 1642–1645.
Botev,Z.I. et al. (2010) Kernel density estimation via diffusion. Ann. Stat. 2010, 38, 2916–2957.
El Beheiry,M. and Dahan,M. (2013) ViSP: representing single-particle local-izations in three dimensions. Nat. Methods, 10, 689–690.
Endesfelder,U. et al. (2013) Multiscale spatial organization of RNA polymer-ase in Escherichia coli. Biophys. J., 105, 172–181.
Ester,M.K., et al. (1996) A density-based algorithm for discovering clusters in large spatial databases with noise. In Proceedings of the Second International Conference on Knowledge Discovery and Data Mining, AAAI Press.
Gunzenhauser,J. et al. (2012) Quantitative super-resolution imaging reveals protein stoichiometry and nanoscale morphology of assembling HIV-Gag virions. Nano Lett., 12, 4705–4710.
Henriques,R. et al. (2010) QuickPALM: 3D real-time photoactivation nano-scopy image processing in ImageJ. Nat. Methods, 7, 339–340.
Jaqaman,K. et al. (2008) Robust single-particle tracking in live-cell time-lapse sequences. Nat. Methods, 5, 695–702.
Niu,L. and Yu,J. (2008) Investigating intracellular dynamics of FtsZ cytoskel-eton with photoactivation single-molecule tracking. Biophys. J., 95, 2009–2016.
Olivier,N. et al. (2013) Resolution doubling in 3D-STORM imaging through improved buffers. PLoS One, 8, e69004.
Ovesny,M. et al. (2014) ThunderSTORM: a comprehensive ImageJ plug-in for PALM and STORM data analysis and super-resolution imaging. Bioinformatics, 30, 2389–2390.
Patterson,G. et al. (2010) Superresolution imaging using single-molecule local-ization. Annu. Rev. Phys. Chem., 61, 345–367.
Pengo,T. and Manley,S. (2012) Software for the visualization and analysis of super-resolution localization microscopy data. In SSMLMS 2012, Aug 29–31 2012, Lausanne, Swizterland.
Rust,M.J. et al. (2006) Sub-diffraction-limit imaging by stochastic optical re-construction microscopy (STORM). Nat. Methods, 3, 793–795.
Wolter,S. et al. (2012) rapidSTORM: accurate, fast open-source software for localization microscopy. Nat. Methods, 9, 1040–1041.
−1000 −50 0 50 100 100 200 300 mu = −0.45 sigma = 11.38 w = 28.47
Dist. from trace center [nm]
# Points
(a) (e)
(b) (f)
(d)
Fig. 1. Single-molecule localization microscopy images, analyzed and ren-dered with PALMsiever. (a) The user interface encourages exploration of the data. The histogram (ii) of each parameter can be analyzed and automatically trimmed to exclude the upper and lower 5% (arrow). (b) A curvilinear seg-ment of a microtubule stained with alexa fluor 647 is traced and (c) the corres-ponding histogram and double gaussian fit generated. (d) gag-meos2 clusters, analyzed using a density-based clustering algorithm, which also allows to identify potential false localizations, i.e. Noise. (e) A microtubule section is rendered using the many rendering algorithms available. In order from 1 to 8: scatterplot, 2D histogram, blurred 2D histogram, kernel density estimation (a novel automatic bandwidth estimation rendering), delaunay triangulation, jittered histogram, encoded depth, a novel occluding hue-encoded depth. (f) A 3D isosurface reconstruction of the microtubule section microtubule presented in e