HAL Id: hal-00320356
https://hal.archives-ouvertes.fr/hal-00320356
Submitted on 25 May 2021HAL is a multi-disciplinary open access archive for the deposit and dissemination of sci-entific research documents, whether they are pub-lished or not. The documents may come from teaching and research institutions in France or abroad, or from public or private research centers.
L’archive ouverte pluridisciplinaire HAL, est destinée au dépôt et à la diffusion de documents scientifiques de niveau recherche, publiés ou non, émanant des établissements d’enseignement et de recherche français ou étrangers, des laboratoires publics ou privés.
amyloid plaques from APP/PS1 mice.
Marc Dhenain, Nadine El Tannir El Tayara, Ting Di Wu, Maryvonne Guégan,
Andreas Volk, Carmen Quintana, Benoit Delatour
To cite this version:
Marc Dhenain, Nadine El Tannir El Tayara, Ting Di Wu, Maryvonne Guégan, Andreas Volk, et al.. Characterization of in vivo MRI detectable thalamic amyloid plaques from APP/PS1 mice.. Neurobiol. Aging, 2009, 30 (1), pp.41-53. �10.1016/j.neurobiolaging.2007.05.018�. �hal-00320356�
Manuscript Draft
Manuscript Number: NBA-06-428R1
Title: Characterization of in vivo MRI detectable thalamic amyloid plaques from APP/PS1 mice
Article Type: Regular Article
Section/Category: Alzheimer's Disease & Other Dementias
Keywords: Alzheimer's disease; animal models; amyloid; APP; calcium; iron; mineralization; MRI; PS1; transgenic mouse.
Corresponding Author: Dr. Marc Dhenain, DVM, PhD
Corresponding Author's Institution: CNRS / CEA
First Author: Marc Dhenain, DVM, PhD
Order of Authors: Marc Dhenain, DVM, PhD; Nadine El Tannir El Tayara; Ting-Di Wu, PhD; Maryvonne Guegan; Andreas Volk, PhD; Carmen Quintana, PhD; Benoit Delatour, PhD
Abstract: Amyloid deposits are one of the hallmarks of Alzheimer's disease. Recent studies, in transgenic mice modeling Alzheimer's disease showed that, using in vivo, contrast agent-free, MRI, thalamic amyloid plaques are more easily detected than other plaques of the brain. Our study evaluated the characteristics of these thalamic plaques in a large population of APP/PS1, PS1 and C57BL/6 mice. Thalamic spots were detected in all mice but with different frequency and magnitude. Hence, the prevalence and size of the lesions were higher in APP/PS1 mice. Also, even in old mice, thalamic spots occurred in a subpopulation of the animals. In APP/PS1 mice, spots detection was related to high iron and calcium load within amyloid plaques and thus reflects the ability of such plaque to capture large amounts of minerals. Interestingly, calcium and iron was also detected in extra-thalamic plaques but with a lower intensity. Hypointense lesions in the thalamus were not associated with elevated local iron load, micro-hemorrhages, inflammation, or a neurodegenerative context. Their origin remains therefore to be determined.
1
Characterization of in vivo MRI detectable thalamic amyloid plaques from APP/PS1 mice
Marc Dhenaina,b,c,*, Nadine El Tannir El Tayarab,c, Ting-Di Wub,c, Maryvonne Guégand, Andreas Volkb,c, Carmen Quintanab,c,e, Benoît Delatourd
a URA CEA CNRS 2210, SHFJ, 4 Place du Général Leclerc, 91401 Orsay Cedex, France b
U759 INSERM. Centre Universitaire. Laboratoire 112, 91405 Orsay Cedex, France. c
Institut Curie. Centre Universitaire. Laboratoire 112, 91405 Orsay Cedex, France. d
Laboratoire NAMC, CNRS, UMR 8620, Bât 446, Université Paris Sud, 91405 Orsay, France.
e
Instituto de Microelectronica de Madrid - CSIC; 8, Isaac Newton, 28760 Tres Cantos (Madrid), Spain
*
Corresponding Author:
Marc Dhenain - URA CEA CNRS 2210, SHFJ, 4 Place du Général Leclerc, 914051 Orsay Cedex, France.
Tel: +33 1 69 86 77 58 ; Fax: +33 1 69 86 77 45 Mail: [email protected]
Abstract
Amyloid deposits are one of the hallmarks of Alzheimer's disease. Recent studies, in transgenic mice modeling Alzheimer's disease showed that, using in vivo, contrast agent-free, MRI, thalamic amyloid plaques are more easily detected than other plaques of the brain. Our study evaluated the characteristics of these thalamic plaques in a large population of APP/PS1, PS1 and C57BL/6 mice. Thalamic spots were detected in all mice but with different frequency and magnitude. Hence, the prevalence and size of the lesions were higher in APP/PS1 mice. Also, even in old mice, thalamic spots occurred in a subpopulation of the animals. In APP/PS1 mice, spots detection was related to high iron and calcium load within amyloid plaques and thus reflects the ability of such plaque to capture large amounts of minerals. Interestingly, calcium and iron was also detected in extra-thalamic plaques but with a lower intensity. Hypointense lesions in the thalamus were not associated with elevated local iron load, micro-hemorrhages, inflammation, or a neurodegenerative context. Their origin remains therefore to be determined.
Key words
Alzheimer’s disease, animal models, amyloid, APP, calcium, iron, mineralization, MRI, PS1, transgenic mouse.
1. Introduction
Senile plaques are one of the neuropathological hallmarks of Alzheimer’s disease (AD). These microscopic lesions are extracellular deposits of amyloid-β (Aβ) peptides surrounded by glial cells and dystrophic neurites. Their detection by histology is based on the use of specific dyes or antibodies directed against Aβ epitopes. Their detection by in vivo MRI is a challenge that might help diagnosing and following the pathology.
Several studies at high magnetic field have shown that amyloid plaques from various brain regions (isocortex, hippocampus, thalamus) can be detected as hypointense structures by MRI without contrast agent [3,13,17,34]. These studies also highlighted the particular behavior of a subset of thalamic plaques that are more easily detected by in vivo MRI than plaques from the isocortex or hippocampus. Indeed in these studies, thalamic plaques appeared to be larger than the isocortical/hippocampal plaques on the MR images [13] and can be detected by MRI even when the isocortical/hippocampal plaques are not visible [34]. Two previous studies were designed to describe more finely the nature of MRI-detected thalamic plaques and revealed their association with very dense iron aggregates [13,34]. These two studies were however performed on a small number of animals and did not focus on the exact nature/origin of these neuropathological lesions neither on their association with overall levels of brain amyloidosis. In the present study we tried to characterize these thalamic alterations, using different complementary approaches (MRI, neurohistology, ultrastructural and elemental analyses) in a large population of APP/PS1 and control PS1 or C57BL/6 mice, at various ages corresponding to graded neuropathological stages. We showed that thalamic spots occur only in a subpopulation of APP/PS1 mice and that they are related to a ferro-calcification of the amyloid deposits leading to the presence of dense aggregates in their core. The mechanisms associated with the modifications of the thalamic plaques detected by MRI were assessed in a second part of the study. First, because amyloid deposits can trap
endogenous iron [8], it is possible that local increased iron loads in plaque-enriched areas (i.e. thalamus) is a causative factor. To address this possibility we assessed correlations between iron levels in the thalamus and the occurrence of hypointense spots and ferro-calcic aggregates. Another hypothesis is that thalamic spots reflect some localized and iron-associated neuropathological alterations. For example, they might be related to small deep infarcts leading to micro-hemorrhages. Such lesions were therefore investigated by neuropathology. Alternative explanations for MR-detected thalamic hypointensities, such as inflammation were also addressed. Finally, the relationship between ferrocalcinosis of the plaques and markers of excitotoxicity was evaluated.
2. Subjects & Methods
2.1. Animals
Experiments were conducted on female APP/PS1 transgenic mice overexpressing amyloid precursor (APP) and presenilin 1 (PS1) mutations associated with familial AD (Double Thy1 APP751 SL (Swedish (KM670/671NL) and London (V717I) mutations introduced in the human APP751 sequence) x HMG PS1 M146L transgenic mouse line [2,36]. In these animals, the amyloid deposition starts at the age of 2.5 months [2,36]. Amyloid free female PS1 transgenics and wild-type C57BL/6 animals were used as controls.
2.2. MRI evaluation of thalamic hypo-intense spots and image analysis
Thirty two APP/PS1 (27 to 103 weeks old) and 36 PS1-amyloid free mice (27 to 104 weeks old) were studied using in vivo MRI. Eleven mice (7 APP/PS1 and 4 PS1) were followed longitudinally for a period of up to 43 weeks. Post mortem MR imaging was performed in 32 APP/PS1, 26 PS1, and 9 C57BL/6 mice (44 to 98 weeks old). To address correlations between in vivo and post mortem measurements, only mice that underwent two
assessments with a maximal in-between delay of 4 weeks were selected (23 APP/PS1 and 20 PS1 animals).
MRI studies were performed on a 4.7 Tesla Bruker Biospec 47/30 system, equipped with a 12 cm diameter gradient system (200 mT/m). A surface coil (diameter = 30 mm), actively decoupled from the transmitting birdcage probe (Bruker GmbH) was used for signal acquisition.
2.2.1 In vivo three dimensional imaging
For in vivo experiments, animals were anesthetized with isoflurane (5% for induction, 1-1.5% for maintenance) in a mixture of N2 (80%) and O2 (20%) administered via a facemask. Respiration rate was monitored to insure animal stability until the end of the experiment. Body temperature of the mice was maintained by using water filled heating blanket. For all the mice studied by in vivo MRI, images were recorded by using a T2*w gradient echo (GE) sequence (TR=47.4 ms, TE=20 ms, Alpha=15°, spectral width (SW)=50 KHz, field of view (FOV)=3x1.5x1.5 cm3, matrix=128x128x128, resolution=234x117x117 µm3, signal averaging (NA)=4, imaging time=51 min). In addition, for some mice (8 APP/PS1 and 16 PS1 mice), 3D GE images were recorded with a T1-weighted (T1w) protocol (TR=25 ms, TE=2.9 ms,
Alpha=30°, SW=50 KHz, FOV=3x1.5x1.5 cm3, matrix=128x128x128,
resolution=234x117x117 µm3, NA=8, imaging time=51 min). Three dimensional T2w fast spin echo images were also recorded for most of the mice (28 APP/PS1 and 29 PS1 mice) to control for the anatomy of the brain (lack of tumor for example) (TR=2500 ms, TE=14 ms, wTE=105, RareFactor=16, SW=37 KHz, FOV=3x1.5x1.5 cm3, matrix=128x128x128, resolution=234x117x117 µm3, NA=1, imaging time=51 min).
2.2.2. Post mortem three dimensional imaging
After animal death, brains were fixed for at least one week in 10% buffered formalin. Then, each brain was put in a small Plexiglass container and embedded in a 2.5% agar gel
before being imaged by MRI. Three dimensional T2*w GE images were recorded for all brains studied by post mortem MRI (n=32 APP/PS1; n=28 PS1; n=9 C57BL/6 mice; TR=100 ms, TE=20 ms, alpha=15°, SW=25 KHz, FOV=1.6x1.2x0.75 cm3, matrix=256x256x128, resolution=63x47x59 µm3, NA=8, imaging time=7 hours). In addition, a 3D T1w spin echo protocol was also used to record images from some brains (n=23 APP/PS1 and n=14 PS1 mice) (TR=200 ms, TE=10 ms, SW=25 KHz, FOV=1x1.5x0.75 cm3, matrix=128x256x128, resolution=78x58x58 µm3, NA=1, imaging time=8 hours). T1w images were not recorded for most of the animals that did not display hypointense thalamic spots on 3D T2*w image, as after preliminary experiments (see also results), we found that hypointense thalamic spots were never detected with the T1w protocol without being detected in T2*w images.
2.2.3. MR Images processing: Quantification of hypointense spot sizes
The size of the spots detected on the in vivo and post mortem 3D T2*w GE were assessed using the Display freeware (available at ftp.bic.mni.mcgill.ca). This freeware allows manual painting of pixels that have intensity below an intensity threshold that can be selected by the user. Then it can automatically count the number of labeled voxels. In our study, the threshold used to consider a voxel as belonging to the thalamic spots was calculated as follows. First a region of interest (ROI) was outlined within the mediodorsal and posterior thalamic nuclei, underneath the fornix bundles, a region located between the typical location of the hypointense thalamic spots (in the vicinity of ventral posteromedial (VPM) thalamic nuclei; see results). The mean (M) and standard deviation (SD) of the intensity of the pixels located in this ROI were measured (Image J software). Then the threshold (T) was calculated as (T = M – 2.576*SD) (2.576 corresponds to a 1 % confidence interval for a Gaussian population). The sizes of the hypointense spots were evaluated on the right and left hemispheres, and the values from each hemisphere were summed-up.
2.3. Neuropathology
2.3.1. Tissue processing and histochemical staining
After imaging, the brains from 22 APP/PS1, 22 PS1, and from the 5 oldest C57BL/6 (92 to 98 weeks old) mice were processed for histology. They were stored overnight in a solution of 20% glycerin and 2% dimethylsulfoxide (DMSO-G) in 0.1 M phosphate buffer for cryoprotection. Then, they were cut into 40 µm-thick coronal sections on a freezing microtome. One out of eight serial floating sections were rinsed with 0.1 M phosphate buffer and mounted on Superfrost plus glass slides before being processed for Nissl, Congo red, and Perls staining.
2.3.2. Histochemical staining of amyloid plaques
On a first batch of serial sections, ranging from the frontal to the occipital poles, amyloid deposits were labeled by standard Congo red staining (30 min in a 80% ethanol solution saturated with congo red and sodium chloride; adapted from [23]). Slices were observed by means of standard light microscopy and also using a confocal laser-scanning microscope equipped with krypton–argon 488–568 lasers (Bio-Rad Laboratory MRC1024ES, 510 LSM, Zeiss, Germany). Each slice was then digitized using a Super CoolScan 8000 ED high-resolution scanner (Nikon, Champigny sur Marne, France). Regional amyloid load (expressed as percent of tissue surface stained by the Congo red dye) was quantified in the thalamus using computer-based thresholding methods as previously described [6] .
2.3.3. Histochemical staining of iron
Iron staining was performed on serial sections using a protocol derived from the standard Perls-DAB method [21]. Briefly, all reactions were carried out on free floating sections to ameliorate tissue penetration of reactives. Blockade of endogenous peroxydase activity was first done by immersion in a methanol/H2O2 solution. Sections were then treated
with equal parts of freshly made, aqueous potassium ferrocyanide (2%) and hydrochloric acid (2%) for 20 min. Iron staining was finally intensified using diaminobenzidine (DAB) as chromogen. Brain sections for all PS1 and APP/PS1 mice were simultaneously processed, and incubation in DAB, which was monitored under the microscope to avoid strong background staining, was of the same duration for all animals. After staining, sections were mounted on Superfrost plus slides (Fischer Bioblock Scientific, Ilkirch, France), dehydrated and coverslipped for microscopic examination. All slides were digitized as described above. The surface (number of pixels) of iron-positive thalamic spots was manually assessed under Photoshop 6 (Adobe, Paris, France) and overall optical densities from the thalamus were automatically calculated as described previously [8].
2.3.4. Complementary neuropathological examination
Mineralization of thalamic aggregates was evaluated by standard Alizarin red S staining [20]. The efficiency of this method was primarily tested on positive control tissue (canine skin showing calcifications caused by dermatitis) before being applied to mouse brain sections. The vascular architecture in the vicinity of thalamic spots was observed in thionin-stained material and infarcts were subsequently checked on Perls-thionin-stained sections. To evaluate levels of inflammation in thalamic areas with or without spots, tomato lectin (Lycopersicon esculentum; Vector Laboratories, Burlingame, USA, 1:100) histochemistry was used to identify microglia with standard protocols [1]. Finally, to assess local neurodegeneration Fluoro-Jade B staining was performed on brain sections according to standard protocols [30].
2.4. Ultrastructural and analytical characterization
2.4.1. Brain tissue preparation
40 µm-thick brain coronal cryo-sections from one mouse with known thalamic pathology (spots/aggregates) were thawed in phosphate buffer, fixed in 4% PAF and 1% glutaraldheyde, and dehydrated in graded series of ethanol before being embedded in Lr-White resin at –20ºC for 72h. Some fragments were post-fixed with OsO4. Semi-thin sections, 0.5-1.5 µm thick, were obtained with an ultra-microtome and stained with toluidine blue. Selected semi-thin sections 300-400 nm thick and ultra-thin sections 40-60 nm thick were directly collected on silicon plates (for nanoSIMS), copper grids (for ultrastructural observations) and carbon-plastic covered gold grids (for immunocytochemistry).
2.4.2. Optical and electron microscopic observations
Optical microscopy observations from thalamic regions were first performed from semi-thin sections stained with toluidine blue. Transmission electron microscopic (TEM) studies were performed using analytical 120 kV or 200kV TEM on ultra-thin sections unstained or lightly stained with 2% uranyl acetate in water for 30-60 s.
Immunogold localization of β-amyloid was also performed for some sections using primary 4G8 antibody (Sigma, St. Louis, MO, USA). After 30 min incubation with Tris buffer–gelatin (TBG), the sections were floated for one hour on a drop of primary antibody diluted in TBG (1:100 dilution) at 37°C. Grids were then incubated in the secondary antibody (IgM conjugated with 10 nm colloidal gold at a dilution of 1:40 (BBInternational Immunogold conjugate EM GOAT F(ab')2 anti-mouse IgG+IgM:10nm) for one hour before being stained with a solution of 2% uranyl acetate for 30-60 sec.
2.4.3. NanoSIMS microscopy
Secondary Ion Mass Spectroscopy (SIMS) provides an in situ microanalysis based on the detection of ion species emitted from specimens under the bombardment of energetic primary ions. It allows identification of elements with high specificity and yields high detection sensitivity for chemical analysis even at trace level.
The SIMS instrument used in the present study was a NanoSIMS-50TM ion microprobe (CAMECA, France) equipped with dual primary sources (Cs+ or O- beam). Mapping of element distribution was done by scanning the object surface with the tightly focused primary ion beam. Specially designed for small area analysis, this instrument combines a high spatial resolution (with typical spot size of about 100 nm for Cs+ beam and 250 nm for O- beam), high sensitivity, as well as parallel detection capability for the record of up to five different ion species at the same time thus providing element maps with perfect co-localization [31]. Typical NanoSIMS applications in biology have been recently reviewed [12].
In the present study, analyses were performed on about 350 nm thick semi-thin sections of embedded material set on clean silicon plates. Using the Cs+ beam, maps of CN-, P-, and S- were recorded. The CN- image reveals the distribution of N in proteins and nucleic acids, which allows the visualization of the morphology of the sample. Ca+ and Fe+ maps were recorded using the O- beam. Details of the method are provided in [24].
3. Results
3.1. MRI-based characterization of the thalamic spots
3.1.1. In vivo images
In vivo 3D GE T2*-w MRI revealed hypointense spots in the thalamus of both
APP/PS1 and PS1 mice. These alterations were localized bilaterally in the ventral posterior region of the thalamus (Fig. 1). Spot prevalence was significantly higher in APP/PS1 mice (13 out of 32 mice) as compared to PS1 mice where it involved only two animals out of 36 (Fisher's exact test, p<0.001). In addition, in the two PS1 mice showing spots, the lesions were much smaller than in APP/PS1 mice as they measured one and five pixels (0.003 and 0.016 mm3), respectively, versus up to 181 pixels (0.580 mm3) in APP/PS1 mice.
In APP/PS1 mice the spot prevalence did not increase significantly in age groups constituted of animals older than 60 weeks as compared to 27-60 weeks old animals (prevalences of 53 and 33 %, respectively; Fisher's test, p=0.645, ns). Also, the prevalence of animals with large spots (>0.3 mm3) was not significantly increased in old animals group as compared to the 27-60 week animals group (21% versus 0% of the animals, respectively; Fisher's exact test, p=0.540, ns). In accordance with the lack of significant increased prevalence of spots/large spots in older APP/PS1 animals, no linear relationship could be found between the age of the animals and the size of the spots either when all animals or only those displaying spots ("spotty mice") were taken into account (rs<0.24; ps>0.05). Seven animals were followed longitudinally, but only one of them displayed spots. For this latter animal, an age-related growth of the spots was detected (Fig. 2a).
In in vivo MR images from APP/PS1 mice (but not from PS1 mice) recorded with the T1w protocol, the spots were also visible but with a smaller size when compared to T2*w images (Fig. 1). Spot detection in the so called T1w protocol was due to a residual T2* effect.
3.1.2. Post mortem images
Post mortem T2*w GE images confirmed the occurrence of hypointense spots in the thalamus of a subpopulation of APP/PS1 and PS1 mice (Fig. 1). Spots were also detected in old C57BL/6 mice (Fig 2b). Spots prevalence was higher in young (29-60 weeks) APP/PS1 mice as compared to young PS1 mice (63% of APP/PS1 mice diagnosed with spots versus 0% of PS1 animals; Fisher's test, p<0.5). On the other hand, spots prevalence was similar in older (>60 weeks) transgenics (79% of the old APP/PS1 mice diagnosed with spots versus 58% of the PS1 animals; Fisher's test, p=0.186). Spots were however larger in aged APP/PS1 mice as compared to PS1 or C57BL/6 animals (Fig. 2b-c). Hence, the percentage of animals with spots larger than 0.3 mm3 was significantly higher in aged APP/PS1 as compared to PS1 mice (Fisher's test, p<0.05) and the nine mice with the biggest spots were from the APP/PS1 genotype group (Fig. 2b). Due to the small number of animals, no statistical analysis could be performed to compare C57BL/6 animals and other strains, but the size of the detected spots in these animals was similar to that detected in PS1 animals.
In APP/PS1 animals, as for in vivo images, the prevalence of the spots was not significantly increased in older animals as compared to younger mice (Fisher's test, p=0.378, ns) (figure 2c) and the size of the spots measured on T2*w images were not correlated to the age of the animals (r=0.34; p=0.056). On the other side, in PS1 mice the prevalence of the spots occurrence was increased in older animals as compared to younger mice (Fisher's test, p<0.05). Also, in the PS1 genotype, the size of the spots was significantly correlated to the age of the animals (r=0.48; p<0.05). Old C57BL/6 mice also seemed to develop more spots than younger wild-type mice as none of the four 44 weeks old mice that we investigated had spots and five out of five 92-98 week mice investigated displayed spots (mean size = 0.029 mm3; size range = 0.005 – 0.073 mm3).
On the post mortem images recorded with the T1w protocol, hypointense structures could also be detected in the thalamus of animals that displayed spots on T2*w images. These hypointense alterations appeared as disseminated small aggregates rather than large globular structures as seen on T2*w images (Fig. 1).
Comparison of the size of the spots detected in vivo and post mortem T2*w images revealed a good correlation for APP/PS1 mice (r=0.96, p<0.001). For these animals, the equation of the curve fitting the size of the post mortem and in vivo spots was y = 2,262x - 0,02, which means that the size of the hypointense regions on T2*w post mortem images were more than two times larger than that of the spots on in vivo images. This may be explained by the slightly different sequence parameters used for the image recording. For PS1 mice, no significant correlation was found between the size of the spots measured in vivo and post mortem images (p>0.05). This could be explained by the reduced number of live PS1 mice diagnosed with spots (only two animals), probably because the size of the spots in PS1 mice was below the threshold of in vivo detectability.
3.2. In APP/PS1, but not in PS1 or C57BL/6 mice, thalamic spots are
matched with amyloid deposits containing mineralized ferro-calcic
aggregates
Dense clusters of iron positive structures (Fig. 3) were observed in the ventral posteromedial and posterior thalamic nuclei (VPM and Po) of 15 out of the 17 APP/PS1 mice diagnosed with post mortem MRI spots and subsequently processed for histology. Such lesions were never detected in animals that did not show spots on MR images. In addition, a strong positive correlation was obtained between the size of MRI spots in APP/PS1 mice (evaluated in vivo or ex vivo) and density of Perls-stained deposits (Table 1). Finally, registration of MR images and histological section with Perls-positive structures underlined a
high level of colocalization, reinforcing the contention that hypointense zones detected by MRI are indeed thalamic iron deposits (Fig. 3a-b).
On the other side, in PS1 mice showing thalamic MRI spots, we could detect iron deposits in only two animals (Fig. 3f). This may be explained by the small size of the lesions in PS1 mice, which makes them difficult to localize them on 40µm-thick serial histological sections (sampling bias). In C57BL/6 mice, iron deposits were also found in only two out of the five animals in which hypointense spots were detected on postmortem MR images.
In APP/PS1 mice, Perls-DAB stainings also showed discrete accumulation of iron in isocortical and hippocampal plaques (see left inset of Fig. 3b). PS1 (left inset, Fig. 3f) or C57BL/6, plaques-free, mice were devoided of such labeling.
On thionin-stained sections from APP/PS1 (but not from PS1) mice with hypointense thalamic spots in in vivo and/or post mortem MRI, the Perls-positive deposits appeared as dense-cored structures surrounded by microglial cells (Fig. 3e), reminiscent of inflammatory reaction generally seen in the vicinity of amyloid plaques. The location of iron deposits in the core of Aβ plaques was definitively confirmed by double (Congo red / Perls-DAB) staining (Fig. 3c). The morphology of Congo red-stained objects surrounding Perls-positive aggregates was further examined by means of confocal laser scanning microscopy and corroborated iron precipitates within amyloid plaques (Fig. 3d). Concerning PS1 mice neurohistological examination from Congo red stained sections did not reveal, as expected, any amyloid deposits.
Toluidine blue stained semi-thin sections from APP/PS1 mice with spots showed thalamic plaques of variable sizes (5-100 microns) presenting different levels of staining (classified as weak, heterogeneous, and intense) (Fig. 3g, Fig. 5). Weakly stained plaques analyzed with electron microscopy occasionally displayed sparse mineral structures (Fig. 4a-b) while plaques classified as heterogeneously stained with toluidine blue were invariably
constituted of Aβ fibrils intermingled with mineralized structures that did not show Aβ
immunoreactivity (Fig. 4 c-e). Finally deposits with intense toluidine blue staining had an electron dense mineralized core with concentric layers surrounded by amyloid fibers (Fig. 4f). NanoSIMS maps revealed the distribution of CN-, S-, P-, Ca+ and Fe+ within the toluidine blue labeled regions from heterogeneous deposits and from the intense deposits (Fig. 5). The CN- and S- nanoSIMS emission correspond to proteins or peptides (such as Aβ) and the high P-, Ca+ and Fe+ emission to mineralized phase. These results suggest that a mineralization process occurs within the thalamic amyloid plaques. The sparse mineral structures detected in amyloid plaques by TEM might be an early stage of the mineralization process while the strongly toluidine blue stained structures showing concentric layers on TEM images could represent the later stages of plaque mineralization.
Calcium deposition within thalamic plaques was confirmed by histochemical staining of 40 microns sections with Alizarin red S. Notably, Alizarin red staining was also detected in isocortical and hippocampal plaques of APP/PS1 mice and in thalamic plaques from animals without aggregates. However, the staining was much stronger in thalamic plaques containing aggregates than in other amyloid deposits (Fig. 3h).
3.3. Relationship between thalamic aggregates and histological markers
of brain alterations ?
3.3.1. Relationship with overall A
β
deposition
The highest prevalence of spots in APP/PS1 mice as compared to PS1 (or C57BL/6) animals suggested that amyloid pathology favors the occurrence of such lesions. In addition, correlative studies in APP/PS1 mice revealed a statistically significant positive correlation between the size of the spots assessed from high-resolution post mortem images and the
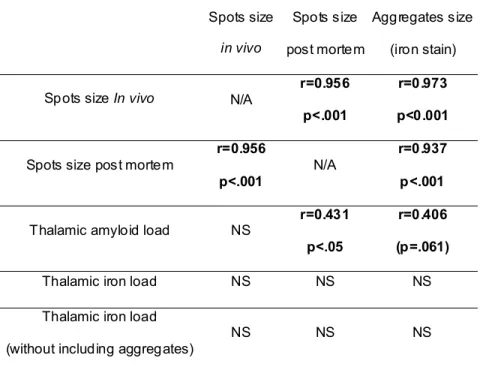
thalamic amyloid load (Table 1). There was also a trend for a linear positive correlation between the density of thalamic iron positive aggregates detected histologically and the local amyloid load (Table 1). The size of the spots measured with in vivo MRI did not however correlate with the thalamic amyloid load. This might be explained by the lower resolution of
in vivo MRI as compared to post mortem MRI but concurrently by a somehow poor linear
relationship between plaque burden and MRI hypointensities.
3.3.2. Relationship with cerebral iron deposition and distribution
Correlational analysis was also carried out to determine the relationship between local iron aggregates in thalamic nuclei and the overall distribution of iron within this brain structure. This analysis was only performed in APP/PS1 mice (as only two PS1 and two C57BL/6 mice showed Perls-positive aggregates) and showed no correlation between iron cluster density and Perls optical density of the thalamus (Table 1). Also the density of spots assessed by in vivo or post mortem MRI did not correlate with Perls thalamic optical density (Table 1), indicating that iron levels in this brain region was not linked to the occurrence or lack of spots/aggregates.
3.3.3. Relationship with vascular impairments
Post mortem histological analysis did not show any vascular impairment in mice displaying thalamic aggregates. First, no histological signs evocative of thalamic infarcts could be detected, neither on thionin nor on Perls-stained sections although small extra-thalamic infarcts were occasionally observed (Fig. 6). In addition, blood vessels examined in Nissl-stained sections (by increasing depth of field of microscopical images) showed no obvious anomalies in vascular architecture in the vicinity of the thalamic spots in APP/PS1 mice.
3.3.4. Relationship with inflammation and neurodegeneration
Lectin histochemistry showed no inflammation in PS1 mice. On the contrary, a heavy inflammatory reaction was observed in APP/PS1 animals, with all amyloid plaques being associated with peripheral reactive microglia. There was no qualitative difference in levels of inflammation between plaques with or without iron aggregates, in the thalamic and extra-thalamic regions (Fig. 7a-b).
The Fluoro-Jade dye remarkably stained the core of amyloid deposits and degenerating dystrophic neurites from APP/PS1 mice (Fig. 7 c-f). No neuronal labeling was noted but star-shaped cells with the reminiscent morphology of astrocytes showed evidence of positive staining. There was no staining difference between APP/PS1 mice lacking aggregates and mice developing these lesions. In particular no evidence of neuronal degeneration was observed in the periphery of thalamic aggregates.
4. Discussion
4.1. General characterization of thalamic spots in APP/PS1, PS1, and
C57BL/6 mice
MR images recorded in a large cohort of APP/PS1, PS1, and C57BL/6 mice studied at different ages allowed detecting hypointense thalamic spots. Previous MRI studies [13,34] reported similar brain anomalies in APP or APP/PS1 mice, but, to our knowledge, not in wild type or PS1 control mice. In our study, the prevalence and size of the spots was however higher in APP/PS1 as compared to control (PS1, C57BL/6) mice, which suggests that amyloidosis favors the occurrence of such MRI detectable lesions. In PS1 and C57BL/6 mice, we showed that the prevalence and size of the lesions was age dependent. On the other side, in APP/PS1, even if some trend was visible, the prevalence and size of the lesions were not significantly increased with aging.
In APP/PS1 mice, the MRI detected spots were caused by parenchymal mineral structures, composed of iron and various minerals such as calcium or phosphorus, co-localized with amyloid deposits. On the other side, in PS1 or C57BL/6 mice, the spots were related to discrete small-size iron deposits in the absence of amyloid plaques. The presence of iron aggregates in the thalamus of very old wild type mice has already been described in other studies [10]. All these observations suggest that such alterations are not specifically related to the PS1 transgene, but are mainly a characteristic of aged normal mice.
4.2. High level of ferrocalcification of thalamic amyloid plaques as
compared to other plaques is responsible for their better detection on
MR images
In a second part of the study, we focused on the fine characterization of the ferrocalcification process occurring in the thalamic MRI detectable plaques from APP/PS1 mice. Histological, TEM and microanalysis studies showed different stages of iron deposition and calcifications within the thalamic amyloid deposits. In fact several forms of iron deposits ranging from sparse punctuated deposits to dense-core globular aggregates were detected. Regarding calcification, some amyloid deposits displayed sparse calcification, others presented more severe mineralization involving the center or the periphery of the plaques and, finally, massive mineral aggregates were detected in some plaques.
We also showed that amyloid plaques from other brain regions (eg isocortex, hippocampus) were stained for iron and calcium, although with a much reduced intensity than the thalamic plaques. Iron deposition within amyloid plaques has already been reported in transgenic mice [8,9] as well as in humans [18,33]. Calcium deposition within plaques has also been described in humans [35]. This suggests that ferro-calcic deposition is a common process occurring in most plaques both in animals and humans. This deposition is however relatively mild in isocortical and hippocampal plaques as compared to what occurs in the
thalamic plaques of transgenic mice. The high dense ferro-calcic deposition observed in thalamic plaques might thus be considered as an amplified end-product resulting from a general process that occurs in all amyloid plaques. This process is of interest because it modifies the NMR properties of the plaques and makes them easily detectable by in vivo MRI without contrast agent.
Previous studies at higher magnetic field have shown that isocortical and hippocampal plaques can also be detected by MRI without contrast agents [3,13,17,34]. In our experimental conditions, isocortical and hippocampal plaques were not detected. This is probably only related to the relatively low magnetic field that we used as compared to other studies. More interestingly, the studies that were able to detect plaques in the whole brain by MRI without contrast agents showed that all the plaques could not be detected and a recent report suggested that iron depositions within the plaques is a critical event making plaque detection possible. One can expect that mechanisms involved in iron deposition within the isocortical and hippocampal plaques are the same as the one that occurred, although amplified, for the thalamic plaques.
One important difference between the thalamic plaques and isocortical/hippocampal plaques detected by MRI in previous studies is that, as shown in our study, the thalamic lesions detected by in vivo MRI are not correlated to (thus not very representative of) the brain amyloidosis. The facilitated detection of these lesions by MRI even at relatively low field thus does not seem to be usable to assess amyloid loads. Conversely, hippocampal and isocortical plaques detected on in vivo and ex vivo MRI without contrast agent are correlated with the amyloid load [14]. It is therefore tempting to conclude that extra-thalamic plaques are a better target for relevant biomarker investigations than easily-MRI-detectable thalamic plaques.
4.3. The stress hypothesis
Several hypothesis were evaluated to explain the high ferrocalcification of amyloid plaques in APP/PS1 mice. It might be tempting to posit ischemic or excitotoxic events in the thalamus of our APP/PS1 mice as promoting increased local calcium aggregation and its association with amyloid deposits. Indeed, reports from the literature suggest that hypoxic/ischemic alterations can lead to mineralization in the central nervous system including the thalamus [15]. Such process might be worsened in APP transgenic mice as they have increased vulnerability to brain ischemia [16,28]. Also several reports from experimental studies in animals suggest a critical role of excitotocity in the genesis of calcified deposits [11,19,22,27,32]. Hence excitotoxic lesions induced by stereotaxic microinjection of glutamate agonists can modify calcium homeostasis and are associated with massive intracellular Ca2+ increase leading to its precipitation [27]. However, in our study, histological
examination did not reveal any sign of local excitotoxic background around thalamic aggregates. First, no necrotic/picnotic neurons were observed around ferro-calcic deposits (data not shown). Also Fluoro-Jade B staining did not reveal local degeneration associated with thalamic aggregates: star-shaped cells (presumably astrocytes) were stained by the dye as already described in primates and AD patients [4] as well as in transgenic mice with brain amyloidosis [5] but no degenerating neurons were found, neither in the VPM/Po thalamic nuclei nor in other brain areas. Dystrophic enlarged neurites forming the crown of senile plaques also showed positive Fluoro-Jade staining. These observations fit well with the generally accepted assumption that transgenic mice modeling AD’s brain amyloidosis do not develop overt neurodegeneration [7]. In addition there was no exacerbated inflammation around the mineralized plaques compared to other plaques with almost all Aβ deposits being associated with strong microgliosis. Finally we did not detect any neuropathological evidence of microinfarcts or vascular alterations. Also, no obvious cell loss or ischemia-related
pathology was noted in the vicinity of thalamic aggregates. These observations contradict the hypothesis that excitotoxic/inflammatory/vascular/hypoxic alterations are responsible for mineralized lesions associated with the MRI spots in APP/PS1 mice. In addition, neurological and cognitive evaluation of APPSL mice (another transgenic line in which we detected hypointense thalamic spots caused by local iron clustering) did not highlight any relationship between the presence of aggregates and behavioral impairments (data not shown).
4.4. The bioflocculant hypothesis
Alternative hypothesis can be provided to explain increased ferro-calcic aggregation in the amyloid plaques from the thalamus. The association between iron and Aβ is in keeping with the fact that Aβ is a metalloprotein with known binding sites for metal ions at histidine and tyrosine residues. The local presence of biometals such as iron in plaques could be explained by the sequestration function of Aβ deposits directed against extracellular potentially neurotoxic solutes [26]. The overall thalamic iron pool does not seem however to be directly responsible for the formation of iron containing aggregates as we noticed no relationship between spots prevalence and iron level in the entire thalamus. Furthermore, by post mortem MRI, we showed that iron-associated spots occurred in VPM/Po nuclei of 58% of the old PS1 animals and in all the old evaluated C57BL/6 mice. This suggests that VPM/Po nuclei are prone to iron accumulation even in aged amyloid-free mice. In APP/PS1, such iron is probably trapped within the plaques lesions. Concerning the association between calcium and amyloid, it is known that calcification processes require a matrix on which calcium and other minerals are trapped and amyloid proteins may serve as such matrix [25,29].
5. Conclusion
To conclude, MRI detectable thalamic spots are recently discovered Aβ-associated lesions, reported at least in four different transgenic lines ([13,34], present study, APPSL
monogenic model: unpublished observations). They are late and somehow “distant” markers of brain amyloidosis that are associated with ferrocalcinosis of the amyloid deposits. Such lesions are presumably related to an amplified process that also occurs, with less intensity, in amyloid plaques from other brain regions such as the isocortex or the hippocampus. These lesions might be related to the ability of amyloid plaques to capture a large amount of iron and calcium. While our data do not suggest direct relationship between brain stress or neurodegeneration and thalamic ferrocalcinosis, it remains unclear whether iron-calcium aggregates mediate toxicity or represent a compensatory neuronal protective mechanism in old animals and in mice developing brain amyloidosis.
Acknowledgements
We thank the Sanofi-Aventis Neurodegenerative Disease Group for the generous gift of the animals involved in this study. This work was supported by the Aging ATC 2002 (INSERM), the Fédération pour la Recherche sur le Cerveau 2003, the Del Duca Foundation, the ACI Neurosciences 2004 (French Research Department), the Ministerio de Educación, Cultura y Deporte (Spain) (grant PR2002-0261), and grant BMC2002-00996 from the Dirección General de Investigación (Spain). We are grateful to R. Arranz and C. Patiño for helpful assistance in immunocytochemical studies and to Dr S. Davis for carefully reading and correcting the manuscript.
Disclosure Statement
Marc Dhenain: None
Nadine El Tannir El Tayara: None Ting-Di Wu: None
Maryvonne Guégan: None Andreas Volk: None Carmen Quintana: None
References
[1] Acarin L, Vela JM, Gonzalez B, Castellano B. Demonstration of poly-N-acetyl lactosamine residues in ameboid and ramified microglial cells in rat brain by tomato lectin binding. J Histochem Cytochem 1994;42(8):1033-41.
[2] Blanchard V, Moussaoui S, Czech C, Touchet N, Bonici B, Planche M, Canton T, Jedidi I, Gohin M, Wirths O, Bayer TA, Langui D, Duyckaerts C, Tremp G, Pradier L. Time sequence of maturation of dystrophic neurites associated with Ab deposits in APP/PS1 transgenic mice. Exp Neurol 2003;184(1):247-63.
[3] Braakman N, Matysik J, van Duinen SG, Verbeek F, Schliebs R, de Groot HJ, Alia A. Longitudinal assessment of Alzheimer's beta-amyloid plaque development in transgenic mice monitored by in vivo magnetic resonance microimaging. J Magn Reson Imaging 2006.
[4] Colombo JA, Puissant VI. Fluoro Jade stains early and reactive astroglia in the primate cerebral cortex. J Histochem Cytochem 2002;50(8):1135-7.
[5] Damjanac M, Bilan AR, Barrier L, Pontcharraud R, Anne C, Hugon J, Page G. Fluoro-Jade((R)) B staining as useful tool to identify activated microglia and astrocytes in a mouse transgenic model of Alzheimer's disease. Brain Res 2007;1128(1):40-9.
[6] Delatour B, Guegan M, Volk A, Dhenain M. In vivo MRI and histological evaluation of brain atrophy in APP/PS1 transgenic mice. Neurobiol Aging 2006;27(6):835-47. [7] Delatour B, Le Cudennec C, El Tannir-El Tayara N, Dhenain M. Transgenic models
of Alzheimer's pathology: Success and caveat. Progress in Alzheimer's Disease Research: Nova; In Press.
[8] El Tannir El Tayara N, Delatour B, Le Cudennec C, Guegan M, Volk A, Dhenain M. Age-related evolution of amyloid burden, iron load, and MR relaxation times in a transgenic mouse model of Alzheimer's disease. Neurobiol Dis 2006;22(1):199-208. [9] Falangola MF, Lee SP, Nixon RA, Duff K, Helpern JA. Histological co-localization of
iron in Abeta plaques of PS/APP transgenic mice. Neurochem Res 2005;30(2):201-5. [10] Fraser H. Bilateral thalamic calcification in ageing mice. J Pathol Bacteriol
1968;96(1):220-2.
[11] Gayoso MJ, Al-Majdalawi A, Garrosa M, Calvo B, Diaz-Flores L. Selective calcification of rat brain lesions caused by systemic administration of kainic acid. Histol Histopathol 2003;18(3):855-69.
[12] Guerquin-Kern JL, Wu TD, Quintana C, Croisy A. Progress in analytical imaging of the cell by dynamic secondary ion mass spectrometry (SIMS microscopy). Biochim Biophys Acta 2005;1724(3):228-38.
[13] Jack CR, Jr., Garwood M, Wengenack TM, Borowski B, Curran GL, Lin J, Adriany G, Grohn OH, Grimm R, Poduslo JF. In vivo visualization of Alzheimer's amyloid plaques by magnetic resonance imaging in transgenic mice without a contrast agent. Magnet Reson Med 2004;52(6):1263-71.
[14] Jack CR, Jr., Wengenack TM, Reyes DA, Garwood M, Curran GL, Borowski BJ, Lin J, Preboske GM, Holasek SS, Adriany G, Poduslo JF. In vivo magnetic resonance microimaging of individual amyloid plaques in Alzheimer's transgenic mice. J Neurosci 2005;25(43):10041-8.
[15] Kato H, Araki T, Itoyama Y, Kogure K. Calcium deposits in the thalamus following repeated cerebral ischemia and long-term survival in the gerbil. Brain Res Bull 1995;38(1):25-30.
[16] Koistinaho M, Kettunen MI, Goldsteins G, Keinanen R, Salminen A, Ort M, Bures J, Liu D, Kauppinen RA, Higgins LS, Koistinaho J. Beta-amyloid precursor protein transgenic mice that harbor diffuse A beta deposits but do not form plaques show increased ischemic vulnerability: role of inflammation. P Natl Acad Sci USA 2002;99(3):1610-5.
[17] Lee SP, Falangola MF, Nixon RA, Duff K, Helpern JA. Visualization of beta-Amyloid plaques in a transgenic mouse model of Alzheimer's disease using MR microscopy without contrast reagents. Magnet Reson Med 2004;52:538-44.
[18] LeVine SM. Iron deposits in multiple sclerosis and Alzheimer's disease brains. Brain Res 1997;760(1-2):298-303.
[19] Mahy N, Bendahan G, Boatell ML, Bjelke B, Tinner B, Olson L, Fuxe K. Differential brain area vulnerability to long-term subcortical excitotoxic lesions. Neuroscience 1995;65(1):15-25.
[20] Mc Gee-Russell SM. Histochemical methods for calcium. J Histochem Cytochem 1958;6(1):22-42.
[21] Nguyen-Legros J, Bizot J, Bolesse M, Pulicani J-P. "Noir de diaminobenzidine" : une nouvelle méthode histochimique de révélation du fer exogène ("Diaminobenzidine black": A new histochemical method for the visualization of exogenous iron). Histochemistry 1980;66:239-44.
[22] Petegnief V, Saura J, Dewar D, Cummins DJ, Dragunow M, Mahy N. Long-term effects of alpha-amino-3-hydroxy-5-methyl-4-isoxazole propionate and 6-nitro-7-sulphamoylbenzo(f)quinoxaline-2,3-dione in the rat basal ganglia: calcification, changes in glutamate receptors and glial reactions. Neuroscience 1999;94(1):105-15. [23] Puchtler H, Sweat F, Levine M. On the binding of Congo red by amyloid. J Histochem
[24] Quintana C, Bellefqih S, Laval JY, Guerquin-Kern JL, Wu TD, Avila J, Ferrer I, Arranz R, Patino C. Study of the localization of iron, ferritin, and hemosiderin in Alzheimer's disease hippocampus by analytical microscopy at the subcellular level. J Struct Biol 2006;153(1):42-54.
[25] Reinus WR, Kyriakos M, Gilula LA, Brower AC, Merkel K. Plasma cell tumors with calcified amyloid deposition mistaken for chondrosarcoma. Radiology 1993;189(2):505-9.
[26] Robinson SR, Bishop GM. Abeta as a bioflocculant: implications for the amyloid hypothesis of Alzheimer's disease. Neurobiol Aging 2002;23(6):1051-72.
[27] Rodriguez MJ, Bernal F, Andres N, Malpesa Y, Mahy N. Excitatory amino acids and neurodegeneration: a hypothetical role of calcium precipitation. Int J Dev Neurosci 2000;18(2-3):299-307.
[28] Sadowski M, Pankiewicz J, Scholtzova H, Li YS, Quartermain D, Duff K, Wisniewski T. Links between the pathology of Alzheimer's disease and vascular dementia. Neurochemical Research 2004;29(6):1257-66.
[29] Sano Y, Mihara M, Miyamoto T, Shimao S. Simultaneous occurrence of calcification and amyloid deposit in pilomatricoma. Acta Derm Venereol 1990;70(3):256-9.
[30] Schmued LC, Hopkins KJ. Fluoro-Jade B: a high affinity fluorescent marker for the localization of neuronal degeneration. Brain Res 2000;874(2):123-30.
[31] Slodzian G, Daigne B, Girard F, Boust F, Hillion F. Scanning secondary ion analytical microscopy with parallel detection. Biol Cell 1992;74(1):43-50.
[32] Stewart GR, Olney JW, Schmidt RE, Wozniak DF. Mineralization of the globus pallidus following excitotoxic lesions of the basal forebrain. Brain Res 1995;695(1):81-7.
[33] Thompson KJ, Shoham S, Connor JR. Iron and neurodegenerative disorders. Brain Res Bull 2001;55(2):155-64.
[34] Vanhoutte G, Dewachter I, Borghgraef P, Van Leuven F, Van der Linden A. Noninvasive in vivo MRI detection of neuritic plaques associated with iron in APP[V717I] transgenic mice, a model for Alzheimer's disease. Magnet Reson Med 2005;53(3):607-13.
[35] Watt F. Nuclear microscope analysis in Alzheimer's and Parkinson's disease: A review. Cell Mol Biol (Noisy-le-grand) 1996;42(1):17-26.
[36] Wirths O, Multhaup G, Czech C, Blanchard V, Moussaoui S, Tremp G, Pradier L, Beyreuther K, Bayer TA. Intraneuronal Abeta accumulation precedes plaque formation in beta-amyloid precursor protein and presenilin-1 double-transgenic mice. Neurosci Lett 2001;306(1-2):116-20.
Table and figures legends
Spots size in vivo Spots size post mortem Aggregates size (iron stain) Spots size In vivo N/A r=0.956p<.001
r=0.973 p<0.001
Spots size post mortem r=0.956
p<.001 N/A
r=0.937 p<.001
Thalamic amyloid load NS
r=0.431 p<.05
r=0.406 (p=.061)
Thalamic iron load NS NS NS Thalamic iron load
(without including aggregates) NS NS NS
Table 1. Correlation between the size of the spots in APP/PS1 mice (evaluated from in vivo and post mortem MRI) with different histological measurements: size of the aggregates, thalamic amyloid and iron loads. NS: Non significant (p>0.5); N/A: Non relevant measure.
Figure 1. a, b, d, e: Hypointense thalamic spots (arrows) in the brain of an APP/PS1 mouse. Spots were larger on T2*w images (a and d: post mortem and in vivo images, respectively) than on images recorded with the T1w protocol (b and e: post mortem and in vivo images). On the latter images, it is possible to see several distinct aggregates. On T2* MR images, objects containing iron do appear larger than their actual size. This is related to a so called "susceptibility effect". Distinct aggregates seen on T1w images had an increased apparent size
on the T2*w images and thus appeared as merged objects. c. Example of thalamic spots in T2*w post mortem images from a PS1 mouse (79 weeks old). f. The spots could not be detected on in vivo T2*w images from the same mouse. Scale bars: 2 mm.
Figure 2. (a) Size of the thalamic spots measured in in vivo images from APP/PS1 mice as a function of age. Dark lozenges represent animals from transversal studies. Seven animals were followed-up longitudinally and only one of them (white lozenges) had spots. The line represents the linear regression curve fitting the size of the spots to the age of this animal. (b) Size of the thalamic spots measured in post mortem images from APP/PS1, PS1 and C57BL/6 mice (for the C57BL/6 mice, the triangle symbol at 44 weeks correspond to 4 mice that did not show thalamic spots). (c) Prevalence of thalamic spots of various sizes in adult and old APP/PS1 (n=8 and 24, respectively) and PS1 (n=7 and 19, respectively) mice.
Figure 3. Colocalization of hypointense spots on MR images from an APP/PS1 mouse (a) and Perls-DAB positive (b) structures. In (b), right inset shows the Perls positive aggregates at high magnification; left inset illustrates (weak) iron deposition in the cortex associated with amyloid plaques (arrow heads). (c) Double (Congo red / DAB) stainings showing Perls-positive iron aggregates within amyloid plaques. Different levels of iron deposits are visible in various plaques: plaques with sparse iron staining (i) and plaques with medium to high densities (ii and iii) iron deposits. (d) Confocal microscopic image showing Congo red stained amyloid substance (red) surrounding an iron core (green; extrapolated and reconstructed from images taken under white light illumination). (e). Thionin section showing crystalline aggregate (*) surrounded by microglial cells (arrowheads). (f) Perls-DAB positive structures in the thalamus from PS1 mice; right inset shows the stained globular structures at higher magnification (same small-size iron aggregates were also observed in old non-transgenic
C57BL/6 mice); left inset shows no significant iron deposits in the cortical ribbon. (g) Toluidine blue stained semi-thin section of the thalamus of an APP/PS1 mouse showing deposits of variable sizes (5-100 µm) with different levels of staining: weak staining (white arrowheads), heterogeneous staining (gray arrowheads) and intense staining (black arrowheads). (h) Alizarin red staining in an APP/PS1 mouse that displayed hypointense spots on MRI images. Most of amyloid deposits showed weak labeling (white arrowheads) while thalamic plaques containing aggregates displayed intense staining (black arrowheads). All scale bars are in micrometers.
Figure 4. TEM images of amyloid deposits. (a) Amyloid deposit with sparse mineralized structures (seen at higher magnification in b). (c) Illustration of another stage of the mineralization process where mineralized regions (m) surrounds amyloid deposits (*). TEM images after immunolabelling with anti-Aβ antibodies coupled with colloidal gold were used to determine the extent of amyloid plaques (* on image d) and showed that the Aβ peptide was not immunodetected in smooth mineralized regions (e). In d and e, the insets correspond to a magnification of the outlined frame and show colloidal gold particles labeling the amyloid plaque. (f) Dense mineralized aggregates detected in APP/PS1 mice corresponding to an end-stage pathological process.
Figure 5. Optical and NanoSIMS analytical images of partially (a) and densely mineralized (b) plaques. Toluidine blue and CN- images show the morphology of the plaques. The distribution of calcium, phosphor, sulfur and iron in the plaques are shown on other frames. On a and b, image frames measure 65x65 and 55x55 µm, respectively.
Figure 6. Evaluation of vascular anomalies in APP/PS1 mice. Cortical infarcts such as those displayed on the figure were occasionally detected in the brain of APP/PS1 mice (Perls stain). Thalamic infarcts were never observed in animals displaying aggregates. Scale bars are in micrometers.
Figure 7. (a, b) Lectin histochemistry showing heavy inflammatory reaction surrounding amyloid deposits in APP/PS1 animals. Inflammation process surrounded the thalamic aggregates (arrows) but was not increased in mice with aggregates (a) compared with animals without thalamic aggregates (b). (c-f) Fluoro-Jade B stained the core of thalamic amyloid deposits of APP/PS1 mice with (c) or without (d) aggregates. (e) Plaques containing aggregates (arrowheads) were also positive for Fluoro-Jade; no degenerated neurons were observed in the vicinity of thalamic aggregates. (f) Fluoro-Jade also stained star-shaped cells with the reminiscent morphology of astrocytes (white arrowheads) and dystrophic neurites (black arrowheads) in all APP/PS1 mice.
Spots size in vivo Spots size post mortem Aggregates size (iron stain) Spots size In vivo N/A
r=0.956 p<.001
r=0.973 p<0.001
Spots size post mortem
r=0.956
p<.001 N/A
r=0.937 p<.001
Thalamic amyloid load NS r=0.431
p<.05
r=0.406 (p=.061)
Thalamic iron load NS NS NS Thalamic iron load
(without including aggregates)
NS NS NS
Table 1. Correlation between the size of the spots in APP/PS1 mice (evaluated from in vivo and post mortem MRI) with different histological measurements: size of the aggregates, thalamic amyloid and iron loads. NS: Non significant (p>0.5); N/A: Non relevant measure.