HAL Id: hal-00524168
https://hal-mines-paristech.archives-ouvertes.fr/hal-00524168
Submitted on 9 Mar 2011HAL is a multi-disciplinary open access
archive for the deposit and dissemination of sci-entific research documents, whether they are pub-lished or not. The documents may come from teaching and research institutions in France or abroad, or from public or private research centers.
L’archive ouverte pluridisciplinaire HAL, est destinée au dépôt et à la diffusion de documents scientifiques de niveau recherche, publiés ou non, émanant des établissements d’enseignement et de recherche français ou étrangers, des laboratoires publics ou privés.
Numerical modelling of thermal-electrical phenomena in
spark plasma sintering
Pamela Mondalek, Luisa Silva, Lise Durand, Michel Bellet
To cite this version:
Pamela Mondalek, Luisa Silva, Lise Durand, Michel Bellet. Numerical modelling of thermal-electrical phenomena in spark plasma sintering. Numiform 2010, 10th Int. Conf. on Numerical Methods in Industrial Forming Processes, Dedicated to Professor O. C. Zienkiewicz (1921–2009), Jun 2010, Pohang, North Korea. pp.Pages 697-704, �10.1063/1.3457623�. �hal-00524168�
NUMERICAL MODELLING OF THERMAL ELECTRICAL
PHENOMENA IN SPARK PLASMA SINTERING
P. Mondalek
a, L. Silva
a, L. Durand
b,cand M. Bellet
aa
Mines ParisTech, Centre de Mise en Forme des Matériaux (CEMEF), UMR CNRS 7635, Sophia Antipolis, France
b
CNRS CEMES (Centre d’Elaboration de Matériaux et d’Etudes Structurales), France
c
Université Paul Sabatier, Toulouse, France
Abstract. Spark Plasma Sintering belongs to a class of sintering techniques that employs electric current to assist compaction. The present paper addresses the numerical modelling of the coupled electrical and thermal problems. Numerical simulations are carried out for two samples (TiAl and alumina). The distribution of electric current and temperature are shown in the specimen as well as in the tooling, providing a better understanding of the SPS.
Keywords:Finite element method, Spark plasma sintering, powder compaction.
INTRODUCTION
Spark Plasma Sintering (SPS) process is a revolutionary high speed powder consolidation technology. This process presents many benefits such as reduced sintering times and capacity of producing materials with excellent properties. In fact, the speed of the process allows powder densification with nanostructured materials. The SPS is used to produce different materials like ceramics, composites, metals and also intermetallic alloys that are difficult to form with conventional techniques due to their different melting temperatures.
This technology seems very promising in the aeronautic sector. Application of the SPS to high performance intermetallics should allow their cost effective introduction in aero engines, in which these low density materials have great potential to improve fuel efficiency and reduce the amount of pollution. The main characteristic of the SPS is that heat is generated internally by Joule effect, in contrast to conventional hot pressing, where heat is provided by conduction and or radiation.
More precisely, the process consists in applying a pulsed current and a uniaxial pressure that are favourable to obtain nanostructered materials due to very high heating rates and short sintering time (about 15 min). The powder material undergoes different mechanisms such as plastic deformation, sintering, and compaction. Difficulties occur when manufacturing materials with complex shapes. In fact, the distribution of current affects directly the distribution of temperature and so the distribution of stress which might cause heterogeneities of the density in the compacted powder.
Therefore, to control the microstructure homogeneity, it is important to understand the heating mechanisms in the sample. A 3D code has been developed in the CIMLib library (implemented at CEMEF) to simulate the coupled electrical thermal problems. The numerical code is based on a monolithic approach which is presented in the first section. The code is then validated by the comparison with the commercial software COMSOL used at CEMES, which was validated first by experimental measurements. The comparison is carried out for two different materials (conductive and non conductive): TiAl andAl2O3. Finally, we take a closer look at the specimen region to study the influence of the physical properties on the thermal homogeneity.
FINITE ELEMENT MODELING
Governing equations: coupled problems
The finite element modeling of the SPS process is basd on a set of governing equations [1]. In this work, the electrical and thermal problems are considered. Once applied, the electric current generates heat, flowing in the conducting materials. As a consequence, the electrical potential and the temperature are strongly dependent, and two coupled problems should be solved. The electrical modeling is based on the charge conservation law:
0 = ⋅ ∇ J
Applying Ohm’s law, the current density J can be written: U σ σe =− e∇
= E J
Proc. Numiform2010, 10th Int. Conf. on Numerical Methods in Industrial Forming Processes, Pohang, South Korea, 13-17 June 2010, F. Barlat (ed.) (2010) 697-704
where E=−∇U is the electric field, σ the electric conductivity. Then the solution of the electric probleme consists in solving the following Poisson type equation for the electrical potential U :
(
∇)
=0 ⋅ ∇ σe U Considering 3 IR ⊂Ω the computational domain that covers the whole apparatus and Γ its boundary, Green theorem leads us to the weak form of the equation:
∫
∫
Γ Ω Γ ⋅ + Ω ∇ ⋅ ∇ ∀ *, *d * d n J U U U σ U e where *U denotes the scalar test function.
On the other hand, the resolution of the thermal problem is based on energy conservation:
e p q dt dT ρc T k∇ + = − ⋅ ∇ ( )
where k is the thermal conductivity, ρ the density, c the specific heat andp q the heat source. Knowing thate
the internal source of energy is produced by the heat generated from Joule effect, the heat source is written:qe=J⋅E. The weak form of the equation is written:
∫
∫
∫
∫
Ω Γ Ω Ω Ω = Γ ⋅ ∇ + Ω ∇ ⋅ ∇ − Ω ∂ ∂ ∀ϕϕϕϕ*, p ϕϕϕϕ*d k T ϕϕϕϕd k T ϕϕϕϕd qeϕϕϕϕd t T ρc nThe distribution of current and temperature is calculated then by solving at each time step the two coupled problems:
(
)
+ Ω ∇ = + ∇ − ⋅ ∇ Ω = ∇ ⋅ ∇ conditions Boundary on ) ( on 0 2 U σ dt dT ρc T k U σ e p eThe physical properties are dependent on the temperature and are implemented as functions of the temperature calculated at each step.
Numerical approach
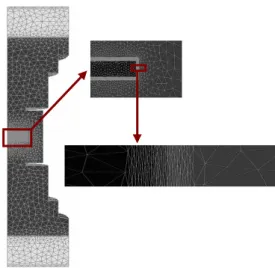
The electric and thermal problems are solved using a monolithic method, through the CIMLib library developed at CEMEF [3]. The assembly is covered by one single mesh (FIGURE 2) and a single equation is solved for each problem on the entire geometry. As a result, the different boundary conditions between the different components of the SPS assembly, like heat conduction, are avoided but on the other hand, specific methods are used in order to characterize the subdomains occupied by the different materials. The concept behind is based on using a function to differentiate the materials and then remeshing the neighbourhood of the interfaces.
Let Ωbe the computational domain, divided into a certain number of subdomainsΩi where each subdomain refers to the domain occupied by the powder compact or by the different materials constituting the parts of the machine. These subdomains Ωi are described with level set functionsα xi( ), each one being the signed distance to the interface Γi boundary of Ωi[2]. Therefore, the functionα xi( ) is expressed as follows:
Γ ∈ Ω ∉ Γ − Ω ∈ Γ = i i i i i i x x x x x x if 0 if ) , d( if ) , d( ) ( α
Once calculated, the level set allows us to define a presence function of the subsetΩi. The smoothed Heaviside functionH(αi) is used in this work, where a thickness ε is fixed in the surrounding of the interface in order tom
prevent the discontinuous transition in the region. In the calculations, the value of εm is chosen accordingly to the mesh size. The function H(αi) is defined as follows:
> ≤ + + − < = m i m i m i m i m i i εεεε εεεε εεεε ππππ ππππ εεεε εεεε α if 1 α if α sin 1 α 1 2 1 α if 0 ) H(α
Furthermore, the objective being to calculate the physical properties on the entire geometry, mixing laws are introduced to express the properties onΩ. These laws are defined as functions of the level set. As an example, for the density and thermal capacity, linear interpolations are applied at the neighborhood of the interface between the two subdomains i and j:
j i i ρ ρ ρ=H(α) +(1−H(αi)) j p i i p i p c c c =H(α ) +(1−H(α))
Whereas for the conductivities, it can be shown that harmonic average means provide better results [4]:
j e i e e σ σ σ , i , i) (1 H(α)) H(α 1 − + = j i k k k )) H(α 1 ( ) H(α 1= i + − i
In order to enhance the accuracy around the interface, the level set method and mixing laws are associated with an anisotropic remeshing. More precisely, the main point is to keep an isotropic mesh in the area far from the interface, and to generate a refined mesh with anisotropic elements in its neighbourhood. For that reason, the metric used for the mesh is dependent on the gradient of the level set function:
2 2 2 α α α where otherwise 2 α if ∇ ∇ ⊗ ∇ = + − > = T rem 2 rem rem ε ε e N e ε A Ι A Ι M
where N is the number of elements generated in the thickness 2e and in the direction of the gradient of the Level set, and εrem is related to the background mesh size. In practice, the mesh is generated with several time steps using the MTC mesher developed by Coupez [5].
SIMULATIONS
The 3D geometry presented in FIGURE 1 is considered in the simulation of the electric thermal coupled problems. The porosity in the powder is neglected in this study, and the powder is considered as a dense medium. The height of the specimen is 6 mm and its radius is 18 mm. Two different material samples are considered: TiAl andAl2O3. The die, pistons and spacers are made of graphite and their dimensions are specified in FIGURE 1.
FIGURE 1. Electrical conductivity of the global simulated assembly. The different components (including
the TiAl disc sample at the centre) can be distinguished through the display of the distribution of their electrical
conductivity (1/ohm.m)
FIGURE 2. Geometry used in the simulations with the mesh generated and a zoom in the region of the sample showing the refined elements around the sample/matrix
interface
To minimize heating rates in the SPS setup, two Inconel spacers are in contact with the graphite edges and are water cooled. As a consequence, the heat losses of the two extreme upper and lower Inconel surfaces can be modeled through a convective type heat flux:
)
( water
conv conv=h T−T
where 2 1
. . 880 − −
= Wm K
hconv is a constant heat transfer coefficient, T the local surface temperature of the Inconel
spacers and Twaterthe water temperature (assumed constant 23°C). Moreover, the process taking place in a vacuum chamber, heat losses by convection and conduction are neglected. All lateral surfaces have heat losses by radiation towards the chamber walls, which are held at room temperature (300 K). This is why a radiative heat flux is considered:
) ( 4 4 wall r B radiation =σ ε T −T φφφφ where σ =5.67×10⁻⁸W.m−2K−4
B is the Stefan Boltzmann’s constant, εrthe emissivity (assumed to be equal to
0.8 in this study), T the local temperature of the vertical boundary surfaces and Twall the temperature of the chamber walls. On the other hand, a constant voltage is applied during the simulations. Furthermore, all contact surfaces between the parts of the SPS assembly are considered ideal: as a consequence no contact resistance is taken into account. As mentioned previously, the numerical solutions are obtained by means of the CIMLIB library developped at CEMEF, using a 3D finite element method.
RESULTS
Electrical potential and temperature distribution
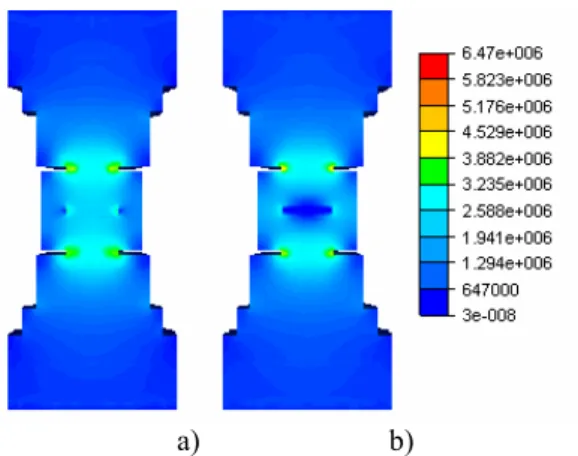
The distribution of the temperature during the SPS process is directly related to the distribution of current which is firstly affected by the geometry and the physical properties of the different components and materials involved in the whole set up. The choice of the two samples, with two different electrical conductivities, shows their effect on the distribution of the current and consequently on the distribution of the temperature. In FIGURE 3,
the norm of the current density is compared after applying a constant voltage of 4.2V. In the case of TiAl, most of the current flows through the sample whereas in the case of alumina it is, as expected, relatively absent inside the sample, because of its low electrical conductivity. This means that alumina is heated by conduction only and not directly by Joule effect. For the conducting specimen, the distribution of the current density is more important at the lateral surface and decreases in the radial direction towards the center. Moreover, the results show that the highest current density is in the region of the pistons in both cases, due to their smaller section.
a) b)
FIGURE 3. Distribution of the norm of the current density (A/m²): a) TiAl sample b) Alumina sample, after 10s
The distribution of the current in the radial direction is represented in FIGURE 4. For the conducting sample, the density is higher at the lateral surface of the sample and it decreases suddenly at the interface level in the die to a minimum value. Then, it increases slightly towards the die surface. However, for alumina, the current is absent in the sample and increases remarkably at the interface level and finally decreases inside the die. On the other hand, the global variations along the vertical axis for both samples are similar except, obviously, inside the samples.
a) b)
FIGURE 4. Variation of the current density along the radial axis from the center of specimen up to the edge of the die, a) TiAl sample, b) Alumina sample. The vertical line represents the interface sample/die.
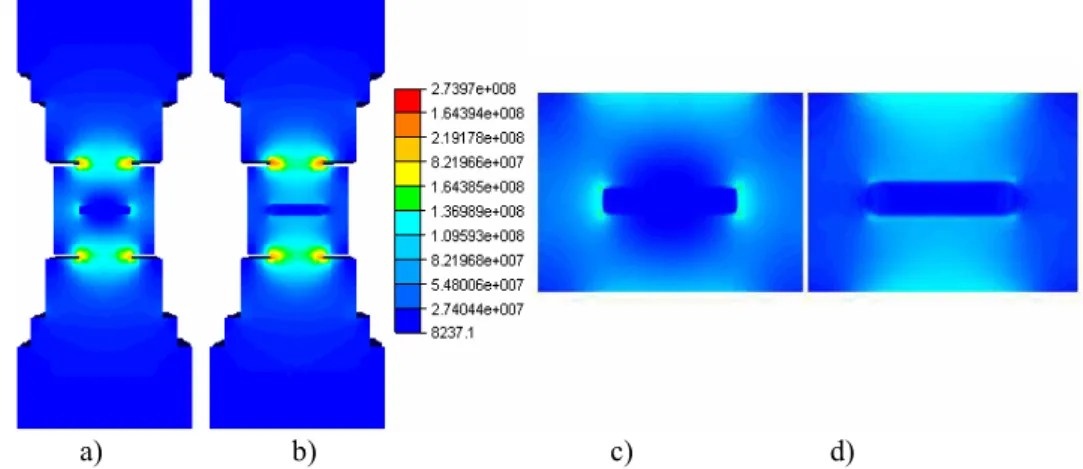
Since the homogeneity of the microstructure in SPS processed parts is directly dependent on the temperature homogeneity, it is interesting to understand the distribution of temperature during the process. First it should be noted that the electrical conductivity of the powder samples affects their direct heating by Joule effect but not significantly. Actually, the source term of the heat equation is balanced by the electrical conductivity on the one hand and by the potential gradient on the other hand (the higherσ , the lowere ∇U,and vice versa). As shown in FIGURE 5, the results are comparable but the main difference occurs in the neighbourhood of the sample, inside the graphite die, as a consequence of the current that avoids the alumina specimen and is concentrated in its surroundings whereas it is relatively absent in the graphite die surrounding the conducting specimen. In fact, the heating by conduction between the die, the pistons and the sample affects the temperature gradient in the radial direction as well as in the axial direction inside the specimen.
a) b) c) d)
FIGURE 5. Distribution of the source term of the heat equation, a) & c) TiAl sample, b) & d) Alumina sample
FIGURE 6a shows the variation of temperature in the case of TiAl. The pistons are heated first and present the highest temperature of the assembly. Along the vertical symmetry axis, FIGURE 6b shows that the temperature in the specimen remains slightly lower than in the pistons even after reaching the stationary phase.
a) b)
FIGURE 6. Distribution of the temperature (°C) (a) in the assembly and its variation along the vertical axis (b) for the TiAl sample for different time steps
Moreover, the results issued from CIMLib were compared with results accomplished at CEMES with the COMSOL software [6]. In FIGURE 7, the variation of the temperature along the radial axis is represented at different instants until 1000s while applying a constant current of 4.2V. Since experimental measurements were
carried out at CEMES and were used to validate the numerical code, the same time steps are chosen to compare temperature fields issued from both numerical codes. Temperatures are calculated while applying two different constant voltages 2.85V and 4.2V.
a) b)
FIGURE 7. Comparison of the temperature radial variation from the centre of the TiAl specimen towards the die edge calculated by the means of CIMLib (a) and COMSOL (b)
a) b)
FIGURE 8. Comparison of the temperature fields calculated with COMSOL (a) and CIMLib (b) after the application of 4.2V and 2.85V
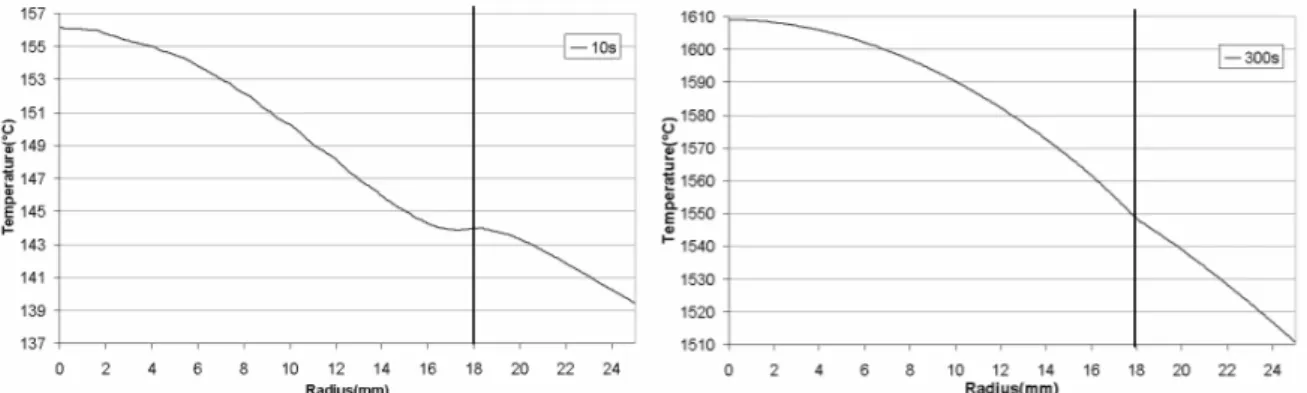
FIGURE 7 and FIGURE 8 show the good agreement between the thermal results issued from COMSOL and CIMLib after solving the coupled electrical thermal problems. These results being very similar, more advanced studies have been carried out in particular in the region of the specimen die interface. Moreover, a closer look at the temperature along the radial axis inside the sample (FIGURE 9) shows that the temperature is the highest in the center and decreases gradually towards the interface with the die.
FIGURE 9. Variation of the temperature in the radial direction of the TiAl specimen after 10s & 300s
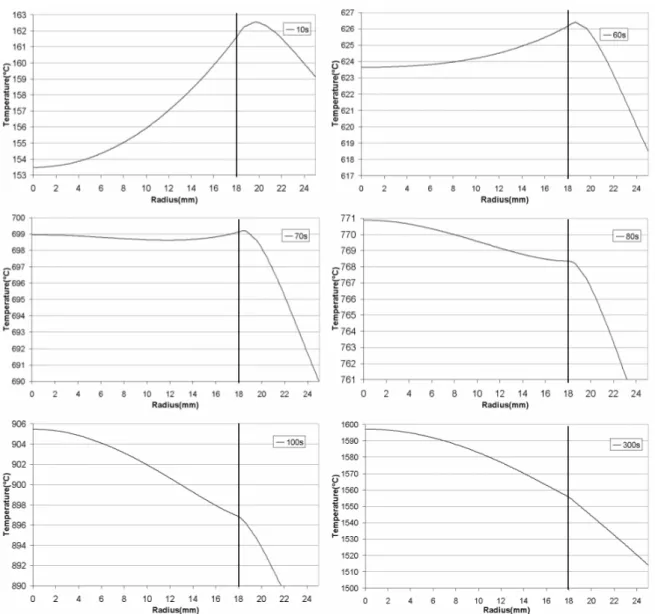
On the other hand, the temperature distribution of the alumina specimen is more complex. Due to the fact that its conductivity is directly proportional to the temperature [6], it increases, and so the distribution of the current varies in time. Consequently, the temperature is not homogeneous during the SPS process and its profile varies with time as presented in FIGURE 10. In the beginning, when the electrical conductivity is still relatively low, the temperature is the highest at the lateral surface of the specimen and it decreases towards the center.
Afterwards, because the electrical conductivity of graphite decreases with temperature, the two conductivities become equal and finally the electrical conductivity of alumina exceeds the one of the graphite, which modifies completely the distribution of the current density and so the temperature distribution inside the specimen.
FIGURE 10. Variation of the temperature in the radial direction of the alumina specimen for different time steps
The temperature heterogeneities in the sample affect directly the mechanical problem. In fact the deformation resulting from the pressure applied during the SPS process will be heterogeneous and then the densification won’t be achieved identically in all the regions of the specimen.
CONCLUSION
A coupled thermo electrical 3D finite element analysis has been presented to simulate the evolution of current and temperature during the SPS process. Two samples were considered (TiAl and alumina) taking into account their thermo dependent physical properties in order to present their effect on the homogeneity of temperature. The results, which were calculated by means of CIMLib using a monolithic approach, are compared and validated thanks to numerical results issued from COMSOL software. Besides, these latter results were validated as well by matching experimental measurements. In this study, heating of the specimen was shown to be mainly caused by conduction with the graphite die or pistons for both materials. The difference remains in the distribution of the temperature field which is a consequence of the difference between electrical conductivities. The preceding results show that the coupled electrical thermal finite element simulation may be of great help in understanding the temperature distribution during the SPS process. Such simulations should allow engineers to better determine the nature of the involved tooling materials, as well as their shapes, to reduce temperature
heterogeneities and, consequently, better control microstructure formation. Forthcoming developments should aim at enriching the finite element model with mechanical coupling in order to simulate powder densification.
ACKNOWLEDGMENTS
This study has been conducted in the framework of the cooperative project “IRIS” supported by the French Agence National de Recherche (ANR).
REFERENCES
[1] Zavaliangos, A., Zhang, J., Krammer, M., and Groza, J. R. Zavaliangos, A., Zhang, J., Krammer, M., and Groza, J. R., Temperature evolution during field activated sintering, Materials Science and Engineering, 2004, A, 379: pp. 218 228. [2] Bruchon, J., Digonnet, H., and Coupez, T., Using a signed distance function for the simulation of metal forming
processes : Formulation of the contact condition and mesh adaptation. from a lagrangian approach to an eulerian approach. Inter national Journal for Numerical Methods in Engineering online.
[3] C. Gruaux, “Génération de métriques pour adaptation anisotrope de maillages, applications à la mise en forme des matériaux ”, Ph.D. Thesis, Ecole Des Mines De Paris, 2004.
[4] E. Hachem, “Stabilized Finite Element Method for Heat Transfer and Turbulent Flows inside Industrial Furnace”, Ph.D. Thesis, Ecole Des Mines De Paris, 2009.
[5] T. Coupez, Génération de maillage et adaptation de maillage par optimisation locale, Revue européenne des éléments finis, 9, 4 :403 423 (2000).
[6] G. Molénat, L.Durand, J. Galy, A.Couret., Temperature control in Spark Plasma sintering: an FEM approach, Journal of Metallurgy, to be published