HAL Id: halshs-00119490
https://halshs.archives-ouvertes.fr/halshs-00119490
Submitted on 11 Dec 2006
HAL is a multi-disciplinary open access archive for the deposit and dissemination of sci-entific research documents, whether they are pub-lished or not. The documents may come from teaching and research institutions in France or abroad, or from public or private research centers.
L’archive ouverte pluridisciplinaire HAL, est destinée au dépôt et à la diffusion de documents scientifiques de niveau recherche, publiés ou non, émanant des établissements d’enseignement et de recherche français ou étrangers, des laboratoires publics ou privés.
New Findings on Firm Investment and Monetary Policy
Transmission in the Euro Area
Jean-Bernard Chatelain, Andrea Generale, Ignacio Hernando, Philip
Vermeulen, Ulf von Kalckreuth
To cite this version:
Jean-Bernard Chatelain, Andrea Generale, Ignacio Hernando, Philip Vermeulen, Ulf von Kalckreuth. New Findings on Firm Investment and Monetary Policy Transmission in the Euro Area. Oxford Review of Economic Policy, Oxford University Press (OUP), 2003, 19 (1), pp.1-11. �halshs-00119490�
New Findings on Firm Investment and
Monetary Policy Transmission in the Euro Area
Jean-Bernard Chatelain,1 Andrea Generale,2 Ignacio Hernando,3 Ulf von Kalckreuth,4 Philip Vermeulen5
Post Print:
Oxford Review of Economic Policy, Vol. 19 (1), 2003, pp. 1-11
Abstract
In this paper we present comparable results on the determinants of firms’ investment and their link to monetary policy. The results have been obtained by the Eurosystem Monetary Transmission Network. This network has produced a series of papers in which the use of micro data permits estimating and quantifying the relevance of two channels of monetary policy transmission: the interest rate and the broad credit channel. The research findings provide evidence of an operative interest rate channel in all countries examined. Moreover, the results indicate that variables which proxy firms’ financial conditions play a role. Firms characterised by weaker balance sheets show higher liquidity sensitivity.
JEL Classification numbers: E22, E50
Keywords: investment, monetary transmission, user cost of capital
This paper represents the authors’ personal opinions and does not necessarily reflect the views of the institutions to which they are affiliated. We would like to thank the members of the Eurosystem’s Monetary Transmission Network, Christopher Allsopp, Michael Artis, Paul Mizen, an anonymous referee, and the participants at the conference ‘EMU, Four Years On’, for helpful discussions and feedback
1 PSE, Cepremap and University Paris 10, e-mail: jean-bernard.chatelain@u-paris10.fr; 2 Banca d’Italia; e-mail: generale.andrea@insedia.interbusiness.it;
3 Banco de España; e-mail: hernando@bde.es;
4 Deutsche Bundesbank; e-mail: ulf.von-kalckreuth@bundesbank.de; 5 European Central Bank: e-mail: philip.vermeulen@ecb.int.
I. INTRODUCTION
Business investment decisions are thought to be influenced by monetary policy through two important channels. First, changes in market interest rates imply changes in the cost of capital, which in turn affect investment decisions. This is known as the interest rate channel. Second, changes in market interest rates might affect firms differently. Given imperfect capital markets, firms with less collateral to offer might see the terms they face in the debt market worsen more than others when market interest rates rise. This is generally referred to as the broad credit channel.
This article provides an overview of new findings on the existence of these two channels based on results from a series of studies on firm investment in the euro area. As in its companion paper (Ehrmann et al., this issue), it reports on the main findings obtained by the Eurosystem Monetary Transmission Network. This network has produced a set of comparable papers investigating the determinants of investment. A special feature of these papers is their use of firm panel datasets to identify the relative importance of the interest rate and broad credit channels. In addition, they use similar methodologies. Especially in the study by Chatelain et al. (2001), the results of harmonised regressions are compared among the four largest countries in the euro area. Although harmonised regressions make comparison between countries more straightforward, they need to be interpreted with caution. By default, individual country idiosyncrasies are not taken into account. Individual country results in which country-specific features are taken into account are available for Germany (von Kalckreuth, 2001), France (Chatelain and Tiomo, 2001), Italy (Gaiotti and Generale, 2001), Belgium (Butzen et al., 2001), Austria (Valderrama, 2001) and Luxembourg (Lünnemann and Mathä, 2001).
The rest of the article is structured as follows. In section II we describe the motivation behind the analysis. In section III we describe the theoretical framework. In section IV we present data and regression results. In section V we provide an assessment of the magnitude of the interest rate channel. In section VI we report on evidence of whether a broad credit channel is operative in the euro area. Finally, conclusions are provided in the last section of the article.
II. MOTIVATION
The interest of central banks in the causes of investment fluctuations is natural. Investment fluctuations probably represent the most important part of cyclical changes in the business cycle in the euro area. Vermeulen (2002) reports that the decline in gross fixed capital formation was the major cause of the decline in total
domestic expenditure during the downturn in the early 1990s in Europe. In addition, investment fluctuations are generally believed to be closely linked to monetary policy. Macroeconomic models at central banks also assign a large role to investment fluctuations after monetary policy shocks. Van Els et al. (2001) report on simulations carried out using central bank aggregate models. They find that after an increase in the policy-controlled interest rate in the euro area, the decrease in investment accounts for between 30 to 50 percent of the drop in GDP during the first year. This share rises to as much as 80 percent of the fall in GDP after three years.
Policy-makers at central banks are naturally interested in the channels through which interest rate changes affect investment. They need to know whether only the interest rate channel is at work or whether the condition of a firm’s balance sheet also matters after monetary policy shocks. If balance sheet conditions are important, financial condition indicators might provide useful additional information beyond traditional interest rate information. Macro-models usually do not include balance sheet information on firms and are therefore ill-suited to testing for the presence of broad credit channel effects.
Microanalysis of firm investment is generally better suited to identifying the different channels through which investment is affected. In studies using aggregate investment data, it has often been hard to identify user cost effects on investment and therefore the existence of an interest rate channel. Micro data on firms have a major advantage in providing user cost variation in both time and cross-section dimensions. In addition, the broad credit channel emphasises the effect of balance sheet strength on investment response. Firm datasets allow separating firms with weak balance sheets from firms with strong ones. This makes it possible to identify broad credit channel effects. Below we describe the theoretical framework used by the Eurosystem researchers in identifying both channels.
III. THE THEORETICAL FRAMEWORK
The models in the investment literature can be divided into two broad categories depending on whether dynamic elements are treated implicitly or explicitly (Chirinko, 1993a, 1993b). Models are included in the latter category if dynamic elements appear explicitly in the optimisation problem and if the estimated coefficients are linked explicitly to the underlying technology and expectation parameters. The implicit category contains those investment models that do not meet these criteria. Explicit models have the notable advantages of being based on a choice-theoretic framework and having coefficients in the econometric equation that can be identified with
technology and expectation parameters. However, their empirical performance has been disappointing, their parameter estimates appear fragile in many applications, and they do not provide a framework for assessing either the interest rate or broad credit channels for investment. Consequently, the Eurosystem researchers have opted for an implicit model. The model platform corresponds to that used recently by, among others, Bond et al., (1999, 2003), Chirinko et al. (1999), Hall et al. (1999, 2001), von Kalckreuth (2000), Harhoff and Ramb (2001), as well as Bloom et al. (2001). The point of departure is the static neo-classical equation for capital demand. Using a generalised CES production function, Eisner and Nadiri (1968) derive the following linear equation from the first-order conditions of profit maximisation:
t t
t
t S UC h
K log log log
log =θ −σ + , (1) with ν σ − + σ = θ 1 and ν
( )
σ − σ να ⋅ = t 1 t A h , (2)where UC is the user cost of capital, t S is real sales, t A is productivity and t σ and ν are the elasticities of substitution and scale, respectively. The variable h depends on t
the time-varying termAt. If the presence of a firm-specific trend in capital demand
cannot be excluded, e.g. because the growth of At is firm-specific, it is helpful to first
difference equation (1):
t t
t
t S UC h
K log log log
log =θ∆ −σ∆ +∆
∆ . (3)
The first term, ∆logKt, is approximately equal to the net investment rate, It Kt−1−δ.
The depreciation rate can be subsumed into the unobservable firm-specific variable in the estimation. The change in log ht can be represented by time dummies in the regression equation, at least as far as aggregate productivity is concerned, and by individual constants in order to catch trends of the form φit in the course of the firm's technological progress. Individual productivity shocks are confined to the error term of the equation.
In the following, it is assumed that the production possibilities are given by the capital stock at the beginning of the current period. Taking account of installation costs and the short-run dynamics in the formation of expectations, one can generalise the static capital-demand equation by using distributed lags. For firm i, this results in:
t i t i t i t i t i B L S C L UC K L
A( )∆log , = ( )θ∆log , + ( )σ∆log , +φ +λ +ε, , (4) ) ( ), ( ), (L B L C L
A being polynomials in the lag operator, not necessarily of the same degree. The latent term is composed of a firm-specific constant φ that reflects i depreciation and a possible trend in the capital-demand equation (1), a time-specific
shock λt equal for all firms, and finally, an idiosyncratic transitory shock ε . In this i,t
quite general specification, the data are allowed to determine the adaptation dynamics. Imposing the additional constraints B(1) A(1)=1 and C(1) A(1)=1, the long-run effects of changes in the level of sales or user costs are the same as in the static model (1). In the regression, the growth rates ∆logKi,t and lags are substituted by current and lagged values of investment outlays per unit of capital, Ii,t Ki,t−1.
In addition, one can also estimate an extension of equation (4). Contemporaneous and lagged real cash-flow per unit of capital, CFi,t Ki,t−1 are added as further regressors to capture financial constraints and possible dynamics of expectation formation.1 This yields: t i t i t i t i t i t i t i B L S C L UC D L CF K K L
A( )∆log , = ( )θ∆log , + ( )σ∆log , + ( ) , ,−1 +φ +λ +ε, (5) Following Auerbach (1983) and Hayashi (2000), one can obtain a weighted-average definition of the user cost of capital where the cost of debt and equity are weighted by their respective share of the total liabilities of the firm. Chatelain et al. (2001) use the accounting proportions of debt and equity which matters for taxation:
] ) 1 ( ) )( ( ) 1 )( ( [ ) 1 ( ) 1 ( 1 s st I I st s it it it t t it it it it t s t t st I st it P P E D E LD E D D AI z itc p p UC − −δ ∆ +δ + + τ − + τ − τ − − = + (6) where s is the sector-specific index, p the price of final goods, st I
st
p the price of
capital goods of sector s; τ the corporate income tax rate, against which interest t payments and depreciation are assumed to be deductible, z the present value of depreciation allowances, and itc the investment tax credit. AI is the apparent interest rate, measured as interest payment over gross debt, LD the long-term debt rate used as a proxy for the opportunity cost of equity, E the book value of equity, D the book value of debt, and δ the industry-specific rate of economic depreciation. s
IV. THE EMPIRICAL ANALYSIS
The analysis of monetary transmission through firm investment within the Eurosystem’s Monetary Transmission Network has been mainly based on the use of firm balance sheet data collected by the NCBs of the euro area. The richness of these
1 Chirinko and von Kalckreuth (2002) develop this equation by introducing delivery lags and adaptive
expectations. However, as in all implicit models, the parameters belonging to the expectation formation mechanism are not separately identified.
databases (in particular, in their cross-sectional dimension)2 makes them especially
suitable for identifying the different transmission channels. Although these databases differ in many respects, in general, their coverage of the population of small and unlisted companies is higher than that which is standard in comparable empirical studies. And, in spite of being generally biased towards larger firms, these databases are reasonably representative of the corporate sector of these countries.
In order to better address the challenge of making cross-country comparisons on the impact of monetary policy on firm investment, Chatelain et al. (2001) make a further harmonising effort. In that paper, which focuses on the four largest economies in the euro area, additional attempts are made to standardise, to the extent feasible, the definition of the variables and to homogenise the composition of the samples. In particular, the analysis is restricted to the manufacturing sector and the period covered by the samples used in the estimations is 1985-1999, with the exception of Germany for which the time period available for estimation is 1988-1997. The total number of observations is over 200,000 and the coverage of the samples ranges from 19 percent for Spain to 42 percent for Germany3.
Chatelain et al. (2001) estimate a common specification, using the same estimation method, for the four largest countries of the euro area, France, Germany, Italy and Spain. Thus, the comparison of results obtained across countries provides a first indication of the existence of asymmetries in the transmission mechanism through firm investment4. Furthermore, companion research undertaken within the Monetary
Transmission Network of the Eurosystem (Valderrama, 2001, Butzen et al., 2001, and Lünnemann and Mathä, 2001) performs a similar analysis for other countries in the euro area. These papers, although adopting a country-specific approach in order to take into account national particularities, share with Chatelain et al. the main elements of the analytical framework and, therefore, offer a set of comparable results for other countries in the euro area5. An important difference from Chatelain et al. (2001) is that
the firms in the samples used in these papers are not exclusively from the manufacturing sector.
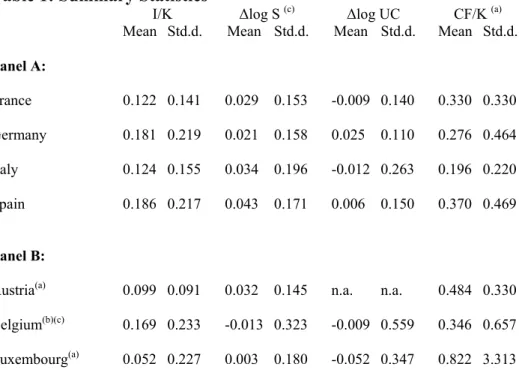
Table 1 provides summary statistics of the studies by Chatelain et al. (2001), Valderrama (2001), Butzen et al. (2001) and Lünneman and Mathä (2001). The table
2 In this respect, the annual accounts database of the National Bank of Belgium used in Butzen et al.
(2001), which covers almost the entire population of Belgian firms, is especially remarkable.
3 See Chatelain et al. (2001) for additional details on the datasets.
4 Note, however, that since cross-country comparisons are not performed on a pooled dataset, a formal
test on the significance of the differences is precluded.
5 See also Chatelain and Tiomo (2001), Gaiotti and Generale (2001) and von Kalckreuth (2001) for
country-specific studies on the link between monetary policy and firm investment in France, Italy and Germany, respectively.
shows the investment/capital ratio, real sales growth, real user cost growth and the cash-flow/capital ratio. The summary statistics for the four largest euro area countries are broadly similar, revealing that manufacturing firms in those countries are comparable. The average investment rate for French and Italian firms is somewhat lower than German and Spanish firms. Spanish firms also have the highest sales growth rate. The better performance of Spanish firms in terms of both investment and sales probably reflects the overall growth performance of Spain in the 1990s. Italian firms have lower cash-flows. Comparisons of national averages have to be interpreted with caution however, because, as is usually the case with panel data, there is a wide dispersion of the variables in all the countries studied. The summary statistics of the Austrian, Belgian and Luxembourg samples are not strictly comparable. For instance, 40% of the firms in the Luxembourg sample are outside the manufacturing sector. This might explain the relatively low average investment-to-capital ratio.
Table 1: Summary Statistics
I/K ∆log S (c) ∆log UC CF/K (a)
Mean Std.d. Mean Std.d. Mean Std.d. Mean Std.d. Panel A: France 0.122 0.141 0.029 0.153 -0.009 0.140 0.330 0.330 Germany 0.181 0.219 0.021 0.158 0.025 0.110 0.276 0.464 Italy 0.124 0.155 0.034 0.196 -0.012 0.263 0.196 0.220 Spain 0.186 0.217 0.043 0.171 0.006 0.150 0.370 0.469 Panel B:
Austria(a) 0.099 0.091 0.032 0.145 n.a. n.a. 0.484 0.330
Belgium(b)(c) 0.169 0.233 -0.013 0.323 -0.009 0.559 0.346 0.657
Luxembourg(a) 0.052 0.227 0.003 0.180 -0.052 0.347 0.822 3.313 Notes: (a) For Austria and Luxembourg, liquid assets instead of cash-flow.
(b) The reported statistics are those corresponding to the sample of large firms. (c) For Belgium, value-added growth instead of sales growth.
Sources: Panel A: Chatelain et al. (2001); Panel B : Austria: Valderrama (2001); Belgium: Butzen et al. (2001); Luxembourg: Lünneman and Mathä (2001).
Equations (4) and (5) have been estimated in a harmonised fashion in Chatelain et al. (2001) for France, Germany, Italy and Spain. The results are summarised in panel A of table 2. A similar analysis is conducted in the country-specific studies of Valderrama (2001), Butzen et al. (2001) and Lünnemann and Mathä (2001) for Austria, Belgium and Luxembourg, respectively. In these papers, comparable results
to those presented in Chatelain et al. can be found and are reported in panel B of table 2. In both panels, we limit ourselves to reporting only the estimated long-run coefficients that represent the long-run elasticity of the capital stock with respect to the regressors6.
Table 2: Long-run coefficients
Equation (4) Equation (5) Without CF/K in the regression With CF/K in the regression Sales(c) User cost Sales(c) User cost Cash-flow(a)
Panel A: Estimation results with an harmonised approach France 0.35** (0.04) -0.11** (0.05) 0.12** (0.05) -0.03 (0.04) 0.20** (0.04) Germany 0.45** (0.07) -0.66** (0.17) 0.39** (0.08) -0.52** (0.15) 0.08* (0.03) Italy 0.29** (0.05) -0.11** (0.04) 0.14** (0.05) -0.20** (0.06) 0.30** (0.03) Spain 0.14* (0.09) -0.26 (0.20) 0.02 (0.09) -0.28 (0.20) 0.15** (0.04) Panel B: Estimation results of firm studies for single countries
Austria(a) 0.27** (0.02) -0.14 (0.39) 0.02 (0.84) -0.04 (0.72) 0.28** (0.00) Belgium(b)(c) n.a. n.a. 0.31**
(n.a.) -0.03** (n.a.) 0.21** (n.a.) Luxembourg(a)(d) 0.08**
(0.04) -0.10** (0.04) 0.08** (0.04) -0.15** (0.05) 0.00 (0.00) Notes: */** denotes significance at the 5%/1% levels. Numbers in brackets are standard errors. Estimation method: two step GMM of equation (1) and (2) in first differences. For details on the estimation technique and the instrumentation see Chatelain et al (2001).
(a) Model (2) for Austria and Luxembourg includes liquid assets instead of cash-flow. (b) The results for Belgium are those corresponding to the sample of manufacturing firms. (c) For Belgium, value-added growth instead of sales growth.
(d) In the case of Luxembourg the estimation method is OLS.
Sources: Panel A: Chatelain et al. (2001); Panel B : Austria: Valderrama (2001); Belgium: Butzen et al. (2001); Luxembourg: Lünneman and Mathä (2001).
User costs have a significant long-run effect on capital stock in Germany, Italy, Belgium and Luxembourg, and for France when cash-flow is dropped from the regression. Moreover, Chatelain et al (2001) note that it is also significant for Spain when non-significant lags are excluded. The point estimates of the long-run elasticity of capital stock with respect to user costs lay in a range of -0.03 to –0.66. In a recent study using similar methodology, Chirinko et al. (1999) find an elasticity of –0.25 for
6 The long-run coefficients are calculated as the sum of the coefficients of the various lags of the indicated
US manufacturing firms. However, they provide other estimates in the neighbourhood of –0.40 using another methodology (Chirinko et al., 2001).
Chatelain and Tiomo (2001) suggest a reason for the loss in significance of long-run user cost elasticity in France when the cash-flow/capital ratio enters the regression. They argue that this is due to an omitted variables bias. When not only cash-flow but also cash-flow multiplied by dummy variables related to the risk of bankruptcy of firms (e.g. using Fisher discriminant analysis with several financial ratios) are included in the specification, long-run user cost elasticity becomes significant again with a value similar to that in the specification without cash-flow. They then find that about 80% of the firms in the French sample exhibit an investment cash-flow sensitivity significant but close to zero (similar to firms in the German sample), with a user cost elasticity significant but at a much lower level (below -0.26) than in Germany. By contrast, risky firms (about 20% of the French sample) exhibit investment cash-flow sensitivity and user cost elasticity rather similar to that in the Italian and Spanish samples. This French result is particularly interesting since it demonstrates that even within a relatively homogenous sample of manufacturing firms, sub-samples of firms can behave quite differently from the average firm in the sample.
It is interesting to see that Germany has the lowest cash-flow sensitivity among the large European countries, whereas its user cost elasticity is highest. Furthermore, von Kalckreuth (2001) does not find significant differences between the investment behaviour of large and small firms in Germany. He argues that it is possible to interpret this result as being related to a special feature of the German financial system, the importance of so-called house banks7. The term “house bank” is used to
denote a credit institution which enters into a long-term business relationship with a certain company based on an intensive exchange of information and implied insurance against liquidity shortfalls and sharp fluctuations in refinancing costs. It is possible that relationship banking has helped firms, especially small firms, to overcome informational asymmetries that otherwise would have distorted their investment decisions.
Overall, the significance of the user cost variable in the regressions suggests that monetary policy has a significant influence on corporate investment in the euro area through the interest rate channel. However, the exact amount of user cost elasticity remains sensitive to the inclusion of cash-flow in the regression (and to the sample of firms).
7See von Kalckreuth (2001) and Deutsche Bundesbank (2002). For the house banking principle, see Elsas and
Sales growth, as a proxy for expected demand, has a substantial impact on the investment rate and, with the exceptions of Austria and Spain, this effect is significant even in models including cash-flow. Consistent with most of the previous empirical literature, cash-flow is significant in each country, with the exception of Luxembourg8. The potential relevance of a broad credit channel is addressed in
section VI.
V. THE DYNAMICS OF INVESTMENT
In this section we present the short-run profile of the investment/capital ratio in the different euro area countries after shocks to user costs and cash-flow. The profile of the investment/capital ratio after shocks to user costs is especially interesting for policy-makers at central banks. In principal, policy-makers can influence user costs by changing the market interest rate. Changes in market interest rates should lead to changes in user costs since they are an element of user costs. Clearly, user costs also contain other elements such as tax parameters, price variables and depreciation. Changes in market interest rates therefore do not lead to one-to-one changes in user costs. Chatelain et al. (2001) provide estimates of the elasticity of user costs to changes in the market interest rate ranging from 0.32 in Germany to 0.70 in Italy.
Table 3. Effect of a one-time 1 percentage point change in the user cost growth on I/K (*)
Germany France(a) Italy Spain
t -0.22 -0.06 -0.08 -0.28
t+1 -0.18 -0.05 -0.07 -0.05
t+2 -0.08 -0.01 -0.03 0.03
t+3 -0.03 0.00 -0.01 0.02
Austria Belgium Luxembourg
t -0.02 -0.01 -0.15
t+1 -0.02 -0.01 -0.04
t+2 0.00 -0.01 -0.01
t+3 0.00 -0.01 0.00
Notes: (*) Figures represent the deviation of I/K after a 1% increase in the user cost growth rate.
(a) For France the coefficients are from the regression without cash-flow . Sources: Chatelain et al. (2001); The figures for Austria, Belgium and Luxembourg have been obtained from the estimates reported in Valderrama (2001), Butzen et al. (2001) and Lünnemann and Mathä (2001), respectively.
Table 3 shows the effect of a one percentage point change in the growth rate of user costs on the investment/capital ratio. Although the magnitude of the effects differs
8 Even in this case, a significant (although small) coefficient for cash-flow is obtained, when using a
quite a lot across countries (as was evident from table 2), the dynamic pattern is quite similar across countries. The largest effect occurs in the first year. Most of the effect disappears after two years.
Table 4 shows the effect of a one percentage point change in the cash flowcapital ratio. In general, the contemporaneous impact is significant and most of the effect is also here disappeared after the second year. On the whole these effects, although relatively small in most countries, are by no means negligible9.
Table 4. Effect on I/K of a one-time 1 percentage point change in CF/K (*)
Germany France Italy Spain
t 0.04 0.06 0.26 0.12
t+1 0.02 0.10 0.02 0.05
t+2 0.01 0.03 0.02 -0.01
t+3 0.01 0.01 0.01 -0.01
Austria Belgium Luxembourg
t 0.20 0.04 0.00
t+1 0.08 0.10 0.00
t+2 0.00 0.01 0.00
t+3 0.00 0.04 0.00
Note: (*) Figures represent the deviation of I/K after a 1 percentage point increase in CF/K.
Sources: Chatelain et al. (2001); The figures for Austria, Belgium and Luxembourg have been obtained from the estimates reported in Valderrama (2001), Butzen et al. (2001) and Lünnemann and Mathä (2001), respectively.
VI. THE BROAD CREDIT CHANNEL.
In this section we report on the results of tests of whether different categories of firms show different investment reactions depending on their liquidity.
Table 5 provides an overview of the effect of liquidity on investment in six euro area countries including results from Valderrama (2001), Butzen et al. (2001), Chatelain and Tiomo (2001), von Kalckreuth (2001), Lünnemann and Mathä (2001) and Gaiotti and Generale (2001). These studies tested the differences in the coefficient estimates of the cash-flow/capital ratio10. By testing whether the long-run effect of the cash-flow/capital ratio is significantly different for different groups of firms, they were able to compare the behaviour of firms that tend to have weaker balance sheets with that of other firms. This test aims at identifying possible broad credit channel effects.
9 See Chatelain et al. (2001) for an estimation of the effect of an increase in interest rate on investment,
induced through a reduction in cash-flow.
Table 5: Country findings for broad credit channel effects
Model specification Results: relevant firm characteristics Sample period No. of obs Highest Liquidity sensitivity Austria 1994-1999 2652 Firms with no close relationship to
a house bank
Belgium 1986-1998 157547 Small services, manufacturing
France 1986-1999 61237 Equipment manufacturing, firms with bad credit rating
Germany 1988-1997 44345 Firms with bad credit rating
Italy 1984-1999 43912 Small firms, firms with high share of intangible assets
Luxembourg 1992-1998 517 Young firms
Sources: Austria: Valderrama (2001); Belgium: Butzen et al. (2001); France: Chatelain and Tiomo (2001); Germany: von Kalckreuth (2001); Italy: Gaiotti and Generale (2001); Luxembourg (2001) Lünnemann and Mathä (2001).
No single criterion was found to be relevant in all countries by which firms are more sensitive to liquidity. For example, size in itself does not seem to be sufficient to capture the presence of differences in external finance premia11. However, all criteria that are relevant in individual countries point towards firms with less potential to provide adequate collateral. We take these differences in liquidity sensitivity to be indicative of potential broad credit channel effects. For instance, in both France and Germany, firms with poor credit ratings show higher cash-flow sensitivity. In Italy and Belgium, small firms are more sensitive to cash-flow. Also, particular industries could be more vulnerable to credit channel effects. Small services firms in Belgium and equipment manufacturers in France are found to be more liquidity sensitive. For Austria, firms without a close relationship to a house bank show higher liquidity sensitivity. In the case of Spain, although according to Chatelain et al. (2001) the investment behaviour of small firms does not display a significantly higher cash-flow sensitivity than that of large firms, the large magnitude of the cash-flow effect, its robustness to changes in the specification and the evidence obtained for the Spanish economy using alternative specifications, datasets, sample periods and split criteria seem to support the relevance of informational asymmetries to explain investment behaviour12.
11Hernando and Tiomo (2002), estimating the investment Euler equation model of Bond and Meghir (1994) for
two samples of firms (French and Spanish) very similar to the ones used in this study, find a significantly higher cash-flow sensitivity for those firms paying zero dividends. Chatelain and Teurlai (2000) estimating the investment Euler equation model where the financial constraint is designed according to Estrada and Vallés (1998) for a French sample, find similar results for low dividend payout firms and for debt increasing firms, using tests of misspecification of cash-flow for various groups of firms. Thus, it can be argued that size might not always be the best indicator of informational asymmetries.
For Germany, it was possible to obtain evidence of the effect of financial constraints that does not rely on the traditional method of comparing cash-flow sensitivities between supposedly constrained and unconstrained firms. Von Kalckreuth (2001) views the rating score (overall rating ratio, ORR) of the Deutsche Bundesbank – being the result of a discriminant analysis – as a direct measure of the perceived default risk as seen from the perspective of the lender. Therefore, it ought to vary with the external finance premium, if there is one. Technically, the costs of finance are modelled as the risk free user costs of capital, augmented by a mark up that is a function of the rating score, ORR. An autoregressive distributed lag equation was estimated with both the change in ORR and the growth rate of a risk-free user cost variable that was constructed according to the principles laid down by King and Fullerton (1984). Since user costs enter the model with a negative effect, we would anticipate that ∆ORR has a positive coefficient, indicating that investment increases with the credit rating. This effect could actually be verified. Using a GMM procedure, the rating variable was found to be significant on the 1% level. The size of the coefficient indicates that rating is of importance for capital accumulation, although not overwhelmingly so: a permanent increase in rating by one standard deviation would increase capital demand by 2.4% in the long run.
Overall, considering the above results, one can be reasonably confident that internal funds are a crucial determinant of firms’ investment, with an effect that is stronger for firms that are more likely to face financial constraints, so that the credit channel in the euro area is also operative.
VII. CONCLUSION
This article has presented a comparable set of results on the monetary transmission channel on investment in the euro area countries. These results have been obtained by the Eurosystem Monetary Transmission Network in a series of papers using firm panel datasets. Evidence for both interest rate channel effects and broad credit channel effects is found. There is clear evidence that user costs matter for investment. Most of the effect of user cost changes on investment can be found during the first two years. Investment by various firms responds differently depending on cash-flow and liquidity variables. Investment by firms with weaker balance sheets especially displays higher liquidity sensitivity indicating the presence of broad credit channel effects.
REFERENCES
Alonso-Borrego, C. (1994), ‘Estimating dynamic investment models with financial constraints’, CEMFI Working Paper No 9418.
Auerbach, A.J. (1983), ‘Taxation, corporate financial policy and the cost of capital’,
Journal of Economic Literature, 21, 905-40.
Bloom, N., Bond, S. and van Reenen, J. (2001), ‘The dynamics of investment under uncertainty’, IFS Working Paper WP01/05, Institute for Fiscal Studies.
Bond, S., Elston, J.A., Mairesse, J., and Mulkay, B. (2003), 'Financial Factors and Investment in Belgium, France, Germany, and the United Kingdom: A Comparison Using Company Panel Data', The Review of Economics and Statistics, 85, 153-165 Bond, S., Harhoff, D. and van Reenen, J. (1999), ‘Investment, R&D and Financial Constraints in Britain and Germany’, IFS Working Paper No. W99/5.
Bond S. and Meghir C. (1994), ‘Dynamic investment models and the firm's financial policy", Review of Economic Studies, 61(2), 197-222.
Butzen, P., Fuss, C. and Vermeulen, P. (2001), ‘The Interest Rate and Credit Channel in Belgium: an Investigation with Micro-Level Firm Data’, ECB Working Paper No.107.
Chatelain, J.B., Generale, A., Hernando, I., von Kalckreuth, U. and Vermeulen, P. (2001), ‘Firm investment and monetary transmission in the euro area’, ECB Working Paper No. 112.
Chatelain, J.B. and Teurlai, C. (2000), ‘Comparing several specifications of financial constraints and adjustment costs in investment Euler equations’, Banque de France, mimeo.
Chatelain, J.B. and Tiomo, A. (2001), ‘Investment, the Cost of Capital and Monetary Policy in the Nineties in France: A Panel Data Investigation’, ECB Working Paper No. 106.
Chirinko, R. S. (1993a), ‘Business Fixed Investment: A Critical Survey of Modeling Strategies, Empirical Results, and Policy Implications’, Journal of Economic
Literature, 31, 1875-1911.
Chirinko, R. S. (1993b), Econometric Models and Empirical Findings for Business
Investment, New York: Basil Blackwell. (A Monograph in the Salomon Brothers
Center Series Financial Markets, Institutions & Instruments).
Chirinko, R. S., Fazzari, S. and Meyer A. (1999), ‘How Responsive is Business Capital Formation to its User Cost? An Exploration with Micro Data’, Journal of
Chirinko, R. S., Fazzari, S. and Meyer A. (2001), ‘That elusive elasticity of capital: A long-panel approach to estimating the price sensitivity of business capital, mimeo Chirinko, R. S. and von Kalckreuth, U. (2002), ‘Further Evidence on the Relationship between Firm Investment and Financial Status’, Deutsche Bundesbank Discussion Paper, 28/02 (November 2002).
Deutsche Bundesbank (2002), ‘Monetary Policy and Investment Behaviour, an Empirical Study’, Monthly Report, July.
Eisner, R. and Nadiri, M. (1968), ‘Investment Behavior and the Neo-Classical Theory’, The Review of Economics and Statistics, 50, 369-382.
Elsas, R. and Krahnen, J. P. (1998), ‘Is Relationship Lending Special? Evidence from Credit File Data in Germany’, Journal of Banking & Finance, 22, 1283-1316.
Estrada A. and Vallés J. (1998), ‘Investment and financial structure in Spanish manufacturing firms’, Investigaciones Económicas, 22, 337-359.
Gaiotti, E., and Generale, A. (2001), ‘Does Monetary Policy Have Asymmetric Effects? A Look at the Investment Decisions of Italian Firms’, ECB Working Paper, No.110.
Hall, B.H., Mairesse, J. and Mulkay, B. (1999), ‘Firm-Level Investment in France and the United States: an Exploration of What we Have Learned in Twenty Years’,
Annales d’Economie et de Statistique, 55-56.
Hall, B.H., Mairesse, J. and Mulkay, B. (2001), ‘"Firm Level Investment and R&D in France and the United States: A Comparison", in Deutsche Bundesbank (ed.),
Investing Today for the World of Tomorrow Berlin, Heidelberg, New York: Springer.
Harhoff, D. and Ramb, F. (2001), ‘Investment and Taxation in Germany: Evidence from Firm-Level Panel Data’, in Deutsche Bundesbank (ed.), Investing Today for the
World of Tomorrow Berlin, Heidelberg, New York: Springer.
Hayashi, F. (2000), ‘The Cost of Capital, Q, and the Theory of Investment’, in L. J. Lau (ed), Econometrics and the Cost of Capital, Boston, MIT Press.
Hernando, I. and Tiomo, A. (2002), ‘Financial constraints and investment in France and Spain: a comparison using firm level data’, in French and Spanish industrial
corporations over the period 1991-1999: a comparative study, Banque de France and
Banco de España.
King, M. and Fullerton, D. (ed.) (1984): The Taxation of Income from Capital. A
Comparative Study of the United States, the United Kingdom, Sweden and West Germany. Chicago and London, The University of Chicago Press.
Lünnemann, P. and Mathä, T. (2001), ‘Monetary Transmission: Empirical Evidence from Luxembourg Firm Level Data’, ECB Working Paper, No.111.
Valderrama, M. (2001), ‘Credit Channel and Investment Behavior in Austria: A Micro-econometric approach’, ECB Working Paper No.108.
Van Els P., Locarno A., Morgan J. and Villetelle J.-P. (2001), ‘Monetary Policy transmission in the Euro area: What do aggregate and national structural models tell us?, ECB Working Paper No. 94.
Vermeulen, P. (2002), ‘Business fixed investment: evidence of a financial accelerator in Europe’, Oxford Bulletin of Economics and Statistics, 64(3), 217-235.
von Kalckreuth, U. (2000), ‘Exploring the Role of Uncertainty for Corporate Investment Decisions in Germany’, Deutsche Bundesbank Discussion Paper 5/00. von Kalckreuth, U. (2001), ‘Monetary Transmission in Germany: New Perspectives on Financial Constraints and Investment Spending’, Economic Research Centre of the