HAL Id: inserm-00132158
https://www.hal.inserm.fr/inserm-00132158
Submitted on 20 Feb 2007
HAL is a multi-disciplinary open access
archive for the deposit and dissemination of
sci-entific research documents, whether they are
pub-lished or not. The documents may come from
teaching and research institutions in France or
abroad, or from public or private research centers.
L’archive ouverte pluridisciplinaire HAL, est
destinée au dépôt et à la diffusion de documents
scientifiques de niveau recherche, publiés ou non,
émanant des établissements d’enseignement et de
recherche français ou étrangers, des laboratoires
publics ou privés.
Modulation of dorsolateral prefrontal delay activity
during self-organized behavior.
Emmanuel Procyk, Patricia Goldman-Rakic
To cite this version:
Emmanuel Procyk, Patricia Goldman-Rakic. Modulation of dorsolateral prefrontal delay activity
during self-organized behavior.. Journal of Neuroscience, Society for Neuroscience, 2006, 26,
pp.11313-23. �10.1523/JNEUROSCI.2157-06.2006�. �inserm-00132158�
Modulation of dorsolateral prefrontal delay activity during
self-organized behavior
Emmanuel Procyk
1,2,3and Patricia S. Goldman-Rakic
3*1
INSERM, U371, Stem Cell and Brain Research, Department of Integrative Neuroscience, 18 avenue Doyen Lépine, 69500 Bron, France.
2
Université Claude Bernard Lyon I, France
3 Department of Neurobiology, Yale School of Medicine, 333 Cedar St, New Haven, CT, 06510 USA
* Deceased July 31, 2003
- Corresponding author: Emmanuel Procyk,
INSERM, U371, Center for Stem Cell and Brain Research, Department of Integrative Neuroscience, 18 avenue Doyen Lépine, 69500 Bron, France. Email: [email protected]
-Acknowledgement. This paper is dedicated to the memory of PS Goldman-Rakic.
EP particularly thanks H Kennedy for his help and comments on the present manuscript. Thanks to R. Quilodran, L. Sartorius and B. Haider for their help during experiments. Earlier editions of the manuscript greatly benefited from the help of C. Constantinidis, B. Haider, JP Joseph and R.E. Passingham. The present manuscript, including discussion, has been modified from the earlier versions written by both PGR and EP. EP is funded by CNRS, Inserm, Fyssen foundation, and NRJ foundation.
The regulation of cognitive activity relies on the flexibility of prefrontal cortex functions. To study this mechanism we compared monkey dorsolateral prefrontal activity in two different spatial cognitive tasks: a delayed response task and a self-organized problem-solving task. The latter included two periods, a search by trial and error for a correct response, and a repetition of the response once discovered. We show that (1) delay activity involved in the delayed task also participates in self-generated responses during the problem-solving task, and keeps the same location preference; (2) the amplitude of firing and the strength of spatial selectivity vary with task requirement, even within search periods while approaching the correct response. This variation is dissociated from pure reward probability, but may have a link with uncertainty since the selectivity dropped when reward predictability was maximal. Overall, we show that spatially tuned delay activity of prefrontal neurons reflects the varying level of engagement in control between different spatial cognitive tasks, and during self-organized behavior.
Neurons in the dorsolateral prefrontal cortex (DLPFC) of nonhuman primates are distinguished by two basic properties: their capacity for sustained activation during delay periods and, in spatial tasks, their directional specificity or ‘memory field’ (Funahashi et al., 1989). These dual properties are ideally suited for carrying out the short-term visuo-spatial memory, goal maintenance and/or planning functions, which have been identified as working memory (Baddeley, 1986; Goldman-Rakic, 1995), cognitive control, or “as active memory in the service of control” (Miller and Cohen, 2001). These functions operate across a wide variety of behaviors and have been implicated in diverse cognitive tasks (Goldman-Rakic, 1987; Petrides, 1995; Wise et al., 1996; Fuster, 1997).
However, prefrontal function is often narrowly associated with variants of the delayed-response tasks widely used with monkeys (Barone and Joseph, 1989; Funahashi et al., 1989; Funahashi et al., 1993; Sakagami and Niki, 1994; Rao et al., 1997; Leon and Shadlen, 1999; Wallis et al., 2001; Takeda and Funahashi, 2002). Although these tasks involve more or less complex functions, they all depend upon arbitrary associations between stimuli and responses. Few experiments have tested prefrontal functions in self-organized cognitive tasks (Passingham, 1985; Coe et al., 2002), despite the fact that human studies have reported DLPFC activations during free-selection tasks (Frith et al., 1991; Jueptner et al., 1997b). Thus, the
HAL author manuscript inserm-00132158, version 1
HAL author manuscript
question remains as to how the "on line" processes identified in the sensory cued tasks relates to behaviors in which goal-directed responses are self-generated.
The question of the ubiquity of PFC function is related to the issue of flexibility. A number of brain imaging studies have shown varying degrees of DLPFC activation depending upon task requirements (Frith et al., 1991; Carter et al., 1998; Petersen et al., 1998; Leung et al., 2002). DLPFC activity changes are often associated with modulation of anterior cingulate cortex (ACC) activity and can be explained by several computational models that define Lateral PFC, ACC, and parietal cortex as the core components involved in executive control (Dehaene et al., 1998; Cohen et al., 2004). The neurophysiological correlates of these phenomena have not been fully explored, in particular because traditional delayed-response tasks have used fixed task requirements.
We addressed these issues by comparing the properties of DLPFC neurons in two tasks: a spatial
delayed-response (DR) task, in which the mnemonic
process is driven by sensory stimuli, and a spatial
problem-solving (PS) task designed to elicit self-generated
behaviors (Procyk and Joseph, 1996). The PS task consists of a trial and error search period during which the monkey determined its own response to find the reward, and a repetition period in which the correct response is repeated three times.
We predicted that prefrontal neurons that express directional preferences and sustained activation in the delay period of DR tasks should also elicit sustained activity with similar spatial properties during the PS task. In the light of our previous data from the ACC (Procyk et al., 2000), we further predicted that the activity of DLPFC neurons would be modulated during the PS task which alternates routine (repetition) with non-routine periods.
Materials and Methods
Behavioral task. Data from three monkeys (macaca
mulatta) are reported here. Two monkeys were trained in
two tasks (Fig. 1):
Delayed Response Task (DR): The monkey sat in a
primate chair in front of a vertical touch-screen (Elo-Touch, 19 inches - 48cm) positioned at arm reach distance. Eye movements were monitored and digitized at 100Hz using a Iscan infra-red system (Iscan Inc, USA).
The animal touched a central target (lever) in order to trigger the appearance of a Fixation Point (FP). A FP fixation of 700ms triggered the appearance of a 500 ms light cue at one of the four possible locations (targets were positioned at the corners of a virtual square 10cm from the FP. see Fig. 1). After an ensuing delay period of 2 to 2.5 seconds (during which the monkey was required to maintain fixation on the FP), all four possible targets were illuminated, and 100ms later, the FP was extinguished. The monkey then had to make a saccade toward the remembered target. After the monkey fixated
on the remembered target for 390 ms, all the targets turned white (GO signal), indicating that the monkey was required to touch the target. A juice reward was delivered 600ms after a correct touch. The trial aborted in case of an incorrect or a premature touch, or a break in eye fixation.
For the first sessions of the experiment, cues were delivered by blocks of 3 consecutive trials. Thus in the second and third trials of each block the animals could predict the location of the next cue. This design was then abandoned. It concerns 5 cells included in the pool of data.
Problem Solving Task (PS): Task events were
similar to the DR task, except that the correct target location was not specified by a cue. Monkeys had to find it via trial and error. A problem was composed of two periods: A “search period” that included all incorrect trials up to the first correct touch, and a “repetition period” wherein the animal was required to repeat the correct touch three times.
In the case of an incorrect touch, all targets disappeared, and in the next trial the animal was required to continue his search for the correct target. A juice reward was delivered 600ms after a correct touch. After the third repetition, a red flashing signal (circle of 8cm in diameter centered on the FP position) indicated the start of a new problem, i.e. a search for a new correct target. Two consecutive problems never had the same solution (Fig. 1c).
A third monkey was trained in the PS task with a variation concerning reward size. For each problem the size of the reward was randomly selected between two sizes (Small: 0.25ml and Large: 0.5ml). At the beginning of each trial the color of the lever indicated whether the reward would be Small (red lever) or Large (green lever).
Electrophysiological recordings. Monkeys were implanted with a head-restraining device, and an MRI-guided craniotomy was done to expose a circular aperture over the prefrontal cortex (outer circle in Fig. 1b). A recording chamber was implanted with its center placed at stereotaxic anterior level +30. Neuronal activity was recorded using varnish-coated tungsten electrodes (1–4 MOhm at 1 kHz). One or two electrodes were placed in stainless steel guide tubes and independently advanced into the cortex through a set of micromotors (Alpha-Omega Engineering, Israel). Neuronal activity was sampled with 30µs resolution and recorded waveforms were sorted into separate units using a template-matching algorithm (CED, Cambridge, UK). All animal training, surgeries, and experimental procedures were done in accordance with NIH guidelines, and approved by the Yale Animal Care and Use Committee. The third animal was recorded using an AlphaLab system (AlphaOmega, Israel).
Data analyses and statistics.
Behavioral data. Performance of the monkeys were measured using previously published methods (Procyk and Joseph, 1996; Procyk et al., 2000). Performance in search and repetition periods were measured using the average number of trials performed until discovery of the correct target (including first correct trial) and the number of trials performed to repeat 3 times the correct response, respectively. Different types of trials are defined in a problem (see Fig. 1): during search the successive trials were labeled by their order of occurrence (indices: 1, 2, 3… until the first correct trial). The four correct trials were labeled Cor1, Cor2, Cor3 and Cor4. Indices of trials in search do not reflect the correctness of trials. For each index a certain proportion of Cor1 trials is included.
Reaction times and movement times, as well as saccade reaction times were measured on each trial. Saccade reaction times were evaluated by detecting the earliest peak velocity of horizontal and vertical eye traces after the FP offset. Starting and ending event codes defined each trial. Timings of break fixation errors were computed using the Start code as reference time 0 (see (Amiez et al., 2005)).
The probability to be correct (probability to get the reward) is calculated according to the number of choices at each particular trial indices. When the monkey enters a problem there is 1 out of 4 chances to get a reward on the first trial (p = 0.25), then the probability increases after each error (indices 2: p =0.33, indices 3: p=0.5). During repetition, p=1. However, if the monkey take into account the rule according to which two consecutive problems never have the same solution, probabilities are as follow: indices 1: p=0.33, indices 2 p=0.5 ; indices 3 p=1. When this is the case the performance in search should be around 2 trials on average, which was the case for 2 of our monkeys.
Neural data. Home made program codes (Spike2, CED, Cambridge, UK ; MatLab, The MathWorks Inc., USA) were used to extract average activity in different pre-defined epochs in each trial: 3 epochs corresponding to the end of trial and delay (see below), the 400ms epochs before and after the saccade, the 200ms epochs before and after the touch. Visual examination of PSTH and ANOVA over these epochs, were used to select task-related cells.
In the PS task the key neuronal events were expected to occur between a touch in one trial and the saccade toward the next trial; we therefore focused our study on this interval of time and excluded activity recorded at the time of target fixation and arm movement. Peri-stimulus histograms thus represent the juxtaposition of the end of one trial and the beginning of the next trial (see Fig. 3, 5-8).
The average firing rates studied here were calculated in three epochs: ITI (Inter Trial Interval) = the last 800ms of the trial; Early delay = the first 1s of the delay, and Late
Delay = last 1s of the delay period (Fig. 1d). In DR task, only delay activity was analyzed. Neural activity was considered to be tonic during the delay if it exceeded 2 standard deviations of the mean activity measured in the 600ms preceding the feedback and in 1000ms preceding the next touch (in DR, Search or Repetition) and remained above 2 standard deviations for at least 20 consecutive 50 ms bins.
The activity of neuron was classified as spatially selective when this activity was significantly modulated by the location of the target chosen by the animal (1-way ANOVA, p<0.05).
A neuron's target preference was determined by ranking the average activity measured in the delay of the DR task when this activity was significantly modulated by the location of the target (a, b, c, and d ; a = preferred target and d = least preferred target). When we did not observe any significant effect of target location in the DR task, or when the activity was recorded only in the PS task, we used the average delay activity recorded during the repetition period of the PS task. The ranking was then used for population data. For each cell, the activity was normalized to the maximum and minimum of activity measured in the ‘repetition period’ of the PST.
To investigate the consistency of cell’s target preference between search, repetition, and DR task, we defined a consistent cell as one that either has 1) the same preferred target location across all significant periods, or 2) a consistent side preference (top, bottom, left, right) across all significant periods in case of broad tuning. To compare between periods, we also calculated a preference index: (a – d) / (a + d) that express the difference in activity between the most (‘a’) and least (‘d’) preferred targets.
To study changes in spatial selectivity (tuning) throughout trials during the PS task, we used for each cell the average activity ranked according to preference (a, b, c, d) and calculated the norm of a preference vector:
H= (a + c) - (b + d) and V= (a + b) - (c + d) norm = ( H 2 + V 2 )1/2
The value of the preference vector norm was taken as reflecting the strength of spatial coding of the cell. A norm equal to zero would reflect equal activity for the four target locations (see Supplementary fig. 2S for an example). This objective measure allows the extraction of one single value, for each trial and each cell, and can be averaged across cells. We used an arbitrary spatial arrangement to calculate the vector: targets ‘a’ to ‘d’ were positioned on a square where ‘a’ is at the upper left corner and ‘d’ at the opposite position (see Supplementary fig. 2S) ; Thus H denotes the horizontal axis (from ‘a’ & ‘c’ to ‘b’ & ‘d’) and V the vertical axis.
Most statistical analyses were performed with Statistica® software (Statsoft, Tulsa, Oklahoma). Statistics on vector norms (base2) were made using Linear Mixed-Effects Models (lme), a generic function that fits a linear mixed-effects model. To measure the global effect of type of trials on the norm, cells were defined as mixed effect. This was done using R (A language and environment for statistical computing. R Foundation for Statistical Computing, Vienna, Austria. ISBN 3-900051-07-0, URL http://www.R-project.org).
Results
Behavioral tasks
Two animals were trained in the two cognitive tasks, with eye and arm response requirements (Fig. 1). During recording sessions, the animals performed the DR task on average at 95% correct. Monkeys rarely repeated an “incorrect” choice on the PS task before finding the correct target and rarely failed to repeat the correct response after discovering it. Analysis of 239, 235, and 538 problems randomly chosen among recordings sessions revealed that the average number of trials to solution was 2.13±1.06, 2.62±1.19 and 2.29±1.16 in the three monkeys respectively (see Procyk and Joseph 1996 and methods for details on behavioral performance in PS tasks). The animals repeated the correct response almost perfectly (average 3.66±1.46, 3.46±1.29 and 3.07±0.42 times respectively). Although the animals’ strategy for determining the correct target was highly efficient, the pattern of successive choices was not systematic. Analyses of series of choices during search periods revealed that monkeys could use clockwise (e.g. choosing target UpLeft then UpRight), counterclockwise, or crossing (going from one target to the opposite target in the display, e.g. from UpLeft to LowRight) strategies, with a higher incidence for clockwise and counterclockwise strategies (Percent clockwise, counterclockwise, crossing and repeats were 42%, 33%, 34%, 1% and 37%, 40%, 21%, 2% for the two first monkeys and 36%, 39%, 24%, 1% for the third monkey (measured for 1420, 920 and 1233 transitions between two targets for the three monkeys respectively). The animals could perform up to 120 problems per recording session.
As already observed in previous studies behavioral parameters reflected important changes between search and repetition periods (Procyk and Joseph, 1996; Procyk et al., 2000). Both reaction time for arm movements and saccades varied between the two periods (Fig. 2a-b, Supplementary fig. 1S). The transition appeared after the first reward of a problem.
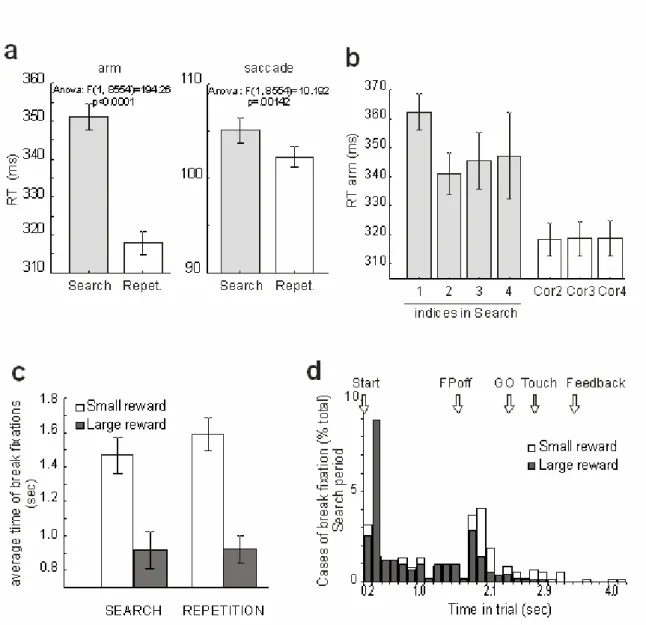
A third animal was trained in a PS task in which the size of the reward varied randomly from Large to Small between problems. The color of the starting lever indicated whether the reward would be small or large (see methods). Reaction times did not differ significantly between the two
conditions. However, a clear effect of reward size was found for break of fixations (execution errors). Execution error rate is a powerful measure of reward expectancy (Shidara and Richmond, 2002; Amiez et al., 2005; Amemori and Sawaguchi, 2006). On average the animal made more break of fixation errors late in trials when the expected reward was small (Fig. 2c). This counter intuitive result is clarified when timings are taken into account: when the large reward was expected, the animal was more likely to break fixations early in the trial than at the crucial time of the saccade toward the selected target. This reveals a tendency of the animal to concentrate more for the full execution of the trial and to ensure reward delivery when the reward is large (Fig. 2d). A reward size effect was also statistically significant for the latency between lever onset and lever touch (larger for Small reward; ANOVA Reward size for search trials: F(1, 1761)=6.6032, p=.01026). Thus, in these conditions the animal discriminated between large and small rewards.
Recordings in DR and PS tasks
The findings presented here are based on 205 neurons, recorded in the caudal DLPFC of two monkeys (see Fig. 1 and Experimental procedure). Of these cells, 82 expressed significant delay activity i.e. tonic firing during delay periods of PS task and/or DR task depending on whether cells were recorded in both tasks. As already reported in the literature tonic activity showed various patterns: stable, decreasing or increasing activity from beginning to the end of the delay (Chafee and Goldman-Rakic, 1998; Rainer and Miller, 2002; Brody et al., 2003). We do not distinguish these types of activity in the present report.
In the PS task, our main focus was on the interval after a response, when the animal received feedback as to the validity of its response, and had to decide which target to choose next. This interval, included between two choices, was divided into the last 800ms of a trial (before a new trial began – intertrial interval, ITI), the first 1000ms of the next trial (Early Delay) and the last 1000ms of the delay period before a new choice was made (Late Delay) (Fig. 1e). In the DR task, only Early and Late Delay, situated between the cue offset and the saccade time, were used. We analyzed the spatial selectivity during the repetition period. 64.3% of the 82 cells were spatially tuned, i.e., responded with significantly higher firing rates to preferred locations during ITI or Delay intervals (1-way ANOVA, p<0.05).
A major issue addressed in this study is whether spatially selective delay-period responses revealed in a DR task were engaged during self-generated responses and were predictive of the animal’s voluntary choices. 58 task-related cells were examined in both the DR and PS tasks, out of which 36 delay neurons recorded for a sufficient number of trials were
used to compare activity in the two tasks. Figure 3a-b shows two examples of neurons that exhibited spatially selective activity both during the delay period in the DR task and during Late Delay in the PS task. Importantly, although neurons were recorded under different task demands and at different times within a session, they displayed identical spatial selectivity.
We compared neural activity recorded in the three different periods: in the DR task, and in the search and repetition periods of the PS task. The analysis (2-ways ANOVA: Touch x Period) showed that 72% (26 out of 36) of cell activities were influenced by the period. Figure 4a shows the activity for six cells for the four different target locations and the three periods. The figure illustrates that although changes in activity can occur between periods, the cells retain their spatial selectivity. A case-by-case examination (see methods) revealed that the majority of cells maintained their target preferences. 80% of cells (28 out of 36) retained their preferred target ‘a’ between Repetition and Search, and between Repetition and DR task (Fig. 4b). 20 cells (77%) had the same preferred target in Search, Repetition and DR task. In a few cases, cells lost the statistically significant differences between locations in at least one period (for instance during repetition).
The overall behavior of DLPFC delay cells was evaluated by normalizing population activity. The target preference of each cell was defined by ranking from ‘a’ to ‘d’ the average activity measured in the delay period for the four target locations chosen by the monkey (see methods), with ‘a’ representing the highest activity (see example in Fig. 2, and the population average in Fig. 5). The reliability of target preference across tasks is clearly illustrated in Figure 5a. It confirms that, on average, target preference rankings did not change across tasks: the preferred and least preferred targets remained in the first and last ranks at the population level. Population average also reveals that delay activity in this part of DLPFC halted at the time of target selection by the gaze. Very little activity was found before arm movements. We evaluated the spatial selectivity by measuring a preference index based on the average activity for the best (‘a’) and least preferred (‘d’) targets (see methods). Individual measures show little changes between Repetition and DR and an increase in variability for Search compared to the other periods (Fig. 5b).
Neural Coding during PS task
These data raise another issue concerning the information coded by delay activity during the PS task. As reported in the literature, delay activity can reflect sensory information and/or motor plans and contain information regarding previous choices (Quintana et al., 1988; Funahashi et al., 1993; Romo et al., 1999; Constantinidis et al., 2001; Takeda and Funahashi, 2002; Barraclough et al., 2004). During the PS task, activities could represent either the location of the previous target selected (memory
of previous choice), or the location of the forthcoming choice. To distinguish between these possibilities we analyzed the activity of search trials in which the target chosen in trial ‘n’ (incorrect choice) is different from the target chosen in the following trial ‘n+1’ (Fig. 6a). The upper diagram shows averages calculated by sorting trials according to the position of the target (a, b, c, or d) selected in the previous trial [n-1] (downward arrow). In the lower diagram, trials were sorted according to the upcoming choice, in [n]. If the delay activity contained information about the previous chosen target, then we should find spatial selectivity during delay activity when sorting trials according to previous target locations. However, the discrimination between targets was present only when trials were sorted according to the forthcoming choice, reflecting the predominance of a prospective coding. ANOVA on early and late delay activity revealed that the upcoming choice had an effect on the majority of cells (46 cells; 56% out of 82 cells). Note that these statistical results are not directly comparable to the first obtained about spatial selectivity (see before) since for the present analysis we only consider activity during Search periods. Figure 6b shows p values (ordinate) obtained with ANOVAs. All points below the horizontal line represent statistically significant effects (p<0.05). The inset compares p-values for both tests (upcoming choice vs. previous choice) and shows that for a large majority of tests the significance was higher for the upcoming choice. In only 7 cells the previous choice had greater effect than the upcoming choice. The analysis on ITI activity showed even less effect. Although we did not analyze in depth the different effects on the various types of delay activity (decreasing, increasing, stable) there were small differences for tests performed on Early delay and Late delay. Mainly, a highest incidence of search vs. repetition effect was found for Early delay (see below), and slightly more cases with significant prospective coding were found for Late delay (ANOVA p<0.05; Next Choice: Early Delay 32.9%, Late Delay 43.4% of cells; Previous Choice: Early Delay 9.8%, Late Delay 11% of cells).
Our data reveal the contribution of delay activity to a prospective function during self-organized behavior, and therefore support the hypothesis of a key role of DLPF in the maintenance of information for prospective use (Passingham and Sakai, 2004).
Search vs. Repetition
We assessed whether the activity of delay cells for the different choices made by the animal changed during the search and repetition periods of the PS task (2-way ANOVA, target location x period for three epochs - see methods). Both period alone and/or the combination of target location and period significantly affected neural activity in 58% of cells (n=48). Activities
were often modulated between the two periods but rarely completely disappeared. Figure 3c-d illustrates two cases, one for which the sustained activity observed from the end of trial until the saccade in search diminished in repetition (Fig. 3c), and another for which activity was modulated between search and repetition in particular at the end of trials, i.e. during the 3 seconds following a touch (Fig. 3d). See another example in Figure 8.
A change in the level of neural activity between search and repetition clearly appears at the population level (Fig. 5a). Although target preference did not change, spatial selectivity (as defined by the differences between the average activity for the four targets) did (see before; Fig. 5B). The main difference between search and repetition activity was a higher firing rate at the end and between trials, i.e. after a response and when the animal had to decide on the next move (Fig. 5c) (ANOVA, p<0.05; ITI, Early Delay and Late delay: 39%, 35.5%, and 25.5% of cells respectively). Note that the onset of delay activity during search appeared shortly after the time at which a reward should have occurred if the trial were correct (approximately 200ms after reward time).
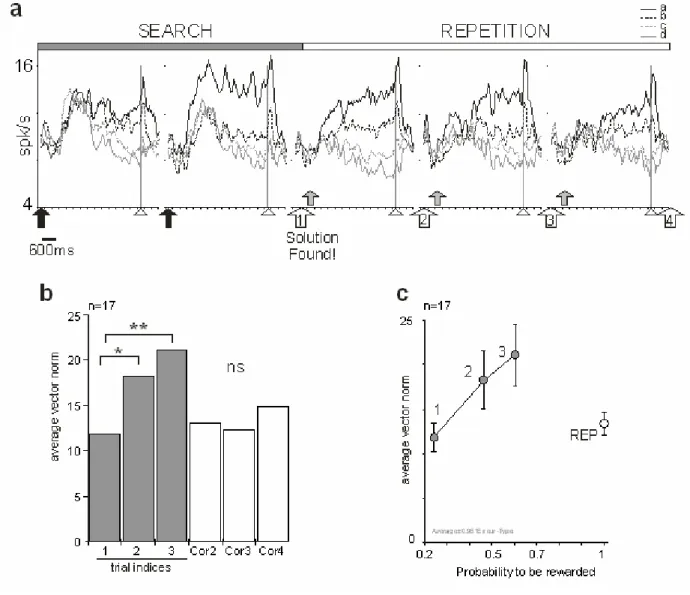
Evolution during the PS task
At the population level changes in amplitude and spatial selectivity were maximum prior to the first reward delivery, and decreased during repetition. Population PSTH for successive trials for 82 neurons revealed: 1) increased discrimination of the four targets just before the discovery of the correct target; and 2) a decrease in firing rate of delay activity in the repetition compared to the search period (Fig. 7a). Note that, these overall changes between the different successive trials for the entire population were significant for targets ‘a’ and ‘b’ only (One-way ANOVA). To better understand this phenomenon we need to examine what happens in the course of search periods, i.e. before arriving at the first correct trial. This requires analyzing neural activity of each cell recorded in different types of search trials (successive indices - see methods) and for each target. This was possible for 17 cells where we recorded sufficiently to have search trials with indices 1 to 3 for the four targets (an example is shown in Supplementary fig. 2Sa-b). The average activity during the early delay is represented for the different types of trials and for each target chosen so as to reveal changes in spatial selectivity during a problem. To illustrate and quantify these changes we calculated, for each cell, a preference vector from which we extracted the norm reflecting the strength of spatial selectivity (see methods – supplementary fig. a-b). The norm was calculated for each type of trial. The average norm for the 17 cells showed a significant increase during the search period, with a maximum at indices 3, i.e. just before discovering the correct target (Linear Mixed-Effects Model; effect of type of trial F=3.81, p=0.0038) (Fig. 7b). In comparison to the first trial (indices 1) only the 2nd and 3rd trials show significantly increased spatial selectivity. A clear transition was
observed between indices 3 and the second correct trial (Supplementary fig. 2Sc). Thus, spatial selectivity increased during the trial-and-error process, and the changes ceased as soon as the monkey obtained the first reward.
Activity patterns could either be stable during repetition (denoting a ‘routine’ state of activity), or change during successive repetitions. To address this, we recorded 14 cells during a PS task with 5 repetition trials. Thirteen cells showed a significant SEARCH vs. REPETITION effect. A repeated measure ANOVA proved significant for 5 cells but only 2 showed a coherent increase or decrease of activity along the repetition. Although we used a short repetition (n=5), these data support the idea of two levels of activation of prefrontal cells, during non-routine (search) and routine (repetition) behaviors, as if there was a clear functional switch between the two periods.
Reward expectations during PS task
Reward expectation is a key aspect of our experiments and we used two strategies to further investigate this issue.
First, changes in firing rate and target selectivity during search could reflect an increase in pure reward expectation, i.e. should be proportional to the probability of reward delivery. For the two first monkeys, we evaluated the probability to get a reward associated to each trial type using behavioral records of neural recordings sessions (from 395 and 188 problems respectively). The theoretical probabilities calculated for optimal performance are 0.33, 0.5, 1 and 1 for trial indices 1, 2, 3 and repetition respectively (see methods). Average probabilities estimated from behavioral data were 0.24, 0.46, and 0.6 for trial indices 1, 2, and 3. We found that spatial selectivity does not follow reward probability: plotting average vector norm values against the probability to get a reward shows the maximum at p = 0.6 and the decrease during repetition (Fig. 7c). This illustrates that changes in spatial selectivity during the PS task is not purely dependent on reward probability.
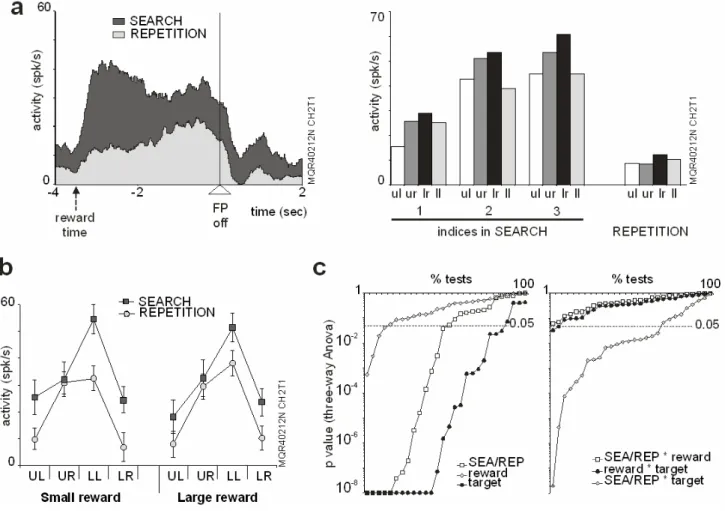
Second, in a third monkey 14 delay cells out of 66 task-related prefrontal activities were recorded during the PS task with reward size variation (see methods). One example is shown in figure 8a-b. The delay activity was strongly modulated between search and repetition – Fig. 8a) and also within the search in approach to the solution (Fig. 8a-right). This example illustrates also the fact that reward size had little effect on the modulations observed between search and repetition (Fig. 8b). Statistics on the single or combined effects of reward size, target position, and search
versus repetition periods show that the main
parameters influencing firing rates were target position and periods. The example shown in Figure 8a-b clearly illustrates these results. The statistics for all cells
performed on EOT, Early and Late delays reveal that spatial selectivity and differences between search and repetition are the major parameters influencing firing rates compared to reward size (Fig. 8c). These data argue against reward expectation as being a confounding factor for delay activity modulation during PS task.
Discussion
We show that 1) prefrontal neurons exhibiting delay activity in a traditional delayed response task are similarly engaged when an animal makes voluntary choices in a problem-solving task. The spatial selectivity of these neurons remains constant across tasks; 2) prefrontal neurons exhibit rapid plasticity in their activity tuning widths - not in their tuning preference per se- in correlation with changes in behavioral control. Thus, the characteristics of spatially selective prefrontal activity are task independent, but the depth of their spatial tuning can be modulated along the course of flexible self-organized behavior; and 3) that these modulations are not dependent on pure expectation or prediction but could relate to outcome uncertainty.
Previous experiments demonstrated the capacity of prefrontal unit activity to encode sensory attributes or direction of impending movements, and sequential information (Barone and Joseph, 1989; Funahashi et al., 1993; Constantinidis et al., 2001; Brody et al., 2003). Prefrontal activity has also been found to reflect prospective coding in delayed paired association tasks (Rainer et al., 1999; Brody et al., 2003).
In contrast to the DR, the PS task does not require active memory of past events, but rather requires facilitation (or activation) of a freely selected action plan and, as a consequence of a competitive process, the inhibition of past choices. The present data indicate that delay activity in the PS task primarily encodes the decision and/or plan for the next response and not the location of the previous target. The rapid increase of spatially tuned activity observed following an incorrect choice during search periods presumably relates to the decision made by the monkey regarding its impending choice. Such phenomena have been described by Fukushima et al. (2004), who showed that most of prefrontal delay activity represented saccade directions while monkeys performed a sequential target-shift task, in which monkeys were required to internally update the target position sequentially when a non-spatial target-shift cue was presented (Fukushima et al., 2004). These authors showed a flexible update of the target position encoding following non-spatial target-shift cues. They report that directional preference of each delay activity remained constant and that delay activity was observed whenever the direction of the saccade became the same as the neuron's preferred direction after target position updating.
In analogy with the delay period of a DR task, the epoch following a response in the PS search period is an information “black-out”, i.e. it does not contain explicit external information regarding the correct target or the location of the target to choose in the following trial, which must be supplied by the animal’s own volition. The abrupt increase in spatially tuned activity is presumably the equivalent of the mnemonic response in the DR task except that it is triggered here by a self-generated internal “cue”. That the delay activity is essentially the representation of a prospective move or movement goal is supported by the fact that the tuning of the average activity during delay predicts the animal’s response.
It could be argued that the response modulations that we have observed are due to change in rule encoding, in line with the proposition that prefrontal neurons encode behavioral rules (Miller and Cohen, 2001; Wallis et al., 2001; Genovesio et al., 2005). The DR and PS tasks in the present study involve different rules. In the DR task, the animal has to hold in mind an externally given stimulus position that differs in each single trial. The PS task, by contrast, engages a “win-stay/lose-shift” strategy. Nevertheless, despite the fact that the task rules changed, the spatial preference and tonic firing of the cells remained constant. Cases of preservation of spatial selectivity between a visual conditional and a spatial task have been reported by White and Wise (White and Wise, 1999), although in that study a rule effect was found in a majority of the cells recorded. In the present case, rule encoding fails also to explain modulations within the PS task, since 1) search and repetition are driven by the same rule “reward/stay no-reward/shift” and 2) the same rule applies also throughout the search period. Our data and findings related to abstract rule encoding in the prefrontal cortex open the possibility that generic rules are implemented by specified neurons as required by specific task domains, e.g. spatial tasks versus visual tasks.
Although the spatial specificity of cells is maintained in the different tasks, the spatial discrimination power of the response varies in particular within the search period in the PS task. Reward expectation or reward consumption could cause these variations since several studies have shown that reward quality or quantity can influence delay activities in prefrontal cortex (Watanabe, 1996; Leon and Shadlen, 1999; Amemori and Sawaguchi, 2006). The difference between search and repetition measured during ITI may well be a result of reward consumption: after correct responses, the focus of attention would presumably be on the reward rather than on the next response. In this way, the firing of prefrontal delay cells can relate to predicted behavioral outcomes or to the predictability of forthcoming
movement selections (Quintana and Fuster, 1992; Watanabe, 1996) as well as previous choice outcomes as shown during a competitive game-like task (Barraclough et al., 2004).
Reward expectation obviously plays some role in the increase of selectivity before the first reward. Reward is a major element of the task especially in the search period. However, information purely related to reward probability does not explain all the variations in DLPF activity. At the population level reward probability can explain neither the similarities seen between the DR task and search period, nor the differences between the DR task and repetition. In fact, the level of expectations is similar in the DR task and in repetition, and differs in the search period. Variation in the size of the reward expected by the monkey does not induce delay activity variations comparable to those observed depending on types of trials, a result that have been observed for planning related activity (Kobayashi et al., 2002; Amemori and Sawaguchi, 2006). Finally, pure expectation (directly related to reward probability) does not account for activity changes between the last trials in the search period (indices 3) and the other correct trials: if the amplitude of activity were related to reward probability, then activity should remain elevated for the following repetition trials during which reward expectation is maximal, i.e. during which the probability to get a reward is p=1. Thus, modulation of prefrontal activity during the PS task does not simply reflect an anticipatory reward-related bias as reported in the caudate nucleus (Lauwereyns et al., 2002). However, it is possible that DLPFC integrates some dimensions of reward expectation (Kobayashi et al., 2002; Amemori and Sawaguchi, 2006) with other factors involved in learning and control of behavior. One candidate is uncertainty.
Dopamine modulates delay activity in prefrontal cortex (Williams and Goldman-Rakic, 1995; Williams and Castner, 2006). Shultz and colleagues report that mesencephalic potentially dopaminergic neurons can show sustained activity that varies according to uncertainty of obtaining a particular reward (Fiorillo et al., 2003). This information might participate in modulating PFC delay activity in the PS task and could explain higher activity during search. The modulations we report here do not completely fit uncertainty (which should be maximal at p=0.5 - see Fig. 8), but one should note that on trial indices 3 the animal is often facing a choice between two remaining targets, i.e. an alternative with maximum uncertainty regarding the outcome. Moreover, this choice is key since the outcome at P = 0.5 contains the maximal amount of information (one bit) regarding the next choice. In this context, our findings are compatible with the hypothesis that the demands on dopamine for prefrontal modulation changes in relation to engagement of working memory and executive functions (Williams and Castner, 2006).
Different theories invoke sustained activity and its variations as a major element of DLPFC function (Goldman-Rakic, 1998; Miller and Cohen, 2001). Increased working memory load, higher cognitive control or attentional selection are concepts widely used to interpret prefrontal activity modulations dependant on task requirements (Miller and Cohen, 2001; Leung et al., 2002; Kerns et al., 2004). Note that these concepts are closely related. In fact, an executive function (including working memory) can be thought of as a special case of attentional phenomena (Barkley, 2001), and conversely attention can be seen as “a varying reflection, in behavior, of the operation of a single underlying mechanism of cognitive control” (Miller and Cohen, 2001). Various dimensions of attentional control and selection have been put forward as the main functions of the PFC (Rowe and Passingham, 2001; Lebedev et al., 2004).
Our descriptions of delay activity modulation can be related to increases in PFC activity as seen in human brain imaging studies during free random selection, learning, highly demanding working-memory tasks, and conflict situations, as opposed to lower activation for well-known or over-practiced motor responses (Jueptner et al., 1997a; Carter et al., 1998; Petersen et al., 1998; Leung et al., 2002). Similar tasks have also revealed the collaborative role of the anterior cingulate cortex (ACC) during behavior adaptation and we have described changes in ACC neuronal activity during the PS task with similar dynamics to those observed here in the DLPFC (Procyk et al., 2000).
Changes in delay activity observed in the three different conditions (DR, SEARCH, and REPETITION) might relate to the different task demands. It is likely that the DR task and the search period of the PS tasks are situations in which working memory is most heavily engaged. Increased involvement of this process is particularly important to deal with unfamiliar or challenging situations in contrast to routine situations. This interpretation would explain why the strongest and most selective activities are observed at the end of the search (Fig. 7-8), i.e. when inhibiting previous incorrect choices and keeping the next potentially correct one in mind is critical. High control of behavior through spatially selective delay activity would facilitate the selection and expression of the appropriate responses, suppress or win competition with the inappropriate or prepotent ones, and contribute to resisting interference (Goldman-Rakic, 1998; Miller and Cohen, 2001; Sakai et al., 2002). This phenomenon might also take place during visual attentional tasks in which filtering of visual information has been described (Everling et al., 2002). The adaptive properties of prefrontal delay activity are expected to reflect the basic mechanisms by which they influence connected structures. In this framework the present data reflects variations of top-down signals
devoted to maintain and bias internal representations to guide goal-oriented behaviors (Goldman-Rakic, 1998; Sakai et al., 2002; Cohen et al., 2004).
Bibliography
Amemori K, Sawaguchi T (2006) Contrasting effects of reward expectation on sensory and motor memories in primate prefrontal neurons. Cereb Cortex 16:1002-1015. Amiez C, Joseph JP, Procyk E (2005) Anterior cingulate
error-related activity is modulated by predicted reward. Eur J Neurosci 21:3447-3452.
Baddeley AD (1986) Working Memory. New York: Oxford UniversityPress.
Barkley RA (2001) Linkages between attention and executive functions. In: Attention, memory and executive function (Reid Lyon G, Krasnegor NA, eds), pp 307-326: P.H. Brooks.
Barone P, Joseph JP (1989) Prefrontal cortex and spatial sequencing in macaque monkey. Exp Brain Res 78:447-464.
Barraclough DJ, Conroy ML, Lee D (2004) Prefrontal cortex and decision making in a mixed-strategy game. Nat Neurosci 7:404-410.
Brody CD, Hernandez A, Zainos A, Romo R (2003) Timing and neural encoding of somatosensory parametric working memory in macaque prefrontal cortex. Cereb Cortex 13:1196-1207.
Carter CS, Braver TS, Barch DM, Botvinick MM, Noll D, Cohen JD (1998) Anterior cingulate cortex, error detection, and the online monitoring of performance. Science 280:747-749.
Chafee MV, Goldman-Rakic PS (1998) Matching patterns of activity in primate prefrontal area 8a and parietal area 7ip neurons during a spatial working memory task. J Neurophysiol 79:2919-2940.
Coe B, Tomihara K, Matsuzawa M, Hikosaka O (2002) Visual and anticipatory bias in three cortical eye fields of the monkey during an adaptive decision-making task. J Neurosci 22:5081-5090.
Cohen JD, Aston-Jones G, Gilzenrat MS (2004) A systems-level perspective on attention and cognitive control. In: Cognitive Neuroscience of attention (Posner MI, ed), pp 71-90: Guilford.
Constantinidis C, Franowicz MN, Goldman-Rakic PS (2001) The sensory nature of mnemonic representation in the primate prefrontal cortex. Nat Neurosci 4:311-316. Dehaene S, Kerszberg M, Changeux JP (1998) A neuronal
model of a global workspace in effortful cognitive tasks. Proc Natl Acad Sci U S A 95:14529-14534.
Everling S, Tinsley CJ, Gaffan D, Duncan J (2002) Filtering of neural signals by focused attention in the monkey prefrontal cortex. Nat Neurosci 5:671-676.
Fiorillo CD, Tobler PN, Schultz W (2003) Discrete coding of reward probability and uncertainty by dopamine neurons. Science 299:1898-1902.
Frith CD, Friston KJ, Liddle PF, Frackowiak RS (1991) Willed action and the prefrontal cortex in man: a study with PET. Proc R Soc Lond B Biol Sci 244:241-246.
Fukushima T, Hasegawa I, Miyashita Y (2004) Prefrontal neuronal activity encodes spatial target representations
sequentially updated after nonspatial target-shift cues. J Neurophysiol 91:1367-1380.
Funahashi S, Bruce CJ, Goldman-Rakic PS (1989) Mnemonic coding of visual space in the monkey's dorsolateral prefrontal cortex. J Neurophysiol 61:331-349.
Funahashi S, Chafee MV, Goldman-Rakic PS (1993) Prefrontal neuronal activity in rhesus monkeys performing a delayed anti-saccade task. Nature 365:753-756.
Fuster JM (1997) The prefrontal cortex. Anatomy, physiology and neuropsychology of the frontal lobe, 3rd Edition: Lippincott-Raven.
Genovesio A, Brasted PJ, Mitz AR, Wise SP (2005) Prefrontal cortex activity related to abstract response strategies. Neuron 47:307-320.
Goldman-Rakic PS (1987) Circuity of primate prefrontal cortex and regulation of behavior by representational memory. In: Higher functions of the brain (Plum F, ed), pp 373-414. Bethesda: American physiological society.
Goldman-Rakic PS (1995) Cellular basis of working memory. Neuron 14:477-485.
Goldman-Rakic PS (1998) The prefrontal landscape: implications of functional architecture for understanding human mentation and the central executive. In: The prefrontal cortex. Executive and cognitive functions (Roberts AC, Robbins TW, Weiskrantz L, eds), pp 87-102: Oxford Univ Press. Jueptner M, Frith CD, Brooks DJ, Frackowiak RS,
Passingham RE (1997a) Anatomy of motor learning. II. Subcortical structures and learning by trial and error. J Neurophysiol 77:1325-1337.
Jueptner M, Stephan KM, Frith CD, Brooks DJ, Frackowiak RS, Passingham RE (1997b) Anatomy of motor learning. I. Frontal cortex and attention to action. J Neurophysiol 77:1313-1324.
Kerns JG, Cohen JD, MacDonald AW, 3rd, Cho RY, Stenger VA, Carter CS (2004) Anterior cingulate conflict monitoring and adjustments in control. Science 303:1023-1026.
Kobayashi S, Lauwereyns J, Koizumi M, Sakagami M, Hikosaka O (2002) Influence of reward expectation on visuospatial processing in macaque lateral prefrontal cortex. J Neurophysiol 87:1488-1498. Lauwereyns J, Watanabe K, Coe B, Hikosaka O (2002) A
neural correlate of response bias in monkey caudate nucleus. Nature 418:413-417.
Lebedev MA, Messinger A, Kralik JD, Wise SP (2004) Representation of attended versus remembered locations in prefrontal cortex. PLoS Biol 2:e365. Leon MI, Shadlen MN (1999) Effect of expected reward
magnitude on the response of neurons in the dorsolateral prefrontal cortex of the macaque. Neuron 24:415-425.
Leung HC, Gore JC, Goldman-Rakic PS (2002) Sustained mnemonic response in the human middle frontal gyrus during on-line storage of spatial memoranda. J Cogn Neurosci 14:659-671.
Miller EK, Cohen JD (2001) An integrative theory of prefrontal cortex function. Annu Rev Neurosci 24:167-202.
Passingham RE (1985) Memory of monkeys (Macaca mulatta) with lesions in prefrontal cortex. Behav Neurosci 99:3-21 a.
Passingham RE, Sakai K (2004) The prefrontal cortex and working memory: physiology and brain imaging. Curr Opin Neurobiol 14:163-168.
Petersen SE, van Mier H, Fiez JA, Raichle ME (1998) The effects of practice on the functional anatomy of task performance. Proc Natl Acad Sci U S A 95:853-860. Petrides M (1995) Functional organization of the human
frontal cortex for mnemonic processing. Evidence from neuroimaging studies. Ann N Y Acad Sci 769:85-96 b. Procyk E, Joseph JP (1996) Problem solving and logical
reasoning in the macaque monkey. Behav Brain Res 82:67-78.
Procyk E, Tanaka YL, Joseph JP (2000) Anterior cingulate activity during routine and non-routine sequential behaviors in macaques. Nat Neurosci 3:502-508.
Quintana J, Fuster JM (1992) Mnemonic and predictive functions of cortical neurons in a memory task. Neuroreport 3:721-724.
Quintana J, Yajeya J, Fuster JM (1988) Prefrontal representation of stimulus attributes during delay tasks. I. Unit activity in cross-temporal integration of sensory and sensory-motor information. Brain Res 474:211-221. Rainer G, Miller EK (2002) Timecourse of object-related
neural activity in the primate prefrontal cortex during a short-term memory task. Eur J Neurosci 15:1244-1254. Rainer G, Rao SC, Miller EK (1999) Prospective coding for
objects in primate prefrontal cortex. J Neurosci 19:5493-5505.
Rao SC, Rainer G, Miller EK (1997) Integration of what and where in the primate prefrontal cortex. Science 276:821-824.
Romo R, Brody CD, Hernandez A, Lemus L (1999) Neuronal correlates of parametric working memory in the prefrontal cortex. Nature 399:470-473.
Rowe JB, Passingham RE (2001) Working memory for location and time: activity in prefrontal area 46 relates to selection rather than maintenance in memory. Neuroimage 14:77-86.
Sakagami M, Niki H (1994) Spatial selectivity of go/no-go neurons in monkey prefrontal cortex. Exp Brain Res 100:165-169.
Sakai K, Rowe JB, Passingham RE (2002) Active maintenance in prefrontal area 46 creates distractor-resistant memory. Nat Neurosci 5:479-484.
Shidara M, Richmond BJ (2002) Anterior cingulate: single neuronal signals related to degree of reward expectancy. Science 296:1709-1711.
Takeda K, Funahashi S (2002) Prefrontal Task-Related Activity Representing Visual Cue Location or Saccade Direction in Spatial Working Memory Tasks. J Neurophysiol 87:567-588.
Wallis JD, Anderson KC, Miller EK (2001) Single neurons in prefrontal cortex encode abstract rules. Nature 411:953-956.
Watanabe M (1996) Reward expectancy in primate prefrontal neurons. Nature 382:629-632.
White IM, Wise SP (1999) Rule-dependent neuronal activity in the prefrontal cortex. Exp Brain Res 126:315-335.
Williams GV, Goldman-Rakic PS (1995) Modulation of memory fields by dopamine D1 receptors in prefrontal cortex. Nature 376:572-575.
Williams GV, Castner SA (2006) Under the curve: critical issues for elucidating D1 receptor function in working memory. Neuroscience 139:263-276. Wise SP, Murray EA, Gerfen CR (1996) The frontal
cortex-basal ganglia system in primates. Critical Reviews in Neurobiology 10:317-356.
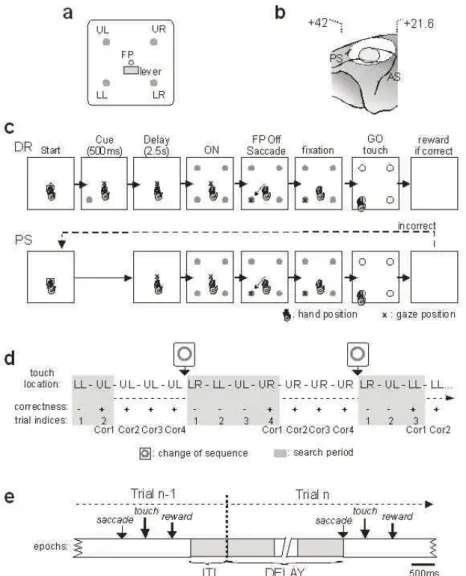
Figure 1. Display, trial structures in DR and PS tasks, task-related intervals, and location of recordings.
(a) Location of stimuli on the display monitor. Four target items (disks of 5mm in diameter) were used: upper left (UL), upper right (UR), lower right (LR), lower left (LL). A central white disk served as fixation point (FP). The lever was disposed just below the FP.
(b) Location of the recording chamber (outer circle) and of the area of recordings (inner dotted circle) based on the pre-surgery MRI of the animal. Stereotaxic coordinates of the anterior and posterior limits of the chamber are shown.
(c) Diagram of trial events for the delayed response (DR) and problem solving (PS) tasks. In the DR the animal had to start the trial by touching the lever and holding his touch. The FP appeared and the animal had to fixate it with his gaze. A cue appeared at one of the four locations. A delay period followed, and ended by the simultaneous onset of the four targets. At the FP offset the animal made a saccade toward a target, fixated it, and then touched it following the GO signal. A reward was delivered for choosing the correct target. The structure of a trial in the PS task was similar except that there was no cue. The animal had to search for the correct target by trial and error. If a choice in one trial was incorrect, the monkey could select another target in the following trial and so on until the solution was discovered (search period). Each touch was followed by an interval of 2000ms.
(d) Example of a chronological list of trials during the PS task. In the first problem, the monkey discovered the solution (UL) in two trials. Then he repeated three times the correct response (repetition period). The different types of trials are indicated below (-: incorrect; +: correct).
(e) Schematic representation of two successive trials (n-1 and n) in the PS task, and of the epochs used for analysis: ITI (inter-trial interval), DELAY (Early + Late; see experimental procedure). The time interval between one touch and the saccade in the next trial was the focus of our study, and was used to represent neural activity in figure 2, and 4-7.
Figure 2. Behavioral Data from the third animal performing the PS task with reward size variation. (a). Reaction times (RT) for arm movements and saccades during search and repetition periods of the PS task. (b) RT for arm movements in the successive trials of search and repetition periods. (c and d) break of fixation errors for the Large and Small reward conditions. The animal is making breaks of fixation later in the course of a trial during search than during repetition (c). For the large reward trials the breaks are done in majority at the initiation of the trial whereas they occur more often at the time of saccade toward the target for the Small reward trials (d).
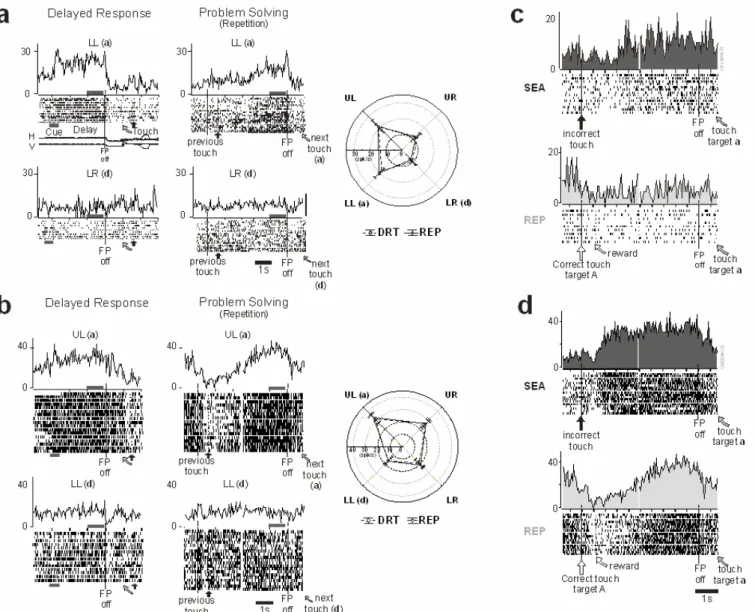
Figure 3. Examples of delay activity in the different tasks. Two Delay cells (a and b) in the DR and PS tasks. Raster and histograms show responses of a single neuron for the preferred (a) and least preferred (d) targets in the DR and PS (Repetition trials only) tasks. The activity is aligned on the FP offset in DR trials, and on the previous touch time and on the FP offset in PS trials. Sample of eye movement recordings are presented for DR trials (H and V). A gray horizontal bar below rasters underlines the cue period in the DR task. Time of target touch and reward delivery are indicated by tick marks in rasters and a curved arrow and a black upward arrow respectively below rasters. The polar graphs represent the average activity measured in Late delay (indicated by a gray horizontal bar below histograms - see also Fig. 1 and methods) for the four targets during the DR and PS tasks (dashed and plain line respectively). For both cells, the spatial selectivity was identical in the two tasks. (c and d). Comparison between Search and Repetition trials for two delay neurons (A and B) recorded during the PS task. The figure presents the activity between two successive choices when the second one was on target ‘a’ (best target). Trials from the search and repetition periods are separated and noted SEA and REP. (c) The neuron expressed tonic activity during the search period. This activity disappeared during repetition periods. (d) For this cell, the activity increased within 300ms after the time at which the reward would have occurred in a correct trial and stayed tonic until the next response (touch target ‘a’). In Repetition trials, this short latency response disappeared.
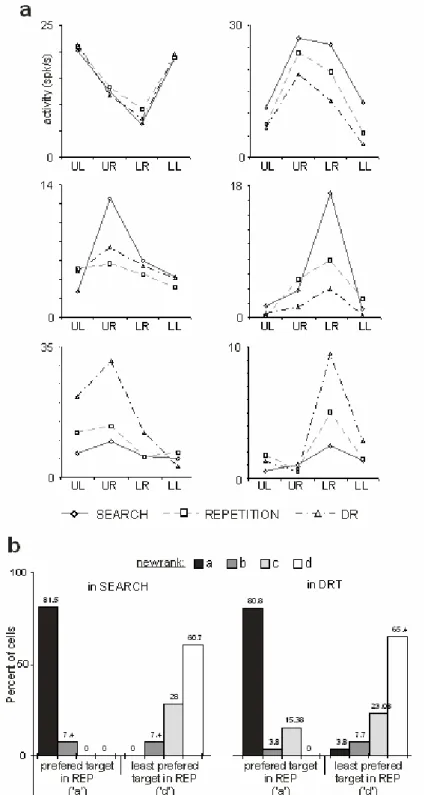
Figure 4. Conservation of spatial preference (a) Influence of task period on 6 delay cells. Each plot presents the average delay activity for one cell and for the four target locations (UL, UR, LR, LL) in the three periods (Search, Repetition, and DR). Two-way ANOVA; Top left: target location: p<10-7, period: ns, interaction: ns – Top right: target: p<10-5, period: p<0.006, interaction: ns – Middle raw: target: p<10-7, period: p<0.05, interaction: p<0.002 – Lower raw: target: p<10-7, period: p<0.005, interaction: p<0.005. (b) Histogram showing the proportion of cells for which activity for target ‘a’ and ‘d’ in Repetition (REP) could be reclassified as ‘a’, ‘b’, ‘c’ or ‘d’ in Search and DR task (from 26 cells). 80% of cells kept their preferred target ‘a’ in Search and DR task.
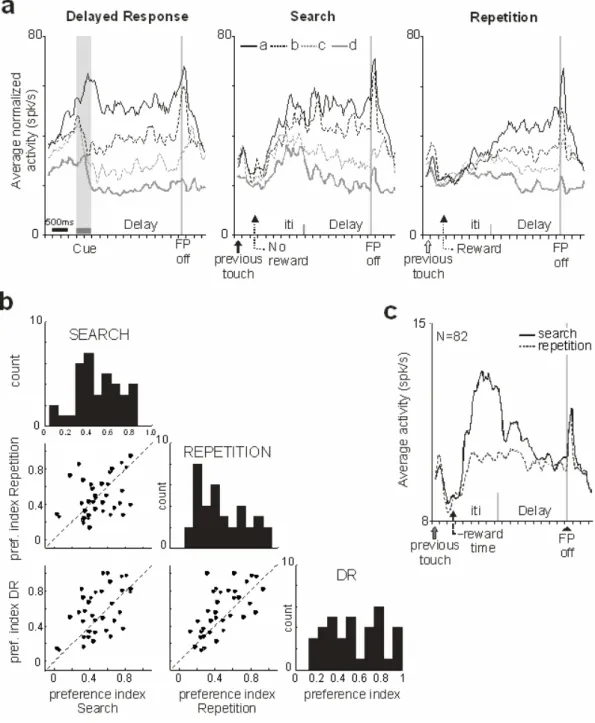
Figure 5. Population activity in DR and PS tasks. In (a) the activity of 36 cells recorded during both DR and PS tasks was normalized and averaged (see methods). Note that the spatial selectivity stays identical from one task to another although changes in amplitude occurred between search and repetition. In DR task, the spatial selectivity observed in anticipation of the cue onset is a consequence of trial blocking used in the first few recording sessions (see methods). In (b), the preference index is plotted for the 36 cells recorded in PS task and DR task, and for the 3 periods: Search, Repetition, and DR. (Correlation coefficients: REP vs SEA: r² = 0.1261; r = 0.3551; p = 0.0336; SEA vs DRT: r² = 0.2797; r = 0.5288; p = 0.0009; REP vs DRT: r² = 0.4251; r = 0.6520; p = 0.00002). In (c), the grand average activity for all targets and all cells during search and repetition shows the main difference at the end of trial and at the beginning of the delay period, but not at the time of saccade.
Figure 6. Space coding during search trials. (a) Each graph shows the population activity for an average trial [n] (in the white area) and, the average delay activity of the previous trials [n-1] (in the gray area). The upper diagram shows averages calculated by sorting trials according to the position of the target (a, b, c, or d) selected in the previous trials [n-1] (downward arrow). In the lower diagram, trials were sorted according to the upcoming choice, in [n]. Black upward arrows indicate events (target touch and FP off). Note that the spatial selectivity appears only when activity is sorted according to the choice made at the end of the delay, and not when it is sorted according to the previous choice. (b) p-values obtained when influence of target-location was tested for trials sorted according to previous choice or upcoming choice. The ANOVA has been run for each cell and for early and late delays separately. In ordinate the p values on a log scale. The horizontal red line shows the statistical threshold at p=0.05. The inset shows the two p-values plotted against each other for each delay.
Figure 7. Modulation of selectivity during the PS task. (a) Evolution of activity for the entire population of 82 cells. Graphs present the average activity for different succession of trials during an average problem. Black arrows indicate incorrect touches, arrowheads indicate FP offset, white numbered arrows indicate the successive correct touches during repetition, and red arrows indicate reward deliveries. The first reward signifies discovery of the correct response. Note that the activity at the end of trials and during the delay, as well as the strength of spatial selectivity, changes during the search and then along the repetition period. The highest discrimination for the best target is seen just before the discovery. Effect of trials on activity in Early delay: one-way ANOVA, target A: F=4.49, p<0.002; B: F=4.003, p<0.004; C: F=1.26, ns; D: F=1.19, ns. (b) Average vector norm calculated for 17 delay cells along search and repetition periods. See the significant increase in vector norm in search and decrease in repetition. (c) Plot of average vector norms for 17 cells against the probability to be rewarded. The probabilities are estimated from behavioral data (see methods and results). 1, 2 and 3 label data for trials indices 1, 2 and 3.
Figure 8. Reward size effect compared to space and task period effect. (a and b) represent data from one delay activity recorded in the third monkey. The average firing rate in search and repetition, all targets together, from the time of feedback to the next target selection is represented in (a) on the left. On the right, data for the different trial types showing the change in activity for that cell during search and between search and repetition (FP off: fixation point offset). In (b) the average discharge in early delay for the four targets, the two periods of the PS task, and the two reward sizes. In (c), the probability obtained from statistical testing (ANOVA) of the relative effects of period (SEA, REP), reward size, and target position on the average activity measured in ITI, early and late delays. On the right, the p-values correspond to interaction effects. The grey horizontal line marks the selected threshold for statistical significance (p=0.05). Note that period (search/repetition) and target position have the major influence on neural activity.
![Figure 6. Space coding during search trials. (a) Each graph shows the population activity for an average trial [n] (in the white area) and, the average delay activity of the previous trials [n-1] (in the gray area)](https://thumb-eu.123doks.com/thumbv2/123doknet/14698083.563850/17.892.304.628.155.938/figure-space-population-activity-average-average-activity-previous.webp)