Neurosensory and functional impairment in sagittal split
osteotomies: a longitudinal and long-term follow-up study
Christof Urs Joss * and Urs Walter Thüer **
* Department of Orthodontics, University of Geneva, Switzerland and ** Department of Orthodontics, University of Bern, Switzerland
SUMMARY The aim was to conduct a long-term follow-up study on the function and sensitivity of the mandible in advancement and setback patients after bilateral sagittal split osteotomy (BSSO) with rigid internal fi xation.
The advancement and setback groups consisted of 16 (12 females and 4 males, mean age: 21.4 and 21.3 years, respectively) and 17 (11 females and 6 males, mean age: 27.1 and 27.7 years, respectively). The fi nal follow-up was a mean of 12.7 years (T4) post-operatively. The other follow-up examinations were before surgery (T1) and 7.3/6.6 (T2) and 13.9/14.4 (T3) months after surgery. To evaluate craniomandibular function, mouth-opening capacity, laterotrusion, protrusion, deviations during opening, pain and clicking of the temporomandibular joint (TMJ), muscular pain, and the retruded contact position – intercuspal position (RC–IP) distance were examined. A questionnaire was used to record subjective reports. The neurosensory status was determined with two-point discrimination (2-pd), the pointed, blunt, and light-touch tests. Statistical analysis included the following tests: Wilcoxon signed ranked matched pairs, Mann – Whitney U , paired t , and Fisher’s exact test. Bonferroni’s adjustments were made for evaluation of the questionnaire and Spearman’s rank correlation coeffi cients to determine the interdependence of selected variables. Craniomandibular function showed restitution at T4 after 12.7 years. The 2-pd at the lip and chin had largely normalized in the two groups at T3. At T4, there was a signifi cant increase of 2-pd at the lip and chin in both groups. The discrimination between sharp and blunt was limited in both groups in 25 per cent of patients at T4. Dysfunctions such as TMJ clicking, bruxism, and pain in the TMJ and muscles were neither increased nor decreased after BSSO. The initial post-surgical neurosensory impairment was barely detectable 1 year post-surgery. The new neurosensory impairment manifested at T4 was probably due to the normal human process of ageing. Neither age, gender, surgical advancement, nor setback showed any signifi cant correlations.
Introduction
The bilateral sagittal split osteotomy (BSSO) was fi rst described by Trauner and Obwegeser (1955) . Since then, several modifi cations have been made by different surgeons ( Dal Pont, 1961 ; Hunsuck, 1968 ; Spiessl, 1976 ).
Orthognathic surgery may evoke functional and structural changes within the stomatognathic system. Both the orthodontist and the surgeon are concerned with maintaining normal function of the stomatognathic system and eliminating functional and sensory impairment after BSSO.
Today, there is general agreement that the signs and symptoms of craniomandibular dysfunction are mostly
reduced after BSSO ( Pepersack and Chausse, 1978 ;
Ingervall et al. , 1979 ; Wisth, 1984 ; Kerstens et al. , 1989 ; Harper, 1990 ). However, others have reported negative infl uences ( O’Ryan and Epker, 1983 ; Storum and Bell, 1984 ; Aragon et al. , 1985 ; Harper, 1990 ) after BSSO.
Numerous studies have been published on sensory impairment after BSSO. Unfortunately, the data of these studies are still very heterogeneous. Other authors have therefore claimed to have standardized examination methods ( Jones et al. , 1990 ; Chen et al. , 1999 ).
The aim of the present research was to analyse subjective and objective functional and sensory impairment after mandibular advancement and set-back surgery with the BSSO technique and rigid internal fi xation, and to compare recovery after the two procedures in a long-term follow-up study. It should be considered as a continuation of a previous investigation ( Thüer et al. , 1997 ). The two procedures were undertaken using the same surgical technique and by the same surgeons.
Subjects and methods
As a continuation of the study by Thüer et al. (1997) , 16 patients with mandibular advancement and 17 with mandibular setback could be re-examined. As a consequence of marriage and change of name, residence, etc., the initial number of 25 in the mandibular advancement and 24 in the mandibular setback group could not be maintained (lost to follow-up).
There were 12 females (mean age: 21.4 years, range: 17.0 – 30.1 years) and four males (mean age: 21.3 years, range: 20.0 – 22.8 years) in the advancement group and in the set back group
six females (mean age: 27.1 years, range: 18.9 – 40.5 years) and 11 males (mean age: 27.7 years, range: 18.5 – 54.8 years).
All had sagittal split osteotomies with rigid lag screw fi xation. No genioplasties were performed. The surgical procedure, the amount of surgical displacement, and the effect on the hard and soft tissues have previously been described in detail ( Raveh et al. , 1988 ; Thüer et al. , 1994 ; Ingervall et al. , 1995 ).
Records were obtained in the advancement group 1 day (range: 0 – 1 day) before (T1), 7.3 months (range: 6.0 – 9.9 months) after (T2), 13.9 months (range: 11.8 – 19.3 months) after (T3), and 12.7 years (range: 10.9 – 14.2 years) after (T4) surgery and in the setback group, 1 day (range: 0 – 5 days) before (T1), 6.6 months (range: 4.2 – 9.7 months) after (T2), 14.4 months (range: 11.5 – 18.7 months) after (T3), and 12.7 years (range: 11.1 – 14.0 years) after (T4) surgery.
Craniomandibular function
All subjective and objective tests were carried out as described previously ( Thüer et al. , 1997 ).
Symptoms. Symptoms of craniomandibular dysfunction
were evaluated by a questionnaire, which included questions on the ability to chew and bite, parafunctions, occurrence of headaches, complaints concerning mandibular function, and pain in the temporomandibular joint (TMJ) and muscles. The patients could fi ll in the questionnaire with the optional help of an examiner to explain the questions that were unclear, but without infl uencing the patient’s opinion. The questions and the number of affi rmative answers are presented in Table 1 .
Signs. Clinical fi ndings on function were recorded as
follows.
1. The maximum opening capacity was measured with a steel ruler to the nearest half millimetre as the distance between the edges of the maxillary and mandibular central incisors, with the addition of overbite. The mean of the two measurements was recorded as the maximum opening capacity.
2. Maximum lateral movement was measured as follows: a vertical line was drawn at maximum intercuspation from one maxillary incisor to the corresponding mandibular incisor. The patient then moved the mandible to either side as far as possible, opening his or her mouth just as far as necessary to disclose the teeth. The maximum side-shift capacity was measured with a ruler, and the mean of two measurements each to the right and the left was used.
3. Overjet was measured with a steel ruler at maximum protrusion. The patient was then asked to advance the mandible as far as possible. The distance between the labial surfaces of the maxillary and mandibular incisors was measured at maximum intercuspation and maximum protrusion. The sum of the two measurements is the maximum protrusion. The mean of the two measurements was used.
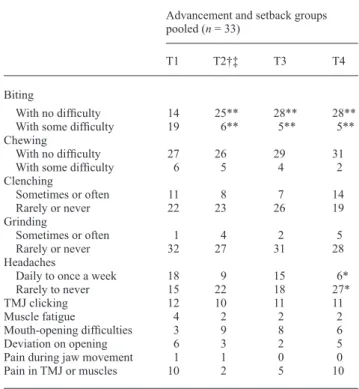
Table 1 Number of affi rmative answers to questions regarding biting, chewing, and symptoms of craniomandibular dysfunction before surgery (T1), 7.3/6.6 months after surgery (T2), 13.9/14.4 months after surgery (T3), and 12.7 years after surgery in the advancement/setback groups.
Advancement and setback groups pooled ( n = 33)
T1 T2 † ‡ T3 T4 Biting
With no diffi culty 14 25** 28** 28** With some diffi culty 19 6** 5** 5** Chewing
With no diffi culty 27 26 29 31 With some diffi culty 6 5 4 2 Clenching Sometimes or often 11 8 7 14 Rarely or never 22 23 26 19 Grinding Sometimes or often 1 4 2 5 Rarely or never 32 27 31 28 Headaches
Daily to once a week 18 9 15 6* Rarely to never 15 22 18 27*
TMJ clicking 12 10 11 11
Muscle fatigue 4 2 2 2
Mouth-opening diffi culties 3 9 8 6
Deviation on opening 6 3 2 5
Pain during jaw movement 1 1 0 0
Pain in TMJ or muscles 10 2 5 10 TMJ, temporomandibular joint.
Signifi cant differences were calculated together with a Bonferroni adjust-ment ( P / n ; n = 3): * P ≤ 0.01667, ** P ≤ 0.00333, and *** P ≤ 0.000333. † After 7.3 months n = 15. ‡ After 6.6 months n = 16.
4. Deviations to the left or right during maximum opening were recorded on a three-point scale: 0 = 0 – 1 mm; 1 = 2 – 5 mm, and 2 = >5 mm. The patients were also examined for audible or palpable TMJ sounds.
5. Tenderness of the TMJ was examined by palpation from a lateral and posterior position (via the ear canal). Grade 1 was recorded when the subject could feel a difference between the right and left sides, or if the palpation was painful, and grade 2 when the patient showed a palpebral refl ex or guarding.
6. The antero-posterior and lateral distances between the retruded contact position (RCP) and the intercuspal position (ICP) of the mandible were measured with a ruler to the nearest half millimetre ( Helkimo et al. , 1973 ).
Neurosensory test
The examiner fi rst asked the patient to describe their perceptions in the lower lip and the chin. The function of the inferior alveolar nerve was then tested by examination of the innervation of the mental nerve by distinguishing two regions of the lip and chin: the lower lip and the region between the vermilion border of the lower lip and the
lower border of the chin. The following tests were carried out:
Light-touch test. The light-touch test was performed with a
cotton roll, with the subject’s eyes closed. The patients were asked to compare the left and the right sides and inform the examiner whether they found the light touch normal or abnormal.
Pointed-and-blunt test. A ball burnisher and a pointed dental
probe were pressed lightly and randomly on the skin to check the ability to differentiate between pointed and blunt objects.
Two-point touch test (2-pd). The patient’s ability to
discriminate between two points was measured with a sliding calliper. The two pointed, but not sharp, tips of the calliper touched the skin simultaneously with light pressure while the patient’s eyes were closed. The separation of the two points was gradually reduced from 20 mm at the chin and 10 mm at the lips to the moment where the patient could feel one point only. The minimum separation at which two points could be reported was recorded.
Buccal nerve test. Both cheeks were gripped with two fi ngers to check the sensitivity of the buccal nerve.
Statistical methods
The following tests were used: Wilcoxon’s signed rank test for matched pairs, the Mann – Whitney U -test for comparisons between mandibular advancement and setback and the paired t -test for comparisons between the right and left sides of the face. Fisher’s exact test was applied in the analysis of the questionnaire and the data on craniomandibular function and neurosensory status ( Tables 1 – 3 ). Spearman’s ranked correlation coeffi cients were calculated for evaluation of the interdependence of selected variables.
Results
Craniomandibular function
For evaluation of the questionnaire, the two groups were
combined ( Table 1 ). The questionnaire showed a very
signifi cant ( P < 0.00333) increase in the number of patients who had no diffi culties in biting, from 14 to 28. Headaches which occurred daily to once a week decreased signifi cantly ( P < 0.01667), from 18 to 6 patients.
The objective examination ( Table 2 ) did not reveal any symptoms of deviation on opening in the two groups, i.e. TMJ clicking and pain on palpation of TMJ from the lateral or posterior position that differed signifi cantly with time. On the whole, the prevalence of most of the symptoms of craniomandibular function were either numerically smaller after surgery or remained numerically the same as before surgery. Exceptions were seen in the number of TMJ clickings unilaterally and deviation on opening in the advancement group at T4.
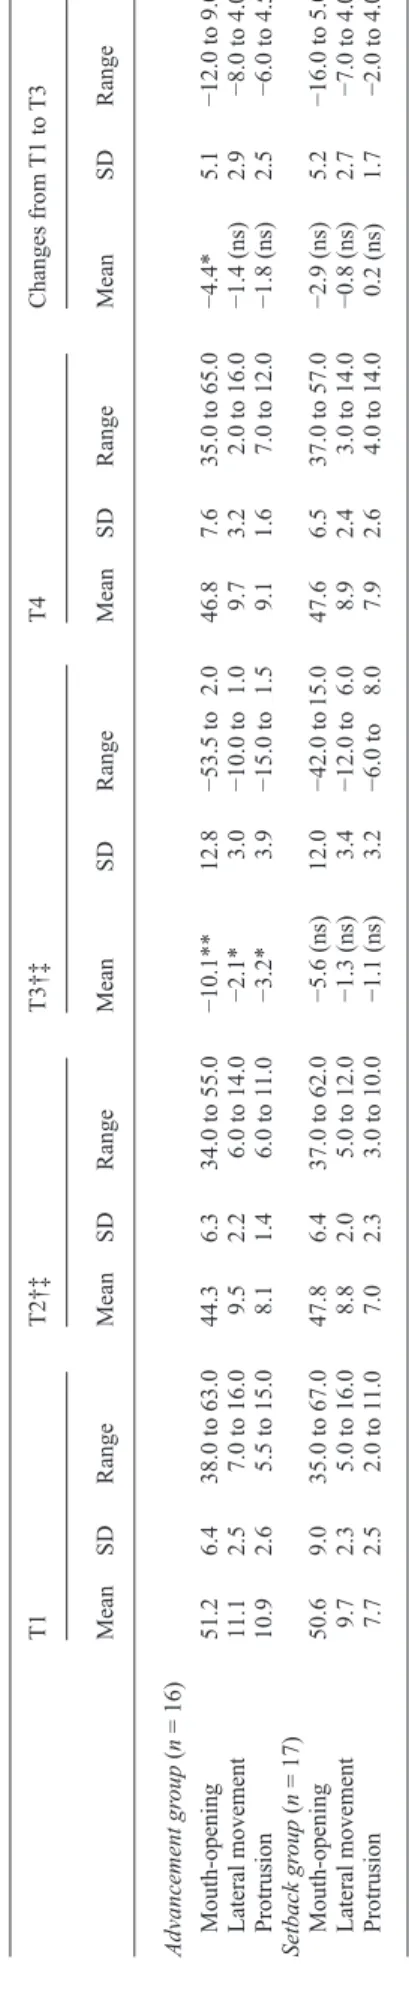
The maximum opening capacity ( Tables 4 and 5 , Figure 1 ) was less in the two groups at T2 than that before surgery.
A very signifi cant decrease of − 6.75 mm was observed in the advancement group and a non-signifi cant decrease of − 5.55 mm in the setback group. At T3, there was an improvement but still a signifi cant decrease of − 4.43 mm in the advancement group and a non-signifi cant decrease of − 2.93 mm in the setback group. A complete restitution of maximum opening capacity was seen at T4.
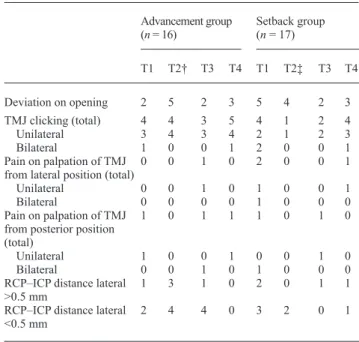
Table 2 Number of patients with signs of craniomandibular dysfunction before surgery (T1), 7.3/6.6 months after surgery (T2), 13.9/14.4 months after surgery (T3), and 12.7 years after surgery in the advancement/setback groups.
Advancement group ( n = 16) Setback group ( n = 17) T1 T2 † T3 T4 T1 T2 ‡ T3 T4 Deviation on opening 2 5 2 3 5 4 2 3 TMJ clicking (total) 4 4 3 5 4 1 2 4 Unilateral 3 4 3 4 2 1 2 3 Bilateral 1 0 0 1 2 0 0 1 Pain on palpation of TMJ from lateral position (total)
0 0 1 0 2 0 0 1
Unilateral 0 0 1 0 1 0 0 1
Bilateral 0 0 0 0 1 0 0 0
Pain on palpation of TMJ from posterior position (total)
1 0 1 1 1 0 1 0
Unilateral 1 0 0 1 0 0 1 0
Bilateral 0 0 1 0 1 0 0 0
RCP – ICP distance lateral
>0.5 mm 1 3 1 0 2 0 1 1
RCP – ICP distance lateral <0.5 mm
2 4 4 0 3 2 0 1
Signifi cant differences were calculated together with a Bonferroni adjust-ment ( P / n ; n = 3): * P ≤ 0.01667, ** P ≤ 0.00333, and *** P ≤ 0.000333. † After 7.3 months n = 15. ‡ After 6.6 months n = 16.
Table 3 Number of patients with abnormal reactions to touch tests before surgery (T1), 7.3/6.6 months after surgery (T2), 13.9/14.4 months after surgery (T3), and 12.7 years after surgery in the advancement/setback groups.
Advancement group ( n = 16) Setback group( n = 17) T1 T2 † T3 T4 T1 T2 ‡ T3 T4 Abnormal reaction to light touch 1 3 3 7 0 4 4 7* Reduced ability to differentiate between pointed and blunt touch
1 4 4 5 0 4 5 4
Disturbed sensitivity
of the cheek 0 0 1 1 0 2 1 0
Signifi cant differences were calculated together with a Bonferroni adjustment ( P / n ; n = 3): * P ≤ 0.01667, ** P ≤ 0.00333, and *** P ≤ 0.000333. † After 7.3 months n = 15. ‡ After 6.6 months n = 16.
Lateral movement capacity and maximum protrusion ( Tables 4 and 5 ) showed a signifi cant increase only in the advancement group, whereas a signifi cant and a non-signifi cant decrease were observed at T4 in the setback group. At T4, lateral movement capacity was restored in both groups, but maximum protrusion was restored only in the setback group. The advancement group still had a decrease of − 1.63 mm at T4 (non-signifi cant).
However, an increase of opening capacity was noted at T4 in 14 patients (seven in each group).
There were no signifi cant changes in the distance between RCP and ICP in either group. A value greater than 1.5 mm in the antero-posterior RCP – ICP distance at T4 was noted in one patient in the advancement group but in no patient in the setback group. Nevertheless, there were three patients in the setback group with a value of 1.5 mm at T4. On the other hand, pre-surgical high RCP – ICP distances of 5 or 4 mm were reduced to 0 mm in two patients. All patients, except one in the advancement group, had an RCP – ICP distance which was greater than 1 mm. No correlations with age and gender in either group were found. The advancement at point Pg correlated positively and signifi cantly with the magnitude of the RCP – ICP distance at T4.
Neurosensory status
At T1, all patients in the setback group could be considered to have normal sensory sensations, while in the advancement
T
able 4
Maximum movement capacity of the mandible (mm) before sur
gery (T1), 7.3/6.6 months after sur
gery (T2), 13.9/14.4 months a
fter sur
gery (T3), and 12.7 years after sur
gery
in the advancement/setback groups.
T1 T2 † ‡ T3 † ‡ T4 Changes from T1 to T3 Mean SD Range Mean SD Range Mean SD Range Mean SD Range Mean SD Range Advancement gr oup ( n = 16) Mouth-opening 51.2 6.4 38.0 to 63.0 44.3 6.3 34.0 to 55.0 − 10.1** 12.8 − 53.5 to 2.0 46.8 7.6 35.0 to 65.0 − 4.4* 5.1 − 12.0 to 9.0 Lateral movement 11.1 2.5 7.0 to 16.0 9.5 2.2 6.0 to 14.0 − 2.1* 3.0 − 10.0 to 1.0 9.7 3.2 2.0 to 16.0 − 1.4 (ns) 2.9 − 8.0 to 4.0 Protrusion 10.9 2.6 5.5 to 15.0 8.1 1.4 6.0 to 11 .0 − 3.2* 3.9 − 15.0 to 1.5 9.1 1.6 7.0 to 12.0 − 1.8 (ns) 2.5 − 6.0 to 4.5 Setback gr oup ( n = 17) Mouth-opening 50.6 9.0 35.0 to 67.0 47.8 6.4 37.0 to 62.0 − 5.6 (ns) 12.0 − 42.0 to 15.0 47.6 6.5 37.0 to 57.0 − 2.9 (ns) 5.2 − 16.0 to 5.0 Lateral movement 9.7 2.3 5.0 to 16.0 8.8 2.0 5.0 to 12.0 − 1.3 (ns) 3.4 − 12.0 to 6.0 8.9 2.4 3.0 to 14.0 − 0.8 (ns) 2.7 − 7.0 to 4.0 Protrusion 7.7 2.5 2.0 to 11.0 7.0 2.3 3.0 to 10.0 − 1.1 (ns) 3.2 − 6.0 to 8.0 7.9 2.6 4.0 to 14.0 0.2 (ns) 1.7 − 2.0 to 4.0 Signi fi cant dif
ferences were calculated together with a Bonferroni adjustment (
P / n ; n = 4): * P ≤ 0.0125, ** P ≤
0.0025, and ns, not signi
fi cant. † After 7.3 months n = 15. ‡ After 6.6 months n = 16. 30.0 35.0 40.0 45.0 50.0 55.0 60.0 65.0 T1 T2 T3 T4 Occasion
Max. mouth-opening capacity (mm)
Advancment group Setback group
Figure 1 Means and standard deviations of mouth-opening capacity before surgery (T1), and 7.3/6.6 months (T2), 13.9/14.4 months (T3), and 12.7 years (T4) after surgery for the advancement/setback groups.
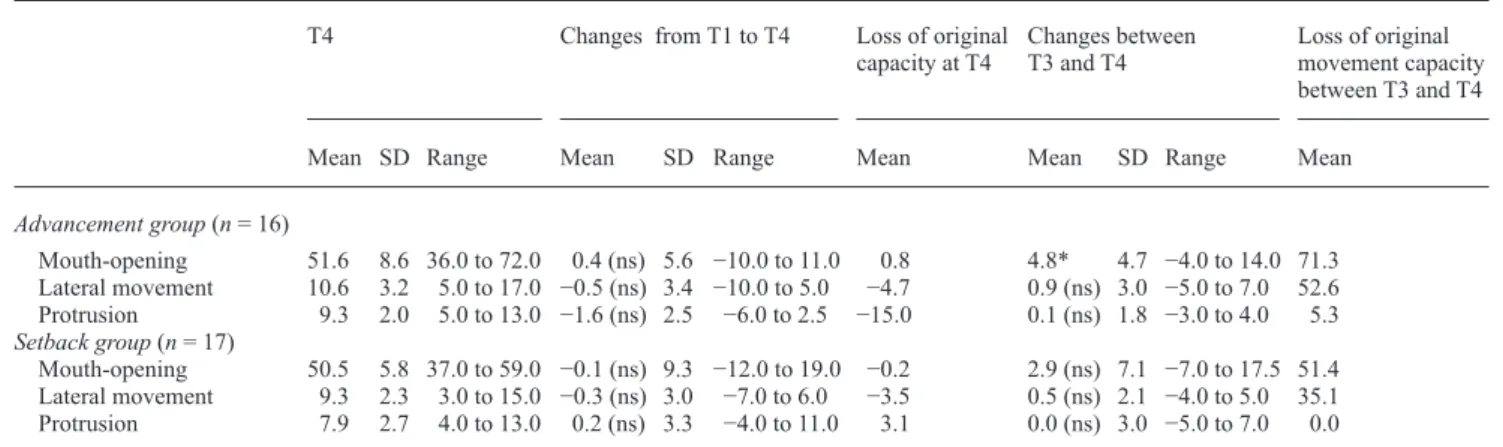
Table 5 Maximum movement capacity of the mandible (mm) before and after surgery and loss of original movement capacity (%) before surgery (T1), 7.3/6.6 months after surgery (T2), 13.9/14.4 months after surgery (T3), and 12.7 years after surgery in the advancement/ setback groups.
T4 Changes from T1 to T4 Loss of original
capacity at T4 Changes between T3 and T4 Loss of original movement capacity between T3 and T4
Mean SD Range Mean SD Range Mean Mean SD Range Mean
Advancement group ( n = 16) Mouth-opening 51.6 8.6 36.0 to 72.0 0.4 (ns) 5.6 − 10.0 to 11.0 0.8 4.8* 4.7 − 4.0 to 14.0 71.3 Lateral movement 10.6 3.2 5.0 to 17.0 − 0.5 (ns) 3.4 − 10.0 to 5.0 − 4.7 0.9 (ns) 3.0 − 5.0 to 7.0 52.6 Protrusion 9.3 2.0 5.0 to 13.0 − 1.6 (ns) 2.5 − 6.0 to 2.5 − 15.0 0.1 (ns) 1.8 − 3.0 to 4.0 5.3 Setback group ( n = 17) Mouth-opening 50.5 5.8 37.0 to 59.0 − 0.1 (ns) 9.3 − 12.0 to 19.0 − 0.2 2.9 (ns) 7.1 − 7.0 to 17.5 51.4 Lateral movement 9.3 2.3 3.0 to 15.0 − 0.3 (ns) 3.0 − 7.0 to 6.0 − 3.5 0.5 (ns) 2.1 − 4.0 to 5.0 35.1 Protrusion 7.9 2.7 4.0 to 13.0 0.2 (ns) 3.3 − 4.0 to 11.0 3.1 0.0 (ns) 3.0 − 5.0 to 7.0 0.0 Signifi cant differences were calculated together with a Bonferroni adjustment ( P / n ; n = 4): * P ≤ 0.0125. ns, not signifi cant.
group one subject had an abnormal reaction to light touch and one a reduced ability to differentiate between pointed and blunt touch.
There was a signifi cant increase ( P = 0.007) in seven patients showing reaction to light touch at T4 in the setback group ( Table 3 ), while in the advancement group six patients showed a non-signifi cant increase ( P = 0.037). There was an increase in the ability to differentiate between pointed and blunt touch in the two groups ( n = 4).
Total anaesthesia or neuralgia was not reported at any time point. At T4, paresthesia was found in fi ve and six patients in the advancement and setback groups, respectively. The most frequent complaint was the presence of paresthesia or slight hyposensitivity on one side of the lower lip or chin. A signifi cant difference between the right and left side could not be determined with any of the tests. Both sides were therefore pooled and the fi ndings are presented in Tables 6 and 7 and in Figures 2 and 3 .
The two-point discrimination (2-pd) showed a signifi cant increase ( P = 0.006) of 2.33 mm of the lip in the advancement group at T2. There was a non-signifi cant increase ( P = 0.013) of 2.35 mm in the setback group. The 2-pd of the chin was increased non-signifi cantly ( P = 0.109) by 1.83 mm in the advancement group and ( P = 0.018) by 2.44 mm in the setback group.
A normalization of 2-pd was seen at the lower lip and the chin in both groups at T3. Only the 2-pd of the lower lip was still signifi cantly increased in the setback group.
Although restoration was observed at T3, the lower lip and the chin in both groups were signifi cantly increased at T4. The 2-pd of the lower lip increased ( P = 0.000) by 2.33 mm in the advancement group and by 3.03 mm ( P = 0.001) in the setback group. The chin increased by 3.41 mm ( P = 0.005) in the advancement and by 3.88 mm ( P = 0.003) in the setback group (both signifi cant). There was
no difference in 2-pd between the two groups at any time point.
Age, gender, and advancement did not correlate with other variables in either group.
Discussion
There are numerous studies on the range of mandibular motion and neurosensory status after BSSO. However, a
0.00 1.00 2.00 3.00 4.00 5.00 6.00 7.00 8.00 9.00 10.00 T1 T2 T3 T4 Occasion 2-pd (mm) Advancement group Setback group
Figure 2 Means and standard deviations of two-point discrimination of the lips before surgery (T1), 7.3/6.6 months after surgery (T2), 13.9/14.4 months after surgery (T3), and 12.7 years after surgery in the advancement/ setback groups.
lack of long-term follow-up studies over more than 3 years is evident.
The fi ndings of the present investigation show that, in general, there are only minor negative effects on the function of the stomatognathic system after BSSO for advancement or setback surgery, which is in contrast to several studies which found an improvement ( Timmis et al. , 1986 ; Harper, 1990 ) or deterioration ( Feinerman and Piecuch, 1995 ) after BSSO. Subjectively, there was a highly signifi cant increase from 14 to 28 in the number of patients who had no diffi culties in biting. This was mostly due to an increase in the setback group. These fi ndings are in agreement with Wisth (1984) who showed that patients with mandibular prognathism had a reduced mouth-opening and reduced protrusion capacity. He concluded this to be part of the normal anatomical and functional pattern.
Almost no change was seen in the prevalence of TMJ clicking. This was consistent with the results of Magnusson et al. (1990) and Smith et al. (1992) .
A reduction in TMJ clicking does not necessarily mean functional improvement ( Zimmer, 1993 ). He conducted a clinical – axiographic study to evaluate the TMJ after BSSO and rigid internal fi xation in 10 patients. In subjects where TMJ sounds disappeared after surgery, post-operative mandibular mobility was reduced to such a degree that the point at which the acoustic symptom originated pre-operatively could no longer be attained.
In those patients, where a disc dislocation as the origin for the TMJ sound is probable, the important question would be if the disc is correctly interposed between the candyle and fossa in the post-operative situation. The present data
T
able 6
Minimum distance (mm) for two-point discrimination before sur
gery (T1), 7.3/6.6 months after sur
gery (T2), 13.9/14.4 mont
hs after sur
gery (T3), and 12.7 years after
sur
gery in the advancement/setback groups.
T1 T2 † ‡ Changes from T1 to T2 T3 Changes from T1 to T3 Mean SD Range Mean SD Range Mean SD Range Mean SD Range Mean SD Range Advancement group ( n = 16) Lip 2.5 1.2 1.0 to 7.0 4.9 3.3 1.0 to 15.0 2.0* 3.5 − 2.0 to 12.0 3.28 1.7 0.5 to 8.0 0.8 (ns) 1.7 − 2.0 to 5.0 Chin 6.8 2.9 4.0 to 13.0 8.8 4.2 2.0 to 20.0 1.8 (ns) 4.8 − 6.0 to 16.0 8.75 5.1 2.0 to 24.0 2.0 (ns) 5.4 − 6.0 to 13.0 Setback group ( n = 17) Lip 2.7 1.3 1.0 to 6.0 5.3 3.7 1.0 to 14.0 2.4 (ns) 4.0 − 3.0 to 1 1.0 4.62 2.6 1.0 to 1 1.0 2.0* 2.9 − 3.0 to 8.0 Chin 6.5 2.5 3.0 to 12.0 9.5 3.6 4.0 to 15.0 2.4 (ns) 5.2 − 8.0 to 12.0 10.12 6.3 2.0 to 30.0 3.6 (ns) 7.0 − 8.0 to 22.0 Signi fi cant dif
ferences were calculated together with a Bonferroni adjustment (
P / n ; n = 4): * P ≤ 0.0125, ** P ≤ 0.0025, and *** P ≤ 0.00025; ns, not signi fi cant. † After 7.3 months n = 15. ‡ After 6.6 months n = 16.
Means and SD of the 2-pd of the chin
0.00 2.00 4.00 6.00 8.00 10.00 12.00 14.00 16.00 18.00 T1 T2 T3 T4 Occasion 2-pd (mm) Advancement group Setback group
Figure 3 Means and standard deviations of the two-point discrimination of the chin at T1, T2, T3 and T4.
provides no evidence to confi rm that TMJ clicking occurred either because of disc repositioning or disc dislocation.
There was a significant decrease in the prevalence of headaches at T4. However, it is not considered that this can only be the result of the BSSO. Headaches are indeed a more complex phenomenon and are also caused by vasomotor and psychogenic diseases or by parafunctions, living conditions, etc. Recently, Egermark et al. (2000) showed a significant correlation between the subjective symptoms of TMJ dysfunction, clinical dysfunction according to Helkimo (1974) , bruxism, and headache.
One of the most obvious fi ndings of the present investigation was the impairment in movement capacity at T2, especially for the mandibular advancement group. While there was still a smaller decrease in movement capacity at T3, there was no decrease at all at T4. Nevertheless, high standard deviations and wide ranges in mandibular mobility were detected from T1 to T4. Such fi ndings show that while some patients benefi ted signifi cantly from treatment others did not.
If 40 mm is considered as an acceptable value for mouth-opening capacity ( Helkimo, 1974 ; Ingervall et al. , 1980 ; Storum and Bell, 1984 ; Zimmer et al. , 1991 ), two patients in the advancement group were below this level at T4. On the other hand, there was only one patient in the setback group.
Before surgery, patients undergoing advancement or setback surgery should be informed that mandibular movement capacity may be reduced as a result of surgery. In general, there will be a complete restitution within a few years. An increase of opening capacity occurred in 14
patients without special diet or physiotherapy ( Bell
et al. , 1983 ; Storum and Bell, 1986 ; Aragon and Van Sickels, 1987 ; Boyd et al. , 1991 ).
RCP – ICP distance was considered important, because a small distance after surgery is preferable. It means that the
mandibular condyles are well centred in the fossae when the teeth are in intercuspation ( Thüer et al. , 1997 ). A large RCP – ICP distance indicates that the condyles are displaced forward in the ICP, i.e. that a dual bite exists ( Egermark-Eriksson et al. , 1979 ).
All patients in the setback group had a normal RCP – ICP distance (not exceeding 1.5 mm) at T4. In the advancement group, there was only one patient with an RCP – ICP distance greater than 1.5 mm. Two patients in the setback group who originally had large RCP – ICP distances (2 mm or more) at T1 showed a normal distance at T2 which was still present at T4. These patients probably had a functional component of their Class III malocclusion.
Of all the tests used to evaluate neurosensory status, the 2-pd was the most meaningful. With the exception of the lip in the setback group, there was almost complete restoration in the two groups in 2-pd at T3. There were also signifi cant to highly signifi cant increases in 2-pd in both groups at T4. Why did an increase occur again at this time? The effect of age may have contributed to this fi nding. While the mean age at T1 was 21.4 years in the advancement and 27.5 years in the setback group, at T4 it was 34.1 and 40.2 years, respectively (range: 29.8 – 68.8 years).
The infl uence of age on 2-pd of the skin has been examined and confi rmed in several other studies ( Brill et al. , 1974a ,b; Kayahan et al. , 1976 ; Shimokata and Kuzuya, 1995 ; Sato et al. , 1999 ).
Brill et al. (1974a) examined 2-pd of the trigeminal nerve in 50 subjects between 21 and 28 years and 40 and 85 years of age. They found a highly significant increase in 2-pd in the older group. There were no differences in gender within each group. The mean 2-pd of the chin was 5.83 mm in the younger and 10.12 mm in the older group. Compared with 2-pd data of the present study, the data of Brill et al. (1974a ,b) were 10.16 mm in the advancement and 10.38 mm in the setback groups at T4. The chin showed no difference. Table 7 Minimum distance (mm) for two-point discrimination before surgery (T1), 7.3/6.6 months after surgery (T2), 13.9/14.4 months after surgery (T3), and 12.7 years after surgery in the advancement/setback groups.
T4 Changes from T1 to T4 Changes from T3 to T4
Mean SD Range Mean SD Range Mean SD Range
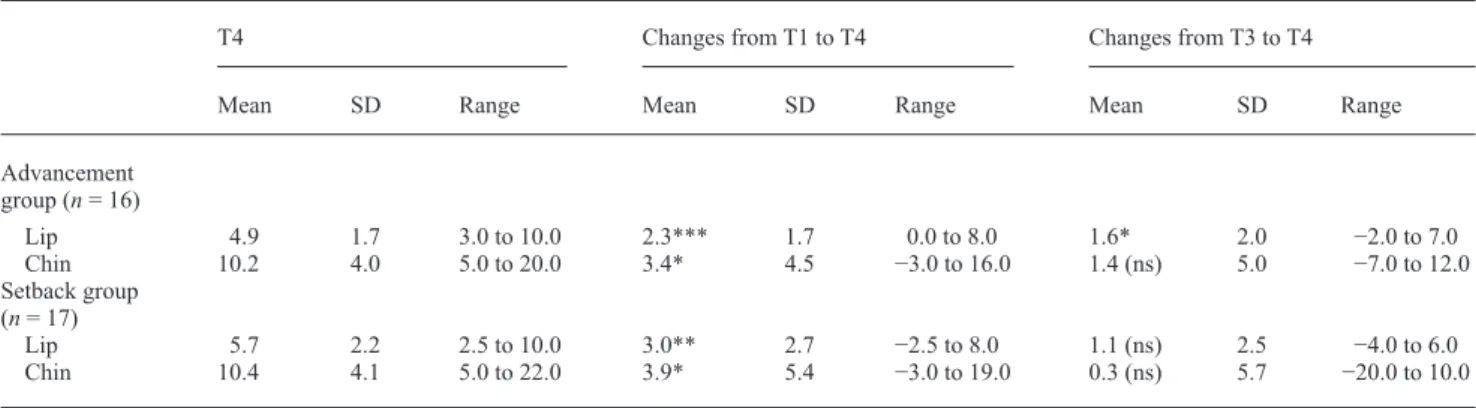
Advancement group ( n = 16) Lip 4.9 1.7 3.0 to 10.0 2.3*** 1.7 0.0 to 8.0 1.6* 2.0 − 2.0 to 7.0 Chin 10.2 4.0 5.0 to 20.0 3.4* 4.5 − 3.0 to 16.0 1.4 (ns) 5.0 − 7.0 to 12.0 Setback group ( n = 17) Lip 5.7 2.2 2.5 to 10.0 3.0** 2.7 − 2.5 to 8.0 1.1 (ns) 2.5 − 4.0 to 6.0 Chin 10.4 4.1 5.0 to 22.0 3.9* 5.4 − 3.0 to 19.0 0.3 (ns) 5.7 − 20.0 to 10.0 SD, standard deviation; ns, not signifi cant.
The values can therefore be regarded as normal. Schultze-Mosgau et al. (2001) reported 2-pd values of 13.9/14.4 months after surgery, a little higher than 4 mm at the chin and 5 mm at the lip after 12 months. However, the values at T1 in the present study were also somewhat higher. Unfortunately, 2-pd values have not been published in numerous studies.
If present, the neurological changes were mild. The infl uence of a BSSO on function of the inferior alveolar nerve is not problematic. Nevertheless, there were several patients who still complained of paresthesia in the chin region at T4. Total anaesthesia or neuralgia was not present at any time point.
Conclusions
This study evaluated the long-term effects on the craniomandibular function and neurosensory status of patients with BSSO with rigid internal fi xation for mandibular advancement or setback. The results suggest that craniomandibular function shows mostly restitution 12.7 years after surgery.
The initial post-surgical neurosensory impairment was barely detectable 1 year after surgery. The neurosensory defi cit 12.7 years after surgery was probably due to the normal human process of ageing, and the 2-pd was comparable with control subjects of the same age.
Dysfunctions such as TMJ clicking, bruxism, and pain in the TMJ and muscles are neither increased nor decreased after BSSO. On the contrary, they are the same as in a normal population.
Address for correspondence
Dr Christof Joss Faculté de médecine
Section de médecine dentaire Rue Barthélémy-Menn 19 CH-1205 Genève
Switzerland
E-mail: [email protected]
Acknowledgement
The authors would like to thank Michael Vock, Department of Statistics, University of Bern, for his kind help with the statistical analysis.
References
Aragon S B , Van Sickels J E 1987 Mandibular range of motion with rigid/nonrigid fi xation. Oral Surgery, Oral Medicine . Oral Pathology 63 : 408 – 411
Aragon S B , Van Sickels J E , Dolwick F M , Flanary C M 1985 The effects of orthognathic surgery on mandibular range of motion . Journal of Oral and Maxillofacial Surgery 43 : 938 – 943
Bell W H , Gonyea W , Finn R A , Storum K A , Johnston C , Throckmorton G S 1983 Muscular rehabilitation after orthognathic surgery. Oral Surgery, Oral Medicine . Oral Pathology 56 : 229 – 235
Boyd S B , Karas N D , Sinn D P 1991 Recovery of mandibular mobility following orthognathic surgery . Journal of Oral and Maxillofacial Surgery 49 : 924 – 931
Brill N , Tryde G , Morgan G , Rees D A 1974a Age changes in the two-point discrimination threshold in skin innervated by the trigeminal nerve . Journal of Oral Rehabilitation 1 : 149 – 157
Brill N , Tryde G , Edwards C , Thomas H 1974b Age changes in the two-point discrimination threshold in human oral mucosa . Journal of Oral Rehabilitation 1 : 323 – 333
Chen N , Neal C E , Lingenbrink P , Bloomquist D , Kiyak H A 1999 Neursensory changes following orthognathic surgery . International Journal of Adult Orthodontics and Orthognathic Surgery 14 : 259 – 267 Dal Pont G 1961 Retromolar osteotomy for the correction of prognathism .
Journal of Oral Surgery 19 : 42 – 47
Egermark I , Blomqvist J E , Cromvik U , Isaksson S 2000 Temporomandibular dysfunction in patients treated with orthodontics in combination with orthognathic surgery . European Journal of Orthodontics 22 : 537 – 544 Egermark-Eriksson I , Carlsson G E , Ingervall B 1979 Function and
dysfunction of the masticatory system in individuals with dual bite . European Journal of Orthodontics 1 : 107 – 117
Feinerman D M , Piecuch J F 1995 Long-term effects of orthognathic surgery on the temporomandibular joint: comparison of rigid and nonrigid fi xation methods . International Journal of Oral and Maxillofacial Surgery 24 : 268 – 272
Harper R P 1990 Analysis of temporomandibular joint function after orthognathic surgery using condylar path tracings . American Journal of Orthodontics and Dentofacial Orthopedics 97 : 480 – 488
Helkimo M 1974 Studies on function and dysfunction of the masticatory system. II. Index for anamnestic and clinical dysfunction and occlusal state . Swedish Dental Journal 67 : 101 – 121
Helkimo M , Ingervall B , Carlsson G E 1973 Comparison of different methods in active and passive recording of the retruded position of the mandible . Scandinavian Journal of Dental Research 81 : 265 – 271 Hunsuck E E 1968 A modifi ed intraoral sagittal splitting technique for
correction of mandibular prognathism . Journal of Oral Surgery 26 : 250 – 253
Ingervall B , Ridell A , Thilander B 1979 Changes in activity of the temporal, masseter and lip muscles after surgical correction of mandibular prognathism . International Journal of Oral Surgery 8 : 290 – 300
Ingervall B , Mohlin B , Thilander B 1980 Prevalence of symptoms of functional disturbances of the masticatory system in Swedish men . Journal of Oral Rehabilitation 7 : 185 – 197
Ingervall B , Thüer U , Vuillemin T 1995 Stability and effect on the soft tissue profi le of mandibular setback with sagittal split osteotomy and rigid internal fi xation . International Journal of Adult Orthodontics and Orthognathic Surgery 10 : 15 – 25
Jones D L , Wolford L M , Hartog J M 1990 Comparison of methods to assess neurosensory alterations following orthognathic surgery . International Journal of Adult Orthodontics and Orthognathic Surgery 5 : 35 – 42 Kayahan S , Tezcan V , Sukyasyan A , Demiroglu C 1976 Two point
discrimination and ageing . New Istanbul Contribution to Clinical Science 11 : 148 – 154
Kerstens H C J , Tuinzing D B , van der Kwast W A M 1989 Temporomandibular joint symptoms in orthognathic surgery . Journal of Cranio-Maxillofacial Surgery 17 : 215 – 218
Magnusson T , Ahlborg G , Svartz K 1990 Function of the masticatory system in 20 patients with mandibular hypo- or hyperplasia after correction by a sagittal split osteotomy . International Journal of Oral and Maxillofacial Surgery 19 : 289 – 293
O’Ryan F , Epker B N 1983 Surgical orthodontics and the temporomandibular joint. II. Mandibular advancement via modifi ed sagittal split ramus osteotomies . American Journal of Orthodontics 83 : 418 – 427
Pepersack W J , Chausse J M 1978 Long term follow-up of the sagittal splitting technique for correction of mandibular prognathism . Journal of Maxillofacial Surgery 6 : 117 – 140
Raveh J , Vuillemin T , Lädrach K , Sutter F 1988 New techniques for reproduction of the condyle relation and reduction of complications after sagittal ramus split osteotomy of the mandible . Journal of Oral and Maxillofacial Surgery 46 : 751 – 757
Sato T , Okada Y , Miyamoto T , Fujiyama R 1999 Distributions of sensory spots in the hand and two-point discrimination thresholds in the hand, face and mouth in dental students . Journal of Physiology-Paris 93 : 245 – 250
Schultze-Mosgau S , Krems H , Ott R , Neukam F W 2001 A prospective electromyographic and computer-aided thermal sensitivity assessment of nerve lesions after sagittal split osteotomy and Le Fort I osteotomy . Journal of Oral and Maxillofacial Surgery 59 : 128 – 139
Shimokata H , Kuzuya F 1995 Two-point discrimination test of the skin as an index of sensory aging . Gerontology 41 : 267 – 272
Smith V , Williams B , Stapleford R 1992 Rigid internal fi xation and the effects on the temporomandibular joint and masticatory system: a prospective study . American Journal of Orthodontics and Dentofacial Orthopedics 102 : 491 – 500
Spiessl B 1976 Rigid internal fi xation after sagittal split osteotomy of the ascending ramus. Springer Verlag , New York
Storum K A , Bell W H 1984 Hypomobility after maxillary and mandibular osteotomies . Journal of Oral Surgery 57 : 7 – 12
Storum K A , Bell W H 1986 The effect of physical rehabilitation on mandibular function after ramus osteotomies . Journal of Oral and Maxillofacial Surgery 44 : 94 – 99
Thüer U , Ingervall B , Vuillemin T 1994 Stability and effect on the soft tissue profi le of mandibular advancement with sagittal split osteotomy and rigid internal fi xation . International Journal of Adult Orthodontics and Orthognathic Surgery 9 : 175 – 185
Thüer U , Ingervall B , Vuillemin T 1997 Functional and sensory impairment after sagittal split osteotomies . International Journal of Adult Orthodontics and Orthognathic Surgery 12 : 263 – 272
Timmis D P , Aragon S B , Van Sickels J E 1986 Masticatory dysfunction with rigid and nonrigid osteosynthesis of sagittal split osteotomies. Oral Surgery, Oral Medicine . Oral Pathology 62 : 119 – 123
Trauner R , Obwegeser H 1955 Zur Operationstechnik bei der Progenie und anderen Unterkieferanomalien . Deutsche Zahn-, Mund-, und Kieferheilkunde 23 : 1 – 26
Wisth P J 1984 Mandibular function and dysfunction in patients with mandibular prognathism . American Journal of Orthodontics 85 : 193 – 198
Zimmer B 1993 Correlations between the loss of acoustic TMJ symptoms and alterations in mandibular mobility after surgical mandibular advancement . European Journal of Orthodontics 15 : 229 – 234
Zimmer B , Engelke D , Radlanski R J , Kubein-Meesenburg D 1991 Veränderungen der Öffnungsmobilität durch die chirurgische Unterkiefervorverlagerung . Fortschritte der Kieferorthopädie 52 : 78 – 83