HAL Id: hal-00297769
https://hal.archives-ouvertes.fr/hal-00297769
Submitted on 4 Jul 2005HAL is a multi-disciplinary open access
archive for the deposit and dissemination of sci-entific research documents, whether they are pub-lished or not. The documents may come from teaching and research institutions in France or abroad, or from public or private research centers.
L’archive ouverte pluridisciplinaire HAL, est destinée au dépôt et à la diffusion de documents scientifiques de niveau recherche, publiés ou non, émanant des établissements d’enseignement et de recherche français ou étrangers, des laboratoires publics ou privés.
Variability of the surface water partial pressure of CO2
in the North Sea
H. Thomas, Yves Bozec, K. Elkalay, H. J. W. de Baar, A. V. Borges, L.-S.
Schiettecatte
To cite this version:
H. Thomas, Yves Bozec, K. Elkalay, H. J. W. de Baar, A. V. Borges, et al.. Variability of the surface water partial pressure of CO2 in the North Sea. Biogeosciences Discussions, European Geosciences Union, 2005, 2 (4), pp.757-777. �hal-00297769�
BGD
2, 757–777, 2005
pCO2 in the North Sea H. Thomas et al. Title Page Abstract Introduction Conclusions References Tables Figures J I J I Back Close
Full Screen / Esc
Print Version Interactive Discussion EGU Biogeosciences Discussions, 2, 757–777, 2005 www.biogeosciences.net/bgd/2/757/ SRef-ID: 1810-6285/bgd/2005-2-757 European Geosciences Union
Biogeosciences Discussions
Biogeosciences Discussions is the access reviewed discussion forum of Biogeosciences
Variability of the surface water partial
pressure of CO
2
in the North Sea
H. Thomas1, Y. Bozec2, K. Elkalay2, H. J. W. de Baar2, A. V. Borges3, and L.-S. Schiettecatte3
1
Canada Research Chair, Dalhousie University, Department of Oceanography, 1355 Oxford Street, Halifax, Nova Scotia, Canada
2
Royal Netherlands Institute for Sea Research (NIOZ), Department of Carbon Chemistry, P.O. Box 59, Den Burg, Texel, The Netherlands
3
University of Li `ege, Interfacultary Center for Marine Research (MARE), Chemical Oceanography Unit, B-4000 SartTilman, Belgium
Received: 30 May 2005 – Accepted: 11 June 2005 – Published: 4 July 2005 Correspondence to: H. Thomas ([email protected])
BGD
2, 757–777, 2005
pCO2 in the North Sea H. Thomas et al. Title Page Abstract Introduction Conclusions References Tables Figures J I J I Back Close
Full Screen / Esc
Print Version Interactive Discussion
EGU Abstract
The seasonal variability of the partial pressure of CO2(pCO2) has been investigated in the North Sea, a northwest European shelf sea. Based on a seasonal, high resolution data set the main controlling factors – biological processes and temperature - have been identified and quantified. In the central and northern parts being a CO2-sink all 5
year round, the biological control dominates the temperature control. In the southern part, the temperature control dominates the biological control at an annual scale, since the shallow water column prevents stronger net-CO2 removal from the surface layer due to the absence of seasonal stratification. The consequence is a reversal of the CO2 sea-to-air flux during the spring bloom period, the only time, when CO2is taken 10
up from the atmosphere in the southern region. Net community production in the mixed layer has been estimated to 4 mol C m−2yr−1with higher values (4.3 mol C m−2yr−1) in the northern part and lower values in the southern part (2.6 mol C m−2yr−1).
1. Introduction
During the recent years many research efforts have been devoted to the understanding 15
and quantification of the ocean carbon cycle, which plays a key role in the global carbon cycle and thus in controlling climate on earth (IPCC, 2001). The world ocean and the atmosphere have been identified as the major sinks for anthropogenic CO2, while the role of the terrestrial biosphere remains uncertain (IPCC, 2001; Sarmiento and Gruber, 2002). Part of this uncertainty can be attributed to the uncertainty in the assessment of 20
the ocean sink for anthropogenic CO2. Recent studies however seem to suggest that the ocean and the atmosphere entirely share the storage of the anthropogenic CO2, while the terrestrial biosphere seems to play a neutral role (Thomas et al., 2001; Sabine et al., 2004). Sabine et al. (2004) relied their observational approach on a global data set, obtained in the framework of large national and international research efforts 25
BGD
2, 757–777, 2005
pCO2 in the North Sea H. Thomas et al. Title Page Abstract Introduction Conclusions References Tables Figures J I J I Back Close
Full Screen / Esc
Print Version Interactive Discussion
EGU
the Joint Global Ocean Flux Study (JGOFS). Complementarily to this refinement of the open ocean assessment intense research campaigns have been initiated during the last years in the coastal oceans, of which carbon cycle was investigated only barely before. Carbon fluxes have been investigated in several coastal regions (Liu et al., 2000a; Liu et al., 2000b; Chen et al., 2003). In order to achieve an integrative global 5
assessment, the available information yet appears to be too sparse and more site studies are required (Borges, 2005).
Coastal and marginal seas host a disproportionately large fraction of ocean produc-tivity, in part fueled by terrestrial, anthropogenic or oceanic nutrient inputs. Coastal seas constitute the major link between the terrestrial and the open ocean environ-10
ments and buffer terrestrial impacts before affecting the oceanic systems. The high biological activity causes high CO2fluxes between coastal ocean and atmosphere and the open ocean, respectively. Depending on the hydrodynamic and topographic condi-tions the biologically initiated CO2-drawdown might finally supply the continental shelf pump (Tsunogai et al., 1999), a mechanism transferring atmospheric CO2into the open 15
ocean exploiting biological metabolism of coastal seas. For example, the continental shelf pump seems to be very efficient in the East China Sea (Tsunogai et al., 1999) or the North Sea (Thomas et al., 2004), while in the Baltic Sea it works less efficiently (Thomas et al., 2003; 2005).
The North Sea has been subject to intense investigations for the last decades and 20
the foundation for carbon cycle investigations here was probably laid in the late 1980s by a basin-wide study (Pegler and Kempe, 1988; Kempe and Pegler, 1991). A variety of rather regional or local studies have been conducted in the following years (Frankig-noulle et al., 1996; Borges and Frankig(Frankig-noulle, 1999, 2002, 2003; Frankig(Frankig-noulle and Borges, 2001) most notably enabling insight in near shore carbon and CO2 fluxes. 25
Recently a basin-wide field study has been carried out focusing on the understanding and quantification of internal and cross-boundary carbon (and related nutrient) fluxes in the North Sea. First investigations balanced the CO2air-sea fluxes, investigated the functioning of the continental shelf pump at a seasonal scale (Thomas et al., 2004;
BGD
2, 757–777, 2005
pCO2 in the North Sea H. Thomas et al. Title Page Abstract Introduction Conclusions References Tables Figures J I J I Back Close
Full Screen / Esc
Print Version Interactive Discussion
EGU
Bozec et al., 2005) or reported on an initial 1-box carbon budget (Thomas et al., 2005). The North Sea has been shown to act as a sink for atmospheric CO2, most of which is exported to the North Atlantic Ocean. In detail, the smaller southern part releases CO2 to the atmosphere (−0.2 mol C m−2yr−1), while the northern areas absorb CO2 (1.7 mol C m−2yr−1).
5
Here, we investigate the variability of the partial pressure of CO2 (pCO2) in detail, which governs the CO2air-sea fluxes. Temperature effects will be unraveled from the biological processes controlling the pCO2 applying the approach proposed by Taka-hashi et al. (2002). The consequences for the seasonal variability of the CO2air-sea fluxes are discussed. Finally, an estimate of the corresponding biological CO2 draw-10
down, which is a measure for net community production (NCP), will be provided.
2. Material and methods
2.1. Data
The data have been obtained during 4 cruises in the North Sea onboard R.V. Pela-gia covering all seasons in a consecutive order (18.8.2001–13.9.2001, 6.1.2001– 15
29.11.2001, 11.2.2002–5.3.2002 and 6.5.2002–26.5.2002). The pCO2 has been de-termined continuously in one-minute intervals from the surface waters using a contin-uous flow system as described by K ¨ortzinger et al. (1996). The water was pumped from approximately 3m below the sea surface at a rate of 60 L min−1. The main wa-ter flow through the equilibrator was 2–3 L min−1 and the difference between in-situ 20
and equilibrator temperature was typically less than 0.5◦C. The atmospheric pCO2has been determined every 2 h and the system was calibrated against standards provided by the National Oceanic and Atmospheric Administration (NOAA). Temperature and salinity have been determined continuously from the surface water in one-minute inter-vals. From 97 stations per cruise, dissolved inorganic carbon (DIC) and total alkalin-25
BGD
2, 757–777, 2005
pCO2 in the North Sea H. Thomas et al. Title Page Abstract Introduction Conclusions References Tables Figures J I J I Back Close
Full Screen / Esc
Print Version Interactive Discussion
EGU
al. (1993) and a Gran potentiometric open cell titration, respectively. The DIC measure-ments were calibrated against certified reference material provided by Prof. Dickson, Scripps Institution of Oceanography, La Jolla, CA, USA. The uncertainty of the DIC is 1–2 µmol kg−1. The uncertainty of ATwas determined to 2–3 µmol kg−1.
2.2. Calculations 5
2.2.1. Temperature vs. biological control
In order to identify and quantify the main factors controlling the variability of pCO2in the North Sea, we applied the calculation scheme proposed by Takahashi et al. (2002). Ac-cordingly, the temperature and biological signals can be unraveled using the observed pCO2 and temperature data. In brief, the temperature effect can be removed by nor-10
malizing all pCO2data to an average temperature for all seasons:
pCO2 at Tmean=pCO2 at Tobs∗ exp[0.0423(Tmean−Tobs)], (1) where Tmean is the mean annual temperature and Tobs is the in-situ temperature at the time and location of the observation. The remaining variability of the pCO2is then controlled by the variations of DIC, assuming a constant AT. The temperature signal 15
can be obtained from the average annual pCO2and the difference between Tobs and Tmean:
pCO2 at Tobs=annual meanpCO2∗ exp[0.0423(Tobs−Tmean)]. (2)
The changes in the pCO2related to biological (∆pCO2,bio) and to temperature changes (∆pCO2,temp) effects, respectively, follow then as:
20
∆pCO2,bio=(pCO2 at Tmean)max−(pCO2 at Tmean)min, (3)
∆pCO2,temp=(pCO2at Tobs)max−(pCO2 at Tobs)min, (4)
BGD
2, 757–777, 2005
pCO2 in the North Sea H. Thomas et al. Title Page Abstract Introduction Conclusions References Tables Figures J I J I Back Close
Full Screen / Esc
Print Version Interactive Discussion
EGU
In order to compare the magnitude of both temperature (T) and biological effects (B) either the ratio or the difference of the expressions ∆pCO2,bio and∆pCO2,temp can be applied:
T−B=(∆pCO2,temp)−(∆pCO2,bio) (5a)
T/B=(∆pCO2,temp)/(∆pCO2,bio) (5b)
5
In areas with high seasonal variability of the biological activity the ratio (T/B) would be smaller than 1 or the difference (T–B) negative. In regions with weaker or annually rather constant biology, the (T/B) ratio would be greater than one or the difference positive, respectively.
2.2.2. Biological DIC uptake (net community production) 10
The above∆pCO2,bio can be employed for the determination of the biological DIC up-take, i.e., the Net Community Production (NCP). Recently a procedure has been im-plemented to calculate any change in DIC as a function of a change in the pCO2and temperature and salinity (Thomas and Ittekkot, 2001; Thomas et al., 2001). This pro-cedure, originally proposed for the determination of anthropogenic CO2 in the water 15
column, is applied for the present purposes to obtain the biological DIC drawdown (∆DICbio) as a function of∆pCO2,bio, salinity (S) and temperature (T , in◦C):
∆DICbio=−199.6 + 0.89 ∗ S + 0.42 ∗ T + 0.6 ∗ (∆pCO2,bio+ 276.8) (6)
For the calculations, an average salinity of 34 was assumed. In order to assess the cor-responding NCP, an average depth of the mixed layer of 30m was assumed.∆pCO2,bio 20
is obtained as the difference between the maximum and minimum pCO2at the annual mean temperature (3). The corresponding∆DICbio(6) allows deriving NCP during the productive period February to August.
BGD
2, 757–777, 2005
pCO2 in the North Sea H. Thomas et al. Title Page Abstract Introduction Conclusions References Tables Figures J I J I Back Close
Full Screen / Esc
Print Version Interactive Discussion
EGU 3. Results and discussion
3.1. Surface properties
The surface water properties of the North Sea (Fig. 1) during winter show a relatively homogenous behavior. The pCO2 versus temperature relationship (Fig. 1a) reveals pCO2 values between 360 µatm and 400 µatm throughout the entire North Sea. The 5
temperatures range between 5◦C and 10◦C with slightly higher temperatures in the southern region of the North Sea. AT(Fig. 1b, c) shows homogenous behavior through-out the full annual cycle and only minor changes can be identified during spring, most likely as a consequence of fresh water inputs. In contrast, DIC shows a clear seasonal signal with highest values in winter and lowest values in summer (Fig. 1c, d). It is ob-10
vious that DIC undergoes much more severe seasonal variations than AT. Clearly, the maximum DIC draw-down is observed in summer, this in contrast to pCO2that shows minimal values during spring (Fig. 1a, d). The most pronounced seasonal and also regional signals can be observed in the pCO2distributions with highest values during summer in the southern region (Fig. 1a, d) and lowest values in May throughout the 15
North Sea. During all seasons the southern region shows higher pCO2values than the northern and central parts, and in summer opposing directions of the CO2air-sea flux are observed.
3.2. Biological versus temperature controls
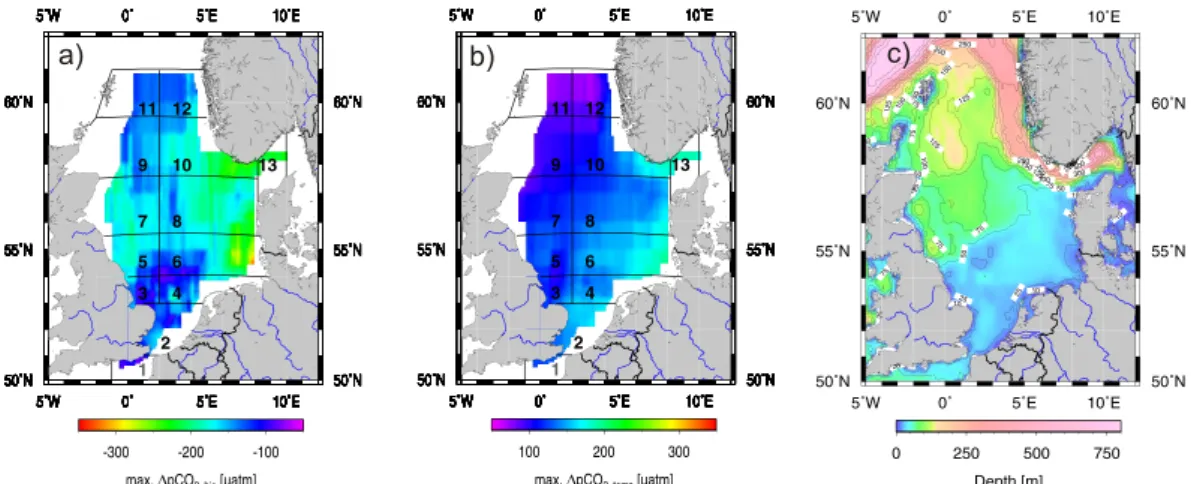
The maximum values up to 330 µatm of the biologically induced pCO2 changes 20
(∆pCO2,bio) are observed in the northern and central parts of the North Sea (Fig. 2a). Weaker effects are observed in the southern part, because the shallow (Fig. 2c), well mixed water column does not allow the spatial separation of organic carbon production in the surface waters from the degradation of organic carbon in the bottom waters that occurs in the stratified northern and central regions. The North-Sea-wide average bio-25
BGD
2, 757–777, 2005
pCO2 in the North Sea H. Thomas et al. Title Page Abstract Introduction Conclusions References Tables Figures J I J I Back Close
Full Screen / Esc
Print Version Interactive Discussion
EGU
as a highly productive area. This value is within the range observed in open oceanic waters from 50 µatm in the oligotrophic areas of the subtropics and tropics to 280 µatm in the highly productive upwelling regions of the Eastern equatorial Pacific (Takahashi et al., 2002). Temperature (Fig. 2b) shows a stronger control on pCO2in the southern and coastal, i.e., shallower regions. The shallow water column warms up faster and 5
furthermore is not affected by the continuous inputs of large quantities of colder water from the North Atlantic Ocean (Thomas et al., 2005). Temperature increases the pCO2 in the northern region by approximately 100 µatm, while in the south an increase of 200 µatm can be observed. The basin-wide maximum is approximately 200 µatm with an average of 130 µatm. This value is above the average of 80 µatm observed in the 10
open ocean at mid-latitudes, where maximum values of 220 µatm are only observed in the confluence areas of the warm Kuroshio with the cold Oyashio current waters in the northwestern Pacific and of the warm Gulf Stream with the cold Labrador Current waters in the northwestern Atlantic (Takahashi et al., 2002).
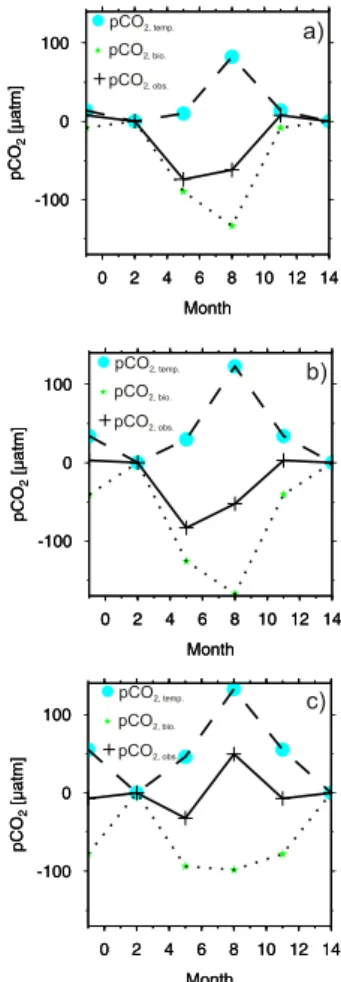
A more detailed analysis allows identifying and quantifying the relevant regional fea-15
tures characterizing the CO2system in the North Sea. Three key areas are discussed: the deeper northern part of the North Sea (Fig. 3a), the central part (Fig. 3b), which still is stratified during summer, and the shallow continuously mixed southern part (Fig. 3c). The northern region (Fig. 3a) shows the weakest temperature control, which is out competed by the biological CO2draw-down: 60 µatm vs. −150 µatm, respectively. The 20
annual cycle reveals lowest values in spring and summer, as expected for a high lat-itude sea. The opposite situation is found for the southern region, where the overall system appears to be temperature controlled with an observed pCO2maximum in sum-mer (pCO2,temp up to 135 µatm, pCO2,bio max: −100 µatm). Only during a very short period in spring the biological control dominates and causes a net reduction of the 25
∆pCO2compared to the winter values. The highest seasonal∆pCO2 amplitude in the
North Sea, observed in the central region, is generated by a synergistic coincidence of somewhat a lower temperature control compared to the southern region and of the presence of a thermocline, which enables the remineralization of the freshly produced
BGD
2, 757–777, 2005
pCO2 in the North Sea H. Thomas et al. Title Page Abstract Introduction Conclusions References Tables Figures J I J I Back Close
Full Screen / Esc
Print Version Interactive Discussion
EGU
and sunken organic matter below the surface layer. In the central region, the more rapid temperature rise during spring induces an earlier establishment of the thermocline and thus a longer export of the newly produced organic matter out of the surface layer lead-ing to a higher biological signal compared to the northern region. The consequence is that the biological control is highest in the central region, while it is somewhat weaker 5
in the northern areas, since the export of organic matter out of the surface layer is reduced compared to the central part because of the later onset of primary production and of the later rise of the thermocline. The stratification prevents the remineralization of the organic matter in the surface layer, which is the primary condition for the de-velopment of the biological net CO2 drawdown over the entire productive period. This 10
contrasted behavior is clearly visible by the summer maxima of∆pCO2,bio in the north-ern and central region, since the stratification maintains the “accumulation” of the CO2 drawdown until production deceases in later summer. In contrast, the absence of strati-fication in the south prevents this “accumulation”, showing the strongest∆pCO2,bioonly at its peak period during the bloom as compared to the other regions with the strongest 15
∆pCO2,bio at the accumulated maximum of the drawdown in late summer.
The consequences of the different controls on the CO2 air-sea fluxes become evi-dent, when considering the seasonally resolved fluxes (Fig. 4). During winter (Fig. 4a) the North Sea appears to be a rather equilibrated system with regard to the CO2fluxes. With the onset of the spring bloom, all areas act as sinks for atmospheric CO2, even 20
the shallower southern part, where the biological control out competes the tempera-ture control as indicated in Fig. 3c. In summer, the central and northern parts continue absorbing CO2from the atmosphere, but the increasing temperature and the remineral-ization of organic matter cause a flux reversal in the southern part that then emits CO2 to the atmosphere. In autumn, primary production deceases in the North Sea enhanc-25
ing the CO2 release in the southern area; the northern area remains undersaturated, since the organic matter has been remineralized in bottom waters that are advected to the North Atlantic Ocean (Thomas et al., 2004). The decreasing temperatures (Fig. 3a, b) and the weaker return of DIC into the surface layer due to destratification maintain
BGD
2, 757–777, 2005
pCO2 in the North Sea H. Thomas et al. Title Page Abstract Introduction Conclusions References Tables Figures J I J I Back Close
Full Screen / Esc
Print Version Interactive Discussion
EGU
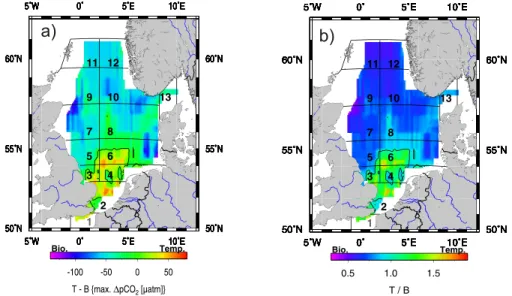
the absorption of atmospheric CO2.
At an annual scale, the ratio between the maximum effects of temperature and bi-ological activity or the respective difference indicate, which of the two processes is dominant (Fig. 5a, b). The southern part is clearly dominated by the temperature ef-fects with an increase of pCO2in summer, while the northern part is clearly dominated 5
by the biological processes with a summer decrease of pCO2typical for mid and high latitude waters.
3.3. Net community production
NCP in the mixed layer (Fig. 6, Table 1) amounts to 2.9 mol C m−2 from February to August with higher values in the northern areas than in the southern area. Since the 10
air-sea exchange of CO2 also alters pCO2 values next to the temperature and biolog-ical effects, the CO2 uptake by the North Sea during the productive period needs to be considered. The CO2 air-sea fluxes for the period from February to August have been taken from Thomas et al. (2004) in order to establish a corrected term for NCP (NCPcorr). NCPcorr in the mixed layer amounts to 4 mol C m−2 in the whole North Sea 15
during the productive period, with values of 4.3 mol C m−2 in the northern area and 2.6 mol C m−2 in the southern area, respectively. Although it is generally assumed that the southern North Sea reveals higher gross primary productivity, net community pro-duction is lower here than in the central and northern areas because of the competing gross primary production and community respiration in the annually well mixed water 20
column of the south.
4. Discussion and summary
Based on pCO2observations with high spatial and seasonal resolution, the approach by Takahashi et al. (2002) has been applied to evaluate temperature and biological processes governing the variability of pCO2in the North Sea. The analysis is focused 25
BGD
2, 757–777, 2005
pCO2 in the North Sea H. Thomas et al. Title Page Abstract Introduction Conclusions References Tables Figures J I J I Back Close
Full Screen / Esc
Print Version Interactive Discussion
EGU
on temperature and biology as the major processes controlling pCO2 in surface wa-ters. The northern area shows a typical mid to high latitude behavior characterized by the strong seasonality of the biological processes. The southern part is a rather temperature controlled system, where biological net effects are vanished through near balanced production and respiration processes in the one-layered compartment. The 5
highest seasonal amplitude of the pCO2 is observed in the central part as a conse-quence of early stratification and high biological activity. The North Sea reveals a high NCP with higher values for the northern and central parts.
Obviously, further processes such as inputs from rivers or the Baltic Sea, and ad-vection of water masses are partly responsible for the variability of the pCO2. These 10
processes have been investigated for example by Thomas et al. (2005) and Bozec et al. (2005), however their consideration requires further information, mainly on the hydrodynamics. We have chosen here to apply the rather straight forward approach of Takahashi et al. (2002), which considers rather static snapshots of the North Sea. Obviously, above processes, which have been ignored here, contribute to the variabil-15
ity of pCO2, notably for near coast and the southern areas. The ignorance of these processes points to the limits of our approach. These considerations also hold true for the assessment of the NCP, which might be seen as a lower bound, since additional carbon sources besides the atmosphere (e.g. rivers) have not been taken into account. Accounting for additional carbon sources would potentially lead to a somewhat higher 20
estimate of NCP. However, the good agreement with a sophisticated DIC mass bal-ance by Bozec et al. (20051) shows that our straightforward approach does have the potential to reliably assess NCP and to identify and to unravel the major controlling processes of the CO2system.
1
Bozec, Y., Thomas, H., Schiettecatte, L.-S., Borges, A. V., Elkalay, K., and de Baar, H.: Assessment of the processes controlling the seasonal variations of dissolved inorganic carbon in the North Sea, Limnology and Oceanography, submitted, 2005.
BGD
2, 757–777, 2005
pCO2 in the North Sea H. Thomas et al. Title Page Abstract Introduction Conclusions References Tables Figures J I J I Back Close
Full Screen / Esc
Print Version Interactive Discussion
EGU Acknowledgements. The excellent co-operation of the captains and the crews of “RV Pelagia”
is gratefully acknowledged. This study has been encouraged by and contributes to the LOICZ core project of the IGBP and to CARBOOCEAN, an integrated project of the European Union (contract no. 511176-2). It has been supported by the Netherlands Organization for Scien-tific Research (Grants no. 810.33.004, 014.27.001), the Dutch-German bilateral co-operation
5
NEBROC, the Belgium Science Policy (CANOPY, EV/03/20) and the European Union (EU-ROTROPH , EVK3-CT-2000-00040).
References
Borges, A. V.: Do we have enough pieces of the jigsaw to integrate CO2fluxes in the coastal ocean?, Estuaries, 28(1), 3–27, 2005.
10
Borges, A. V. and Frankignoulle, M.: Distribution of surface carbon dioxide and air-sea exchange in the English Channel and adjacent areas, J. Geophys. Res., 198 (C5), doi:10.1029/JC000571, 1–14, 2003.
Borges, A. V. and Frankignoulle, M.: Distribution and air-water exchange of carbon dioxide in the Scheldt plume off the Belgian coast, Biogeochem., 59(1–2), 41–67, 2002.
15
Borges, A. V. and Frankignoulle, M.: Daily and seasonal variations of the partial pressure of CO2in surface seawater along Belgian and southern Dutch coastal areas, J. Mar. Syst., 19, 251–266, 1999.
Bozec, Y., Thomas, H., Elkalay, K., and De Baar, H.: The continental shelf pump in the North Sea - evidence from summer observations, Mar. Chem., 93, 131–147, 2005.
20
Chen, C.-A., Liu, K.-K., and MacDonald, R.: Continental margin exchanges, in: Ocean Biogeo-chemistry: A JGOFS synthesis, edited by: Fasham, M. J. R., Springer, 53–97, 2003.
Frankignoulle, M. and Borges, A. V.: European continental shelf as a significant sink for atmo-spheric carbon dioxide, Global Biogeochem. Cycles, 15(3), 569–576, 2001.
Frankignoulle, M., Bourge, I., Canon, C., and Dauby, P.: Distribution of surface seawater partial
25
CO2pressure in the English Channel and in the Southern Bight of the North Sea, Cont. Shelf Res., 16(3), 381–395, 1996.
IPCC: The scientific basis, in: Contribution of Working Group I to the Third Assessment Report of the Intergovernmental Panel on Climate Change, edited by: Johnson, C.A., Cambirdge University Press, New York, 2001.
BGD
2, 757–777, 2005
pCO2 in the North Sea H. Thomas et al. Title Page Abstract Introduction Conclusions References Tables Figures J I J I Back Close
Full Screen / Esc
Print Version Interactive Discussion
EGU
Johnson, K. M., Wills, K. D., Butler, D. B., Johnson, W. K., and Wong, C. S.: Coulometric total carbon dioxide analysis for marine studies: maximizing the performance of an automated gas extraction system and coulometric detector, Mar. Chem., 44, 167–187, 1993.
Kempe, S. and Pegler, K.: Sinks and sources of CO2 in coastal seas: the North Sea, Tellus, 43B, 224–235, 1991.
5
K ¨ortzinger, A., Thomas, H., Schneider, B., Gronau, N., Mintrop, L., and Duinker, J. C.: At-sea intercomparison of two newly designed underway pCO2systems – encouraging results, Mar. Chem., 52, 133–145, 1996.
Liu, K.-K., Atkinson, L., Chen, C. T. A., Gao, S., Hall, J., MacDonald, R., Talaue McManus, L., and Quinones, R.: Exploring continental margin carbon fluxes on a global scale, EOS, 81,
10
641–644, 2000a.
Liu, K.-K., Iseki, K., and Chao, S.: Continental margin carbon fluxes, in: The Changing Ocean Carbon Cycle: A midterm synthesis of the Joint Global Ocean Flux Study, edited by: Field, J. G., Cambridge University Press, New York, 187–239, 2000b.
Pegler, K. and Kempe, S.: The carbonate system of the North Sea: determination of alkalinity
15
and TCO2 and calculation of PCO2 and Slcal (spring 1986), Mitt. Geol.-Pal ¨aont. Inst. Univ. Hamburg, 35–87, 1988.
Sabine, C. L., Feely, R. A., Gruber, N., Key, R. M., Lee, K., Bullister, J. L., Wanninkhof, R., Wong, C. S., Wallace, D. W. R., Tilbrook, B., Millero, F. J., Peng, T.-H., Kozyr, A., Ono, T., and Rios, A. F.: The Oceanic Sink for Anthropogenic CO2, Science, 305, 367–371, 2004.
20
Sarmiento, J. L. and Gruber, N.: Sinks for anthropogenic carbon, Phys. Today, 8, 30–36, 2002. Takahashi, T., Sutherland, S. C., Sweeney, C., Poisson, A., Metzl, N., Tilbrook, B., Bates, N. R.,
Wanninkhof, R., Feely, R. A., Sabine, C. L., Olafsson, J., and Nojiri, Y.: Global sea-air CO2 flux based on climatological surface ocean pCO2, and seasonal biological and temperature effects, Deep-Sea Res. II, 49, 1601–1622, 2002.
25
Thomas, H., Bozec, Y., de Baar, H. J. W., Elkalay, K., Frankignoulle, M., Schiettecatte, L.-S., Kattner, G., and Borges, A. V.: The Carbon budget of the North Sea, Biogeosciences, 2, 87–96, 2005,SRef-ID: 1726-4189/bg/2005-2-87.
Thomas, H., Bozec, Y., Elkalay, K., and De Baar, H.: Enhanced open ocean storage of CO2 from shelf sea pumping, Science, 304, 1005–1008, 2004.
30
Thomas, H., England, M. H., and Ittekkot, V.: An off-line 3D model of anthropogenic CO2uptake
by the oceans, Geophys. Res. Lett., 28(3), 547–550, 2001.
BGD
2, 757–777, 2005
pCO2 in the North Sea H. Thomas et al. Title Page Abstract Introduction Conclusions References Tables Figures J I J I Back Close
Full Screen / Esc
Print Version Interactive Discussion
EGU
using water mass ages and CO2equilibrium chemistry, J. Mar. Sys., 27, 325–336, 2001. Thomas, H., Pempkowiak, J., Wulff, F., and Nagel, K.: Autotrophy, nitrogen accumulation and
nitrogen limitation in the Baltic Sea: a paradox or a buffer for eutrophication?, Geophys. Res. Lett., 30(21), 2130, doi:10.1029/2003GL017937, 2003.
Tsunogai, S., Watanabe, S., and Sato, T.: Is there a “continental shelf pump” for the absorption
5
BGD
2, 757–777, 2005
pCO2 in the North Sea H. Thomas et al. Title Page Abstract Introduction Conclusions References Tables Figures J I J I Back Close
Full Screen / Esc
Print Version Interactive Discussion
EGU
Table 1. Seasonal and annual CO2 air-sea fluxes, and net community production (NCP) from
February until August in the North Sea. Positive values indicate a flux into the marine area, i.e., and increase of the DIC pool. NCPcorrdenotes the NCP, which has been corrected for the CO2 air-sea flux. See text for details. For convenience, also the air-sea fluxes for the autumn period and the entire year have been given. The southern North Sea comprises the gird boxes 2–4 and the northern North Sea the boxes 5–13, respectively. The grid structure is shown in Fig. 2.
[mol CO2m−2yr−1] NCP Feb.=>Aug.CO Sep.=>Jan. Annual
2 NCPcorr CO2 CO2
(uncorr.) air-sea flux (flux corr.) air-sea flux air-sea flux
Southern North Sea −2.36 0.19 −2.55 −0.41 −0.22
Northern North Sea −3.12 1.18 −4.30 0.47 1.64
BGD
2, 757–777, 2005
pCO2 in the North Sea H. Thomas et al. Title Page Abstract Introduction Conclusions References Tables Figures J I J I Back Close
Full Screen / Esc
Print Version Interactive Discussion
EGU
a) b)
c) d)
Thomas et al., Variability of..., subm. to Biogeosciences
Figure 1
Fig. 1. Seasonal variability of the relationship between different surface water properties. (a)
partial pressure (pCO2) vs. Temperature.(b) Total alkalinity (AT) vs. pCO2. (c) ATvs. dissolved inorganic carbon (DIC).(c) DIC vs. pCO2. In a) the lighter colors indicate data south of 54◦N and the darker colors data north of 54◦N, respectively. All data have been projected onto the same grid.
BGD
2, 757–777, 2005
pCO2 in the North Sea H. Thomas et al. Title Page Abstract Introduction Conclusions References Tables Figures J I J I Back Close
Full Screen / Esc
Print Version Interactive Discussion
EGU
Figure 2
Thomas et al., Variability of..., subm. to Biogeosciences
a) b) c)
Fig. 2. Maximum changes in∆pCO2,bio(a) and∆pCO2,temp (b) calculated according to
Taka-hashi et al. (2002). (c) Bottom topography of the North Sea using the ETOPO2 data set
(Na-tional Geophysical Data Center:http://www.ngdc.noaa.gov). The grid structure is according to Thomas et al. (2004).
BGD
2, 757–777, 2005
pCO2 in the North Sea H. Thomas et al. Title Page Abstract Introduction Conclusions References Tables Figures J I J I Back Close
Full Screen / Esc
Print Version Interactive Discussion EGU pCO2, temp. pCO2, bio. pCO2, obs. pCO2, temp. pCO2, bio. pCO2, obs. pCO2, temp. pCO2, bio. pCO2, obs. a) b) c) Figure 3
Thomas et al., Variability of..., subm. to Biogeosciences
Fig. 3. Biological, temperature and observed∆pCO2signals for three different regions of the
North Sea:(a) 60◦N 1◦E,(b) 56◦ 1◦E, and(c) 54◦N 3◦E. The data are shown as difference to February.
BGD
2, 757–777, 2005
pCO2 in the North Sea H. Thomas et al. Title Page Abstract Introduction Conclusions References Tables Figures J I J I Back Close
Full Screen / Esc
Print Version Interactive Discussion EGU Aug. Feb. Nov. May
Thomas et al., Variability of..., subm. to Biogeosciences
Figure 4
a) b)
c) d)
Fig. 4. Seasonal variability of the CO2 air-sea fluxes. The monthly fluxes are taken from
Thomas et al. (2004) and are shown for the months February (a), May (b), August (c) and
November(d). The “zero” contour line has been indicated. The same color scale has been
BGD
2, 757–777, 2005
pCO2 in the North Sea H. Thomas et al. Title Page Abstract Introduction Conclusions References Tables Figures J I J I Back Close
Full Screen / Esc
Print Version Interactive Discussion
EGU
Figure 5
Thomas et al., Variability of..., subm. to Biogeosciences
a) b)
Fig. 5. Biological vs. temperature control of the pCO2. (a) shows (T–B) and (b) shows (T/B)
according to Fig. 3. The “0” (a) and “1” (b) contour lines are indicated, respectively, where both controls balance each other. The grid structure is according to Thomas et al. (2004).
BGD
2, 757–777, 2005
pCO2 in the North Sea H. Thomas et al. Title Page Abstract Introduction Conclusions References Tables Figures J I J I Back Close
Full Screen / Esc
Print Version Interactive Discussion
EGU
Figure 6
Thomas et al., Variability of..., subm. to Biogeosciences
Fig. 6. Biological DIC uptake (∆DICbio) calculated from Fig. 3a according to Thomas et
al. (2001). An average salinity of 34 and an average water column depth of 30 m were used for the calculations. The grid structure is according to Thomas et al. (2004).