The Dissection of VEGFA Stimulus-Responsive Regulatory
and Transcriptional Changes in Angiogenesis
by
Daniel S. Day
B.A., Augustana College (2009)
Submitted to the Harvard-MIT Program in Health Sciences and
Technology
in partial fulfillment of the requirements for the degree of
Doctor of Philosophy in Medical Engineering Medical Physics
at the
z C~ C
WoO C~%j
C')r
MASSACHUSETTS INSTITUTE OF TECHNOLOGY
June 2015
@Massachusetts
Institute of Technology, 2015. All rights reserved.
Author ...
Certified by .
Signature redacted
...
Harvard-MIT P
a
H
t
e
a
.
n
Harvard-MIT Program in Health Sciences and Tknology
Signature redacted
May 18, 2015
Peter J. Park
Professor of Pediatrics
Signature redacted
Accepted by.
Thesis Supervisor
Emery Brown
MD, PhD/Director, Harvard-MIT Program in Health Sciences and
Technology/Professor of Computational Neuroscience and Health Sciences
and Technology
The Dissection of VEGFA Stimulus-Responsive Regulatory and
Transcriptional Changes in Angiogenesis
by
Daniel S. Day
Submitted to the Harvard-MIT Program in Health Sciences and Technology on May 18, 2015, in partial fulfillment of the
requirements for the degree of
Doctor of Philosophy in Medical Engineering Medical Physics
Abstract
Several studies over the past decade have transformed our understanding of the regulatory elements and mechanisms utilized by a human cell to drive cell type identity. In partic-ular, epigenomic studies have revealed recurrent epigenetic signatures at enhancers and other regulatory regions, as well as their role in cellular lineage specification. However, these studies generally focused on steady-state cellular states where much of the lifespan of adult cells involves responding to extracellular cues. To better understand the gene expression changes that occur in response to simuli, I studied a time-course stimulation of human umbilical vascular endothelial cells (HUVECs) with vascular endothelial growth factor A (VEGFA) as a model system. Using data collected from multiple genome-wide as-says I modeled the dynamic changes in epigenetic, transcriptional, and transcription factor binding profiles in regulation of angiogenesis, the formation of new blood vessels. First, I identify regulatory elements involved in VEGFA-response through focal, temporal changes in chromatin structure and that p300 activity is mechanistically required for this response. Secondly, I analyze changes in combinatorial binding of transcription factors linked with VEGFA-responsive enhancers. These studies highlight general strategies to study stimulus-responsive regulatory systems, and reveal new insights into angiogenesis, human disease and therapeutic targets. Finally, I show that VEGFA-responsive genes are regulated by promoter-proximal RNA Polymerase II pausing and extend it to comprehensive analysis of gene expression and chromatin regulation by promoter-proximal pausing across cell types. Thesis Supervisor: Peter J. Park
Acknowledgments
To my parents, sisters, brother, grandparents, aunts, uncles and cousins, I am forever grateful for all the love and support given to me over the years. I would not be here
without all of you in my life.
To my friends, thank you for helping me celebrate the good times and get through the tough ones. I am so fortunate to have you all in order to keep be grounded and focused on
what is important in life.
To my colleagues, thank you for your guidance, support and answers to my questions over the many years. Through all of your help experimentally, analytically, and even just
Contents
List of Figures 7
List of Tables 11
1 Introduction 12
1.1 The Composition of the Human Genome and the Types of Genes . . . . 12
1.2 The Organization of Chromatin and the Nucleus . . . . 13
1.3 Transcription Factors Bind Regulatory Elements and Regulate Transcription 22 1.4 Enhancers Regulate Gene Expression by Looping Towards Target Promoters 23 1.5 Chromatin Remodeling During Development Compared with Chromatin Remodeling During Signal Response . . . . 24
1.6 The regulation of Pol II and transcription by regulating both initiation and the entry into elongation . . . . 25
1.7 The Physiological Process of Creating New Blood Vessels: Angiogenesis . 26 1.8 Understanding the Chromatin Dynamics and Transcriptional Regulation of A ngiogenesis . . . . 27
2 A dynamic H3K27ac signature identifies VEGFA stimulated endotheliai en-hancers and requires p300 activity 29 2.1 A bstract . . . . 29
2.2 Introduction . . . . 30
2.3 R esults . . . . 30
2.3.1 VEGFA Stimulation Induces Local H3K27ac Changes . . . . 30
2.3.2 A dynamic VEGFA-regulated H3K27ac signature is tightly linked to p300 chromatin occupancy . . . . 31
2.3.3 Temporal clustering of H3K27ac variation defined groups of chro-matin regions with distinct function annotations and enriched tran-scription factor motifs . . . . 35
2.3.4 The dynamic H3K27ac signature defines VEGFA-responsive tran-scriptional regulatory elements . . . . 41
2.3.5 Dynamic H3K27ac sites and p300 participate in VEGFA-stimulated chromatin looping . . . . 43
2.4 D iscussion . . . . 44
2.5 M ethods . . . 47
2.5.2 ChIP-seq Analysis, Peak Calling for p300 and DNase I
Hypersen-sitivity Sites . . . 47
2.5.3 Calculating the H3K27ac variance score . . . 48
2.5.4 RNA-seq Analysis . . . 48
2.5.5 Transcritipion factor motif analysis . . . 48
2.5.6 Browser Views . . . 49
2.5.7 Data access . . . 49
3 Analyzing the Transcriptional Regulation of Endothelial Cells and VEGFA Stimulus-Response 50 3.1 A bstract . . . 50
3.2 Introduction . . . 50
3.3 R esults . . . 51
3.3.1 Experimental Design . . . 51
3.3.2 Analysis of Temporal Pattern of VEGFA-responsive Protein Cod-ing and Non-codCod-ing RNA Gene Expression Change . . . 51
3.3.3 Low Temporal Variability of Typical Chromatin Marks of Active TSSes at VEGFA Responsive Genes . . . 57
3.3.4 The Broad Chromatin Landscape is Stable under VEGFA Starva-tion and StimulaStarva-tion . . . 62
3.3.5 The Enhancer Landscape during VEGFA Response . . . 63
3.3.6 Comparison of Active Regulatory Regions during VEGFA Response and across Endothelial Cell Subtypes . . . 67
3.3.7 Genetic Variation within VEGFA Responsive Sites . . . 68
3.3.8 Multiple Dynamic Changes in Transcription Factor Co-binding Upon VEGFA Stimulation . . . 69
3.4 D iscussion . . . 74
3.5 M ethods . . . 79
3.5.1 Data Generation . . . 79
3.5.2 ChIP-seq Data Processing, ChIP-seq Peak Calling for Transcrip-tion Factors and Co-activators . . . 79
3.5.3 RNA-seq Data Processing and Gene Expression Quantification and Defining VEGFA Responsive Genes . . . 80
3.5.4 GO BP Enrichment Analysis for Responsive Genes . . . 80
3.5.5 Chromatin State Calls using Hidden Markov Model Segmentation . 80 3.5.6 Enhancer Analysis . . . 81
3.5.7 DNase I hypersensitivity analysis . . . 81
3.5.8 Co-clustering of Transcription Factors . . . . 81
4 A Comprehensive Analysis of RNA Polymerase II Pausing Across Mammalian Cell Types 83 4.1 Abstract ... ... 83
4.2 Introduction . . . 84
4.3 R esults . . . 84
4.3.2 Pol II Pausing Influence On Gene Expression Levels . . . 88
4.3.3 Pol II Pausing and Cell Population Gene Expression Variability . . 91
4.3.4 High Pol I TSS density promotes pausing release . . . 91
4.3.5 Many stimulus-responsive genes are paused and have lower PI prior to stim ulation . . . 95
4.3.6 Pausing release selectively regulates rapid, signal-induced gene ex-pression change . . . 98
4.3.7 Pol II pausing relationship to the local chromatin landscape . . . . 100
4.3.8 Pol II pausing's relationship to chromatin topology . . . 105
4.4 D iscussion . . . 106
4.5 Additional Methods . . . 108
4.5.1 ChIP-seq and RNA-seq analysis . . . 108
4.5.2 Calculating Pol II Pausing . . . 108
4.5.3 GO Analysis for paused genes . . . 108
4.5.4 Estimated mean PI coefficient of variation for genes within Hi-C TADs and ChIA-PET interactions . . . 109
5 Conclusions and Future Directions 110 5.1 Dynamic Chromatin Changes at Signal-Responsive Regulatory Elements . . . 110
5.2 p30 0 has Broad Effects on VEFGA-responsive Chromatin Remodeling . . . 112
5.3 Stimulus-Responsive Genes Have Structures Relating to Dynamic Gene Expression Change . . . 112
5.4 The Regulation of H2A.Z Deposition by Promoter-Proximal Pol II Pausing . . . 113
5.5 Implications for Understanding the Regulation of A ngiogenesis . . . 114
A GWAS SNPs Mapping to HUVEC Enhancers and H3K27ac Variant Sites 116 B Additional Tables and Figures For Promoter-Proximal Pol 11 Pausing Analysis 125 B .1 Tables . . . 125
List of Figures
1-1 A crystal structure of a nucleosome. . . . . 15
1-2 A graphical summary of a typical ChIP-seq experiment workflow. . . . . . 18
2-1 The experimental design of stimulating HUVECs with VEGFA . . . 31
2-2 Correlation of H3K27ac profiles from time series with ENCODE HUVEC
data. .... ... ... ... .... ... ... ... .. .. . . .. 32
2-3 VEGFA-responsive H3K27ac change occurs near p300 binding sites in
H U V EC .. . . . 33
2-4 Histogram of H3K27ac variance scores for windows with a minimum score
of4. ... ... 34
2-5 H3K27ac variant sites are much closer on average to p300 binding sites
than less variant p300 sites. . . . 34
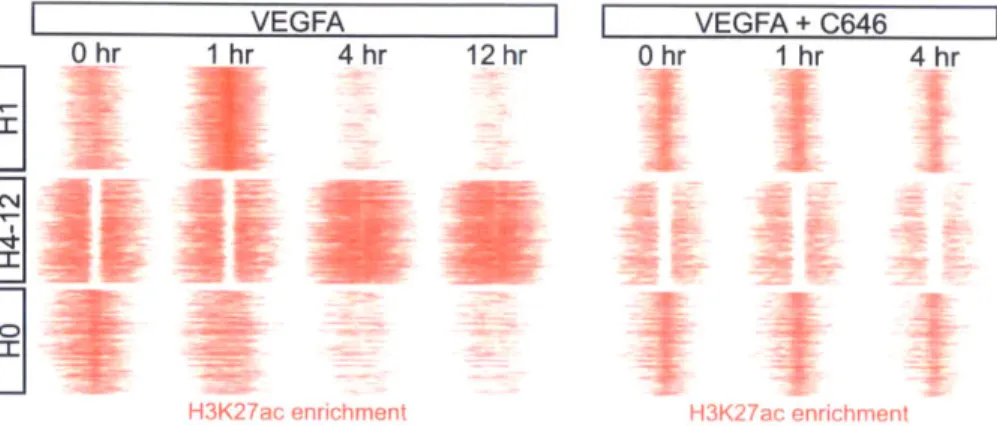
2-6 H3K27ac profile with and without C646 treatment to compare changes in
H3K27ac upon blocking p300 acetyltransferase activity. . . . 35
2-7 H3K27ac variability decreased in C646 pre-treated cells. . . . 36 2-8 Temporal scaling of the most H3K27ac variant windows near a p300 peak
highlights three primary temporal patterns of H3K27ac variation. . . . 37
2-9 Clustering the H3K27ac variant sites reveal three major temporal patterns
in response to VEGFA. . . . 38 2-10 Browser snapshot of example sites showing no significant change in DHS
signal upon VEGFA stimulation at H3K27ac dynamic sites . . . 39
2-11 GREAT analysis of GO functional enrichments at variant H3K27ac sites. . 40
2-12 ETS 1 transcription factor strongl occupies p300 binding sites. . . . 40
2-13 Transcription factor motifs enriched at H3K27ac variant sites. . . . 41
2-14 All H3K27ac variant sites had an open chromatin structure at baseline and throughout the time course. . . . 41
2-15 Relationship to VEGFA differential gene expression changes to H3K27ac
variant sites. . . . 43
2-16 VEGFA induces changes in chromatin looping frequency, whie addition of C646 inhibits observed VEGFA responsive changes. . . . 45 2-17 C646 pre-treatment of HUVECs inhibited VEGFA responsive gene change. 45
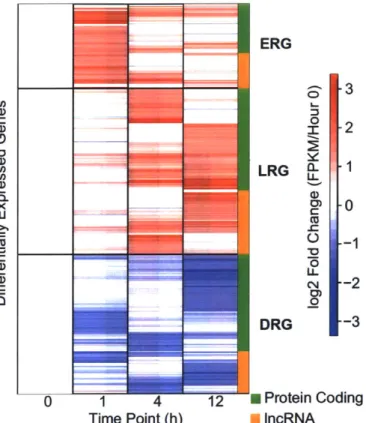
3-1 Clustering of VEGFA-responsive genes during the time cours in order to
identify temporal patterns of gene expression change during angiogenesis. 53
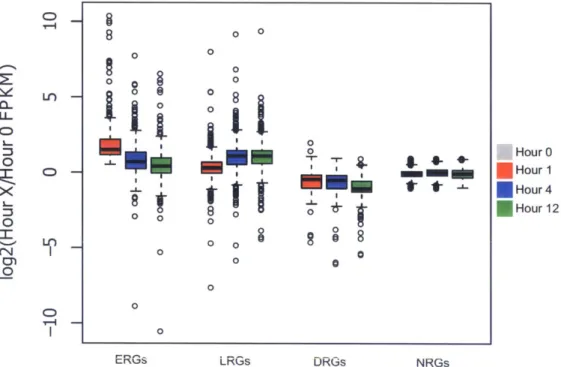
3-3 Boxplot of expression ranges (in FPKM) for each of the four gene sets per tim e point. . . . 55 3-4 Expression fold change relative to Hour 0 over time at VEGFA-responsive
and non-responsive expressed genes. . . . 56
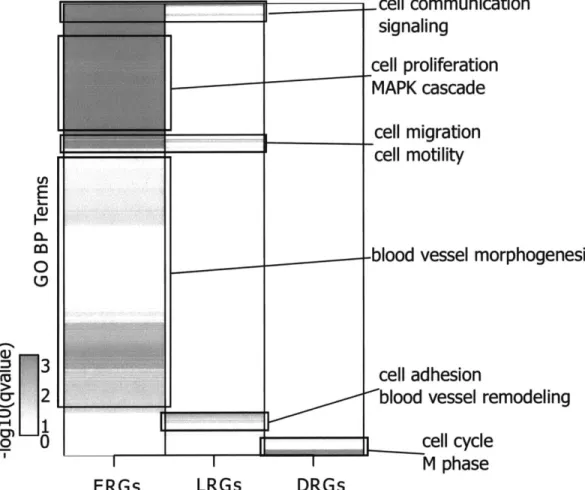
3-5 Enrichment of GO biological process terms for each VEGFA responsive
gene set. . . . 58
3-6 Comparison of the distribution of gene lengths for each gene set. . . . 59
3-7 Comparison of the distribution of transcription lengths for each gene set. . . 60
3-8 Unique exon count for VEGFA responsive gene sets. . . . 60 3-9 Temporal dynamics at TSS of H3K27ac, H3K4me3, and DNase I
hyper-sensitivity at VEGFA responsive genes. . . . 61
3-10 Chromatin state model for VEGFA-stimulated HUVECs. . . . 62 3-11 Distribution of chromatin states across HUVEC time course and ENCODE
data. .... ... .. . . . . .. .. .. .. ... ... . .. . . . ... . 63
3-12 VEGFA-responsive latent enhancers in HUVEC. . . . 64 3-13 Several enhancer chromatin states lie within larger regions of repressed
chrom atin. . . . 65
3-14 p3 0 0 binding frequency over time at super, latent, and island enhancers. . . 65
3-15 The changes in H3K27ac at super, latent and island enhancers over time
with and without C646 treatment. . . . 66
3-16 Number of long-range interactions to VEGFA responsive genes for super,
latent, and island enhancers. . . . 67
3-17 The distribution of H3K27ac variant sites across enhancer types and
chro-m atin states. . . . 68
3-18 Comparison of DNase I hypersensitivity peaks at HUVEC enhancers within
the VEGFA time course. . . . 69
3-19 DNase I hypersensitivity peak clustering across endothelial cell types and G M 12878. . . . 70 3-20 Summary of the transcription factor binding changes over time in response
to V EG FA . . . . 72
3-21 Average occupancy of ETS 1 binding at SOM clustered candidate cis
regu-latory regions. . . . 73
3-22 Average p300 occupancy over all time points across clustered candidate cis
regulatory regions. . . . 73
3-23 The average binding profile of ERG, FLI, and JUN occupancy. ... 75
3-24 RBPJ binding dramatically increases over time in response to VEGFA.. . . 76
3-25 GATA2 and MYC have temporal, dynamic co-occupancy in response to V EG FA . . . 77 3-26 Frequency of candidate cis regulatory regions to nearest ERGs and LRGs. . 78
4-1 Graphical summary of calculating a gene's Pausing Index (PI) . . . 85
4-2 Distribution of paused genes across cell types in human and mouse. . . . . 86 4-3 Analyis of enriched GO biological process terms in paused genes across
cell types in order to identify recurrent functions of paused genes. . . . 87
4-5 Comparison of GC percentage and CpG density at highly and lowly paused
genes. ... ... 88
4-6 Enrichment analysis of all DNA 6- and 5-mner sequeneces at promoters supports combination of high GC and CpG content associated with more paused Pol II at TSS. . . . . 89
4-7 Paused and non-paused genes have a similar expression profile even while paused genes are the predominantly expressed gene in a cell type. . . . 90
4-8 Trend modeling between gene expression and PI. . . . 91
4-9 Paused genes have a lower expression variability cell-to-cell within a pop-ulation across cell types. . . . 92
4-10 Mean expression levels across a cell population between paused and non-paused genes did not not significantly vary. . . . 92
4-11 To analyze the nature of Pol II activity and the PI, a visualization technique was developd to plot each gene by its Pol II TSSR and gene body density. Then the PI can be visualized in the left to right diagnoal. Each point/gene can be colored relative to a third variable, such as gene expression. When plotting all genes in GM 12878 as such . . . 93
4-12 The inflection point within the TSSR-gene body Pol II trend line occured across cell types and generally located where the most highly expressed genes were. ... ... 94
4-13 Enrichment biological process GO terms across cell types for genes past the inflection point. . . . 94
4-14 Deposition of NELF, CDK9, and CCNT2 at TSS relative to the PI. . . . 95
4-15 Inflection point within TSSR-gene body Pol II trend curve only downregu-lated by total but not selective P-TEFb inhibition. . . . 96
4-16 Knockdown of pausing release through various inhibitors shows that Pol II TSS density increases. . . . 97
4-17 VEGFA responsive gene sets for pausing release analysis. . . . 98
4-18 Both VEGFA responsive and non-responsive genes are paused prior to stim ulation. . . . 99
4-19 Signal-stimulus responsive genes have lower average PI at baseline than gene non-responsive to signal-stimulus. . . . 99
4-20 Changes in pausing release in response to signal-stimulus does not uni-formly increase or appear to primarily regulate all stimulus-responsive genes. 100 4-21 Inhibition of pausing release via flavopiridol in VEGFA treated HUVECs dramatically inhibits gene upregulation at selected genes tested. . . . 100
4-22 Relationship between the PI and nucleosome depletion at TSS . . . 101
4-23 Histone marker to PI correlation across cell types. . . . 102
4-24 H2A.Z stongly increases with increaing PI while H3.3 is not. . . . 102
4-25 H2A.Z density around TSS increases with increasing PI across cell types. . 103 4-26 The nucleosome density around TSS for paused genes in mES increases highest at the most paused genes. . . . 104
4-27 siRNA knockdown of H2A.Z in MCF7 cells globally increases Pol II pausing. 104 4-28 Distribution of how Pol II density changes after H2A.Z knockdown. . . . . 104
4-29 Comparison of H2A.Z enrichment relative to H3 density at selected
pro-moters using ChIP-qPCR . . . 105
4-30 Lower PI coefficient of variation for genes within the same topological dom ain. . . . 106
4-31 Genes having the same long-range interactions withn an enhancer based on Pol II ChIA-PET data have more similar PI than genes interacting with different enhancers. . . . 107
B-1 Measurement of Pausing Index (PI). . . . 127
B-2 Robustness of Pol II pausing measurements and calculations. . . . 128
B-3 Pausing across cell and tissue types. . . . 129
B-4 Relationship between whole gene, TSSR, and gene body Pol II density and PI to gene expression for H1, K562, IMR90, HUVEC, and HEPG2 human cells.. ... ... . ... . ... ... ... ... .. .. ... .. ..130
B-5 Relationship of gene expression to TSSR and gene body RNAP2 density and to PI. . . . 131
List of Tables
1.1 List of chromatin marks analyzed in this thesis. . . . . 19
3.1 ChIP-seq samples analyzed in this study. . . . 52
3.2 Frequency of enhancers, and different enhancer types, in HUVECs. . . . . 63
A. 1 Count of GWAS SNPs to H3K27ac variant sites and all HUVEC enhancers. 116
B. 1 Summary of human and mouse cell lines used in Chapter 4 . . . 125
Chapter 1
Introduction
New blood vessels are formed through a process known as angiogenesis[l, 2]. While the cellular biology of angiogenesis has been extensively studied[1-4], the transcriptional reg-ulation that underlies angiogenesis is still poorly understood[5]. With increased under-standing of the non-coding genome[6-8] as well as newer methods to assay important, related proteins genome-wide[9, 10], it is possible to observe angiogenesis-driven changes in histone modifications and transcription factors in order to identify can-didate regulatory elements driving the changes. This will help both identify what regions of the genome regulate new blood vessel formation and lead to better understanding the transcriptional mechanisms that drive the process, in an effort to uncover novel therapeutic targets that can modulate pathological angiogenesis in human disease.
1.1
The Composition of the Human Genome and the Types
of Genes
The human genome contains approximately 3 billion base pairs of DNA spanning 22 auto-somal and 2 sex chromosomes[6], where a gene is the basic functional unit of a genome. Classically, genes encoded proteins[7, 11]. The human genome contains many genes that encode proteins, known as the protein-coding genome, and the remaining fraction, known
as non-coding genome[6, 7]. Prior to the sequencing of the human genome, it was
hy-pothesized that the genome encoded a large set of protein-coding genes to create the wide diversity of cellular phenotypes seen at the tissue level[12]. However after sequencing the human genome, only about 2% of the human genome, or 30,000 genes, appeared to be protein-coding[6]. Further analysis revised this initial estimate downward to around 24,000 protein-coding genes[13]. Overall, these estimates suggested that most of the hu-man genome is non-coding. Yet, surprisingly, much of the non-coding genome was tran-scribed into RNA[6], which suggested functional activity. A substantial portion of this non-coding region is believed to contain regulatory elements, such as enhancers and pro-moters, that regulate cell-specific gene expression[14, 15], but the fraction is functionally important is still under debate. The ENCODE consortium estimated that up to 80% of the genome could be assigned biochemical activity from integrated analysis of transcription, epigenetic, and other genome-wide data sets[16], but only about 8.2% of the genome is
constrained over evolution[17, 18], which is a more traditional measure of whether a re-gion of DNA is functionally important for cellular function. Hence, what fraction of the non-coding genome is functionally important requires further study.
Most protein-coding genes structurally contain a series of exons and introns with a promoter and transcription start site (TSS) at the 5' end of the gene and transcription ter-mination site (TES) at the 3' end of the gene[19]. While a RNA polymerase transcribes a gene, the introns of that gene are removed from the nascent RNA by RNA splicing pro-teins co-transcriptionally[20-22]. For protein coding genes, the spliced RNA transcript is known as messenger RNA (mRNA)[19]. After polyadenylation, mRNA is moved to a ribosome in the cytosol in order to be translated into a protein[19]. An exon may be dif-ferentially included within a mRNA through alternative splicing, where the nuclear RNA splicing proteins determine the inclusion of a particular exon[19, 20]. Over 95% of known human protein-coding genes have more than one isoform, where the isoforms of a gene are the different RNA transcripts that are produced using different combinations of a gene's exons[20, 23, 24]. Different isoforms from the same gene may enable a gene to generate several different proteins from the same locus[19, 20], which contributes towards pheno-typic diversity between cell types.
There are multiple types of non-coding RNA genes in addition to protein-coding genes [7,
25, 26]. Several well-known types are ribosomal RNAs (rRNAs), transfer RNAs
(tR-NAs), and small nuclear RNAs (snRNAs)[7, 26]. These non-coding RNAs are important in the regulation of transcription and translation[26]. Over the past couple of decades, microRNAs (miRNAs) emerged as non-coding RNAs that bind and downregulate target RNAs through the Argonaute pathway[26, 27], similar to small interfering RNAs (siR-NAs). A new major type of non-coding RNA of recent interest is long, non-coding RNA (lncRNA)[25, 28]. IncRNAs are similar to mRNAs[24, 28], such as having multiple ex-ons and undergoing RNA splicing. However, IncRNAs do not generate any proteins and are more weakly conserved than protein coding genes[25, 28]. XIST and H19 are a few classical examples of critical IncRNAs necessary normal cellular function[25]. Despite not generating any proteins, the knockdown of IncRNAs can have a negative effect on the cellular phenotype[25, 28, 29], suggesting that at least some IncRNAs are functionally important. But at this time, the function of most IncRNAs is still poorly understood.
1.2
The Organization of Chromatin and the Nucleus
Within the nucleus, the chromatin, a complex macromolecule consisting of DNA, RNA and protein[30], is packaged in an intricate three-dimensional structure[31, 32]. Chromatin has multiple functions[30, 33], including packaging the DNA and contributing towards the regulation of gene expression. During interphase, the chromatin is broadly divided into euchromatic and heterochromatic regions[34, 35], experimentally identified by the bands visualized during chromatin staining[35]. Euchromatin is chromatin with greater acces-sibility to other proteins and tends to contain actively transcribed genes[35]. Conversely, heterochromatin is chromatin with a more compact, less accessible structure that generally contains repetitive elements and repressed genes[34, 35]. Heterochromatin is further di-vided into two subtypes: facultative and constitutive[35]. Facultative heterochromatin is a
region that is repressed in a cell-type specific manner. Facultative heterochromatin arises through development, repressing genes that, for example, are of developmental importance but no longer need to be expressed in a particular cellular lineage[35]. Comparatively, constitutive heterochromatin is a region that is repressed in virtually all cell types[35]. For example, many regions of constitutive heterochromatin are composed of repetitive ele-ments[35], such as the centromere. From these broad categories of chromatin, advances in molecular biology have allowed for a better understanding the molecular underpinnings of these regions.
At the molecular level, the basic unit of chromatin is the nucleosome[30]. The core of a nucleosome is made of DNA wrapped around a histone octamer, where histones are positively charged proteins that strongly interact with negatively-charged DNA[30, 36].
A major function of histones is compacting the nuclear DNA to fit within the microscale
volume of the nucleus, since end-to-end the human genome spans a distance of over 1.8 me-ters[30]. There are five histone types: HI, H2A, H2B, H3, and H4[30, 36]. The H2A, H2B,
H3, and H4 histones are known as the core histones because together these histones form
the histone octamer of a nucleosome[30]. Each histone type has two protein copies within the histone octamer and has multiple genes that encode a histone protein that can incorpo-rate into the appropriate position within the octamer[30, 36]. Folded histones have several basic amino acids on the protein's surface[30, 36], allowing the acidic DNA to wrap around the histone octamer[30], as seen in Figure 1-1. The core nucleosome has about 146 base pairs (bp) of DNA wrapping around the histone octamer[30]. The fifth histone type, HI, is known as the linker histone since it binds DNA between histone octamers. A nucleosome also contains linker DNA covered by H1, causing the amount of total nucleosomal DNA to vary[30, 35]. (The function of HI is further reviewed in Harshman et al[37].) On average, the total nucleosomal DNA around the HI histone and histone octamer is about 200 bp[30,
35]. Together the histones within a nucleosome mediate chromatin compaction and
acces-sibility to the nucleosomal DNA. In euchromatic regions, nearby nucleosomes tend to be less compact, allowing greater openness or looseness of the DNA for increased accessibil-ity by other DNA-binding proteins[30]. Heterochromatic regions tend to be more compact with nucleosomes folding into higher order structures, reducing accessibility of nucleoso-mal DNA[30]. While some higher order chromatin structures are well studied (e.g., chro-mosome condensation during metaphase)[30], the nature of chromatin compaction is still under active study.
Histones were initially discovered by Albrecht Kossel, who biochemically isolated these proteins over a century ago[40]. While initially believed to be one protein, the differ-ent types of histones were uncovered over the next several decades[36]. Histones are highly conserved throughout the eukaryotic domain with low genetic variation across species[36]. The genes for the standard core histones are found in multiple copies in many eukaryotic genomes[36]. Each core histone also has multiple histone variants throughout the eukary-otic domain[36]. Compared to the genes encoding the standard core histones, a histone variant often has only a single gene encoding the variant protein[36], but these variants maintain a similar structure to its related standard core histone structure differing often only by a few amino acids and are often strongly conserved [36]. For example, H2A.Z is a very common histone H2A variant that is thought to regulate nucleosome stability[36, 41-43]. Some histone variants have been adapted to regulate specific functions[36]. For
Figure 1-1: A crystal structure of a nucleosome with the nucleosomal DNA (gray) wrapped around the core histone octamer. On average, 146 bp of DNA wraps around the histone octamer. The core histone complex has 2 copies of each of the core histones (only half the nucleosome complex is visible here). Each histone within the crystal structure is colored as follows: H2A, yellow; H2B, red; H3, blue; H4, green. The raw crystal structure image can be found in the Protein Data Bank[38] under accession identifier lEQZ[39].
example, CENP-A is specifically incorporated into nucleosomes in the centromere to aid centromere targeting during mitosis[36]. With all the histone variants across eukarya, each core histone type has a large gene family[36]. While the diversity of histones can allow for a variety of functional specializations, post-translational modifications to histones contribute towards regulating chromatin structure and activity.
There are a variety of post-translational modifications of histones that are linked with various cellular regulatory functions[8, 33, 44]. Prior to the identification of these post-translational modifications, histones were thought to be inert packaging proteins[36]. The initial discovery that suggested histones are involved in other regulatory roles was from Vincent G. Allfery and colleagues at the Rockefeller University in the 1960s[45]. He and his team discovered that individual histone fractions extracted from calf thymus could have a high density of acetylated lysines[45]. Acetylation of a histone would reduce its pos-itive charge leading to repelling the DNA from wrapping around the histone, increasing chromatin accessibility and reducing chromatin packing. This led them to hypothesize that acetylating histones over a gene may increase its expression by increasing its chromatin accessibility for transcription [45].
The role of histones beyond DNA compacting was further expanded in 1988 with work
by Michael Grunstein and colleagues on histone H4 in yeast. The N-terminal tail of each
of the histones, like most of the rest of the histone protein itself, was strongly conserved throughout evolution[46], but the function of histone tails was not understood at the time.
By mutating select amino acid residues along the H4 N-terminal tail in yeast, Grunstein
and colleagues showed that mutations in the H4 tail caused the activation of normally si-lenced genes, although surprisingly it did not affect normally expressed genes or the yeast's growth[46]. The mutations also caused the cell cycle to lengthen[46]. Hence, this study
suggested that the N-terminal tail contributed towards normal cell cycle regulation in yeast through likely post-translational modifications, and that histones have other roles in addi-tion to DNA compacaddi-tion.
The N-terminal tail of each histone has multiple post-translational modification
iden-tified[33, 44, 47]. Several amino acid residues on the N-terminal tail of a histone can be
modified, such as lysines and arginines[44]. Many well-studied post-translational mod-ifications are methylations and acetylations of these residues, but there are other known post-translational modifications, such as phosphorylation[33, 44, 47]. The expanding num-ber of known post-translational modifications led to the development of the histone code
hypothesis[48]. This posited that the combination post-translational modifications on the
N-terminal tail could regulate protein-binding to a specific region instead of only affecting the DNA-histone interaction[48], since the expanding number of known post-translational modifications allowed for a large combinatorial code that could be used for regulating gene expression and other functions. But it also appears many post-translational modifications are functionally redundant[33, 49, 50], narrowing the potential number of distinct combi-nations of post-translational modifications and the span of the histone code.
Another question that arose with the expanding number of identified histone post-translational modifications is what enzymes add, remove and read these post-post-translational modifications[30, 44]. Each post-translational modification to the N-terminal tail of a hi-stone has a corresponding writer and likely eraser enzyme[30, 44]. A writer or eraser enzyme can modify one or more amino acid residues on a N-terminal histone tail. For ex-ample, p300 and CREB binding protein (CBP) both contain acetyltransferase domains that acetylate lysines on histone H3[44, 51]. In addition to reading and writing, many proteins contain chromatin binding domains that act as readers for one or more N-terminal histone tail post-translational modifications[44]. A notable example is heterochromatin protein I (HP1) that recognizes and binds H3K9me3 that then condenses nearby chromatin when bound[33, 44]. Although these modifications have no likely catalytic activity themselves, the establishment and removal of post-translational modifications still can contribute to-wards cellular regulation through altering the chromatin structure and the localization of chromatin-binding proteins.
In order to better understand the organization of chromatin, multiple methods have been developed to assess occupancy of chromatin bound proteins[9, 52-55]. One key method to assess the chromatin occupancy of a target protein is chromatin immunopre-cipitation (ChIP)[52]. ChIP is the immunopreimmunopre-cipitation of a target protein, using an anti-body raised against the target protein, with the associated chromatin fragment in the co-immunoprecipitate[52]. In order to obtain chromatin fragments from cells, the cells are lysed, and the chromatin is fragmented into small segments (such as through sonication). Often a chemical agent, such as formaldehyde, is added prior to lysing the cell to cross-link proteins and DNA in chromatin to improve the likelihood of co-immunoprecitating
DNA during the ChIP pulldown. Then the enrichment of a target protein at a selected DNA
region can be assessed through quantitative polymerase chain reaction (qPCR). ChIP was first developed to assay the position of RNA Polymerase II (Pol II) at target sites in the
Drosophila genome during studies about transcription[56]. However, a major limitation of
ChIP-qPCR is that it only assesses one region at a time.
development of microarray technology in the 1990s[57]. Although initially developed to assay the expression of multiple genes in parallel[57], microarray technology was adapted for ChIP experiments (known as ChIP-chip or ChIP-on-chip)[55]. Microarrays are plat-forms that contain multiple DNA probes at selected genomic regions of interest[55, 57]. After marking the DNA pulled down from a ChIP with a fluorescent tag, this extracted
DNA is put into the microarray such that the tagged DNA hybridizes with the probe
se-quences on the chip)[55]. Probe regions enriched with the target protein will be increas-ingly hybridized by tagged DNA from the ChIP pulldown, which can be measured by the fluorescence intensity at a specific probe[55]. This technology was successfully applied to multiple histone modifications and other chromatin proteins across multiple organisms[49,
58]. Yet, especially for large genomes like humans, this did not cover the entire genome
due to limitations of the number of probes that could be placed on a microarray[10, 44, 55], requiring newer technologies for true genome-wide analysis of histone modifications and other chromatin bound proteins.
The development of high-throughput sequencing led to the development of ChIP fol-lowed by high-throughput sequencing[9] (ChIP-seq). Instead of hybridizing the recovered
DNA sequences from a ChIP to a microarray, the extracted DNA sequences from the ChIP
pulldown are sequenced and mapped back to the target genome to assess the position of the targeted protein[9, 10]. (A graphical summary of a ChIP-seq experiment is provided in Figure 1-2.) ChIP-seq can provide base pair resolution of the position of a target protein, although there are many technical challenges associated with analyzing ChIP-seq data[lO]. In order to address some of the experimental challenges, alternative methods have been developed, notably DamID and ChIP-exo[53, 54]. DamID allows assaying a chromatin-bound protein without cross-linking agents or antibodies by affixing an adenosine methyl-transferase to the target protein[54]. The attached adenosine methylmethyl-transferase then methy-lates adenosines at GATC sites when the target protein is bound to chromatin, and then the methylation status can be assessed with a methylation sensitive restriction enzyme [54]. However, DamID has lower resolution than ChIP-seq (since a GATC sequence occurs once every 1024 bp on average) and requires creating a fusion protein[54]. ChIP-exo, on the other hand, uses an antibody pulldown like ChIP-seq but improves the data profile resolu-tion by first digesting the extracted chromatin DNA with an endonuclease to cut the DNA fragments down to the protected region by the target protein before completing the rest of
ChIP-seq[53], reducing the noise in the experiment by only sequencing DNA fragments
right around the target protein.
The analysis of ChIP-seq data first requires aligning sequenced DNA fragments back to a reference genome[9, 10], such as the human genome. There are several programs to align high-throughput sequencing data, such as bowtie[60] and bwa[61]. The alignment of these DNA reads assesses the position of the target histone modification or other chromatin protein along the genome. In addition to the ChIP sample, an input DNA profile is often generated to account and correct for some ChIP-seq related biases in the signal profile[9,
10]. Using ChIP and input data sets, ChIP-seq peaks can be called using tools such as MACS[62] and spp[63]. seq peaks are regions of significant enrichment in the
ChIP-seq profile that reflect likely positions where the target protein is located.
Several ChIP-chip and ChIP-seq studies over the past decade across metazoan organ-isms mapped post-translational histone modifications genome-wide in order to better
un-nudeus
Cross-link protein to DNA
gShear
DNA strandby sonicating
cel ysate
Add bead-attace antibodies
unlink protein; purify DNA
t rmapto genome
ATGCCTGGACCGTG
Figure 1-2: A graphical summary of a typical ChIP-seq experiment workflow[9]. (Image licensed and used under CC BY-SA 3.0[59].)
. . . . . . . . . . . . .
Chromatin Mark Brief Summary References
H3K4me3 Marks TSSs of expressed [8, 65]
genes
H3K4mel Marks enhancers [8, 15, 65]
H3K4me2 Marks enhancers [8, 66]
H3K27ac Marks active TSSs and en- [8, 15, 58, 67]
hancers
H3K27me3 Marks repressed regions [8, 68]
(facultative heterochromatin) through PRC2
H3K9me3 Marks repressed regions [8, 44]
(constitutive
heterochro-matin)
H3K36me3 Marks regions recently tran- [8, 69]
scribed by Pol II, usually at the gene of gene bodies over exons
H2A.Z Marks promoters (both active [8, 70, 71]
and sometimes inactive) and active enhancers
DNase I Hypersensitivity Identifies regions of open [72, 73]
chromatin, such as at TSSs and active enhancers
Table 1.1: List of chromatin markers analyzed in this thesis. DNase I hypersensitivity is not a chromatin mark, per se. But it is included here because of its utility in identifying regions of open chromatin.
derstand the organization of the chromatin[8, 58, 64, 65]. A brief summary of the com-monly attributed function(s) of each histone modification studied in this thesis is listed in Table 1.1, and a more detailed summary of these histone modifications is provided over the next several paragraphs.
H3K4me3 (tri-methylation of lysine 4 on histone H3) is primarily enriched at the TSS of expressed genes[8, 58, 64, 65, 68] (see Table 1.1). This mark is established likely through the binding of Pol II at a promoter and subsequent recruitment of the Trithorax complex to establish it[74]. Consequently, repressed genes typically lack H3K4me3 en-richment[8]. Since Pol II initiation and H3K4me3 enrichment at TSS is linked, the ChIP-seq signal intensity of H3K4me3 at TSS correlates with a gene's expression level[64, 75]. While H3K4me3 enrichment has been often studied at protein coding genes, expressed non-coding RNA genes also have H3K4me3 enrichment. This includes IncRNAs[28] and transcribed repetitive elements, such as tRNAs[76], suggesting H3K4me3 establishment is independent of the whether a particular gene encodes a protein.
TSS[74], where an open chromatin structure reduces the barrier for Pol 11 initiation[77]. In
addition to maintaining an open chromatin structure at a promoter, H3K4me3 establishment may positively influence Pol I initiation as well. For example, at least one of the Pol II general transcription factors binds H3K4me3 to help recruit the pre-initiation complex[78]. In a complementary report, broad, strong enrichment of H3K4me3 at genes can stabilize Pol II to reduce their gene expression variability across a population of cells[79].
Unlike at TSS, H3K4me3 is generally absent at distal regulatory elements[8, 58]. How-ever, sometimes distal regulatory elements may have H3K4me3 enrichment, such as those that are actively transcribed in humans[24] and mouse[80]. This was consistent with other reports that Pol II bound and transcribed a subset of active enhancers[81, 82]. Hence, Pol II binding and transcription at mammalian enhancers may induce the establishment of H3K4me3, but whether these H3K4me3-enriched distal regulatory elements are actually independent enhancers or part of a yet unidentified gene[83] remains to be further studied. H3K4mel (mono-methylation of lysine 4 of histone H3) tends to mark cell-specific en-hancers within the chromatin (see Table 1.1)[15, 65]. Unlike H3K4me3, H3K4mel is typ-ically enriched at distal enhancers rather than at TSS across species[58, 65, 82], although H3K4mel is weakly enriched relative to H3K4me3 at the TSS of expressed genes[64]. But the presence of H3K4mel does not guarantee that an enhancer is actively regulating transcription[82]. Generally, active enhancers are better identified by the combination of H3K4me 1 and H3K27ac (described further below)[82]. Hence, H3K4mel appears insuffi-cient to activate an enhancer, but it is useful in identifying candidate enhancers within a cell type[82]. Another histone methylation, H3K4me2 (di-methylation of lysine 4 on histone
H3), tends to co-occupy regions of H3K4mel [8, 84], and it has been used to identify sites
undergoing dynamic changes in nucleosome positioning in response to external stimuli[66]. H3K4me2 is also found with H3K4mel and H3K4me3 at a expressed TSS[8, 64], but H3K4me3 is still more strongly enriched with increasing expression than H3K4me2[64].
Recently, it has been shown that H3K4mel may be established de novo in response to external stimuli[85] (in combination with H3K27ac). This de novo H3K4mel enables inactive enhancers that, at least temporarily, create cellular memory of recent regulatory activity because, in macrophages, latent enhancers reactivate rapidly when re-stimulated
by the same initial stimulus that created the latent enhancer[85]. Although H3K4mel may
not cause an enhancer to be active, the establishment of H3K4me 1 appears important for normal enhancer function.
H3K27ac (the acetylation of lysine 27 on histone H3) marks both active TSSs and enhancers throughout the genome (see Table 1.1)[8]. When a histone is acetylated, it in-fluences transcription and chromatin accessibility by repelling the nucleosomal DNA from the core histone octamer[30, 45]. At an expressed TSS, H3K27ac tends to be found in combination with H3K4me3[8], and its enrichment also scales with a gene's expression level[75]. At enhancers, the establishment of H3K27ac marks an active enhancers with a greater sensitivity than H3K4mel[8, 67, 82]. But similar to H3K4mel, de novo H3K27ac can be established in response to external stimuli to activate latent enhancers[85]. The es-tablishment of H3K27ac is driven by the binding of transcription factors and recruitment of histone remodelers to the bound enhancer or promoter[86]. Two important examples of such chromatin remodelers are p300 and CREB binding protein (CBP), both of which have histone acetyltransferase domains that target H3K27[51, 87]. Given that H3K27ac
tends to mark active enhancers in a cell type, its establishment tends to mark cell-type spe-cific enhancers[58, 67], making H3K27ac a useful mark to profile in order to identify such
enhancers.
H2A.Z (also known as H2AFZ) is a H2A histone variant [36, 88]. Like other his-tones, H2A.Z is highly conserved across all eukaryotic taxa, and it is critical for normal function[36, 70]. H2A.Z is thought to help destabilize the nucleosome to increase nucleo-some turnover and chromatin accessibility[41-43]. In mammals, H2A.Z tends to be found at many TSSs and active enhancers[14, 42, 64], and appears to be increasingly incorpo-rated with higher expressed genes[42, 64, 89]. It also helps mediate the binding of tran-scription factors by opening chromatin and, possibly, helping recruit them directly[8, 14, 42]. Although strongly present at active genes, it also is deposited at Polycomb-repressed promoters to help recruit Polycomb Repressive Complex 2 (PRC2)[42]. Overall, H2A.Z incorporation is rather broad and requires further study to understand its full function.
H3K27me3 (tri-methylation of lysine 27 of histone H3) is a developmental repres-sive mark that is found at facultative heterochromatin[68, 90]. This mark tends to re-press developmental regulators as the cell differentiates[8, 91, 92]. PRC2 establishes H3K27me3 through the use of EZH1 or EZH2 within the complex [8, 93]. Although gen-erally thought to be repressive, H3K27me3 may be found in co-occupancy with H3K4me3 at TSS of genes that have bivalent domains[94], which are primarily found in embryonic stem cells[93] but also exist in differentiated cell types[94]. Bivalent domains tend to oc-cur at genes regulating development and tend to have low expression despite the presence of H3K4me3[90, 93, 94]. During differentiation, many of these bivalent domains become either activated or repressed by keeping H3K4me3 or H3K27me3, respectively[93, 94]. However, some bivalent domains may remain after differentiation with low expression[93], although the role of bivalent domains in non-embryonic stem cells remains unclear.
A second major heterochromatic histone modification is H3K9me3 (tri-methylation of
lysine 9 on histone H3)[64, 90]. This histone modification tends to mark constitutive hete-rochromatin[8, 64]. Many repetitive elements are repressed through H3K9me3 enrichment across cell types[76]. H3K9me3 can be established through miRNA-mediated chromatin remodeling as miRNAs silence the transcription of targeted regions[95]. H3K9me3 re-presses gene expression through recruiting HP1 that both compacts nearby chromatin and blocking Pol II[44]. In humans, H3K9me3 and H3K27me3 tend to be exclusively en-riched[96], even though both mark heterochromatin.
H3K36me3 (tri-methylation of lysine 36 on histone H3) is a mark that covers gene bodies of expressed genes[8, 90]. In comparison to the H3K4 methylations and H3K27ac, it occurs downstream of a gene's TSS[90]. This mark is established through Pol II elon-gation[44], often being more enriched at the exons of a gene rather than its introns. The enrichment of H3K36me3 at exons helps mediate RNA splicing since several RNA splicing factors bind H3K36me3[97]. Another role for H3K36me3 may help stabilize nucleosomes since it suppresses nucleosome turnover in yeast in order to suppress aberrant transcrip-tion[44, 69], although it is unclear if this is still its function in other organisms. Addi-tionally, H3K36me3 may regulate transcription indirectly. A recent report showed that H3.3K36me3 can be bound by ZMYND1l1[98]. ZMYND1 1 when bound inhibits tran-scription by blocking the release of Pol II from its promoter-proximal pausing state[98] (Pol II pausing is discussed in Section 1.6). Although H3K36me3 is established by Pol II
as a consequence of elongation, it has multiple roles in regulating gene activity.
Another informative property of chromatin structure is identifying regions of open chro-matin may contain active regulatory elements[99]. Histones can occlude access to the nucleosomal DNA, which can inhibit the binding of transcription factors and other chro-matin binding proteins[72, 73, 86, 99]. In order to improve binding by transcription factors and other chromatin proteins, chromatin needs to open and expose the underlying DNA for binding[14, 86]. Hence, identifying of open chromatin regions can be informative of active regulatory regions within a cell type, which can achieved through DNA cleavage en-zymes[72, 73, 99]. Under the proper experimental conditions, open chromatin regions are more readily digested by DNA cutting enzymes, such as DNase I[72, 99]. Regions prefer-entially cut by DNase I are known as DNase I hypersensitive regions. Promoters and active enhancers tend to be DNase I hypersensitive[73], but many promoters are DNase I hy-persensitive across many cell types[73], suggesting that promoter accessibility contributes little to type gene expression patterns. Comparatively, the enhancers tend to have
cell-type specific DNase I hypersensitivity [72, 73], suggesting that the activity distal regulatory
elements is tightly controlled across cell types through altering chromatin accessibly[14].
1.3 Transcription Factors Bind Regulatory Elements and
Regulate Transcription
Transcription factors are DNA binding proteins that bind an enhancer or gene promoter to regulate transcription at a target gene[100, 101]. Each transcription factor has a DNA bind-ing domain and regulates the activity of a RNA polymerase when bound to chromatin[ 100,
101]. The human genome is estimated to contain a large number of potential transcription
factors[100, 101], suggesting that the regulatory network in humans is rather diverse and complicated. There are two groups of transcription factors differentiated by their DNA
binding properties: general or sequence-specific. General transcription factors make up RNA polymerases, such as Pol II, and bind gene promoters[102]. Sequence-specific tran-scription factors are the larger set of trantran-scription factors that each have a consensus
se-quence bound by its DNA binding domain[100, 101]. The size of a consensus sese-quence
ranges from small (such as the 4 bp core motif for the GATA family of transcription factors) to large (such as p53, see the JASPAR database for more examples[ 103]). The consensus sequence of a transcription factor can be identified by analyzing ChIP-seq data, in com-bination of consensus motif estimating software such as MEME[104], DREME[105], or
MEME-CHIP[106], more sensitive techniques, such SELEX[107] or protein binding
mi-croarrays[108]. Many transcription factors are grouped into families. For example, the ETS transcription factor family is a prevalent set of transcription factors expressed throughout many cell types and where all factors generally bind the core GGAA DNA motif (or a close variation)[109]. Often multiple ETS transcription factors are expressed within a human cell type, but how they achieve bind binding specificity from each other expressed ETS factor remains under study[109, 110].
Many transcription factors must co-bind with other transcription factors or co-activators to drive changes in gene expression[86]. Sometimes the binding of a single transcription
factor may be sufficient, possibly such as MYC over-expression in many cancers[ 111, 112]. But, especially in humans, the co-binding of transcription factors appears necessary for transcriptional change[14, 86]. Co-activators, such as p300 and CBP, help stabilize the co-binding of multiple transcription factors[14, 51, 86]. Additionally, the co-binding of multiple transcription factors is strongly influenced by the chromatin structure[14, 73, 86], possibly requiring a pioneer factor to open chromatin first before the co-binding of other factors[86,
113]. DNase I hypersensitivity analysis can identify such regions of open chromatin that
transcription factors could bind, although a recent report suggests that co-binding tran-scription factors can bind stably at non-DNase I hypersensitive regions[ 114]. Overall, the co-binding of transcription factors is heavily influenced by both the DNA content and chro-matin structure of enhancers in a cell type.
1.4 Enhancers Regulate Gene Expression by Looping
To-wards Target Promoters
Enhancers are DNA regulatory elements that regulate gene expression of a target gene or genes, often in a cell-type specific manner[14, 15, 115]. Enhancers regulate transcription
by serving as platforms for transcription factor binding[14]. Unlike gene promoters, the
chromatin structure of enhancers tends to be more cell-type specific to regulate its activ-ity[14, 15, 50, 58, 73, 82]. Active enhancers tend to be marked by both H3K27ac and H3K4mel in addition to being DNase I hypersensitive[14, 15, 82]. Additionally, H2A.Z and H3.3, a H3 histone variant[36], may occupy an active enhancer as a way to increase its nucleosome turnover and accessibility[ 14, 15]. Together, these changes in chromatin structure increase its accessibility to allow transcription factor binding.
The how transcription factors must bind to an enhancer to cause gene expression changes is still under study[86]. Especially in humans, enhancers often contain multiple transcrip-tion factor binding sites of different sequence-specific transcriptranscrip-tion factors, and multiple transcription factors may need to co-bind for transcriptional change[ 14, 86]. Pioneer fac-tors are thought to bind first in order to open the chromatin structure of an enhancer to enable binding of other transcription factors[86, 115]. After this, a basic model would sug-gest all transcription factor binding sites need to be bound at an open enhancer to cause transcriptional change[86]. Yet, there is increasing evidence that not all transcription factor binding sites may need to be bound to be functional[86], leading to further questions on how to determine the necessary set of transcription factors at an enhancer for driving gene expression.
Recent studies have begun to classify different types of enhancers[85, 116, 117]. One popular class is super enhancers, which are enhancers with extremely strong H3K27ac and/or BRD4 signal[116, 117], where BRD4 is a transcriptional co-activator. Super en-hancers may include multiple adjacent peaks of H3K27ac and/or BRD4[116, 117], allow-ing a super enhancers to span a large region. While the differences between super enhancers and normal enhancers are still under study, super enhancers are important given their gen-eral proximity to and ability to regulate key cell identity and developmental genes[ 116,
en-hancers in a cell type through the use of profiling certain histone marks[15, 58, 82], candi-date enhancer identification has becoming increasingly easier leading to the need to poten-tially further classify different types of enhancers to understand their function.
Enhancers are thought to regulate transcription by creating chromatin loops towards their target gene (or genes) after the binding of transcription factors[ 14, 118, 119]. Two key complexes are known to help form of chromatin loops: Mediator and cohesion[ 119-1211. These complexes are recruited to enhancers upon changes in transcription factor binding and drive looping towards the target promoter. Newer experimental methods have enabled improved analysis of enhancer-promoter and other chromatin loops genome-wide[32].
Hi-C[32] has been particularly useful in capturing this chromatin structure. Recent studies
have shown the chromatin is foled into multiple active or repressed compartments. [31, 32]. Some of these compartments form topologically associating domains (TADs)[122, 123], where most enhancer-prmoter chromatin loops tend to occur within a TAD[122]. Hence, the location of TADs are important determinants in regulating enhancer targeting[ 14, 122,
123]. TADs tend to be also stable across cell types[122], suggesting variation in TADs
may weakly contribute to gene regulation. But recent extremely high-resolution Hi-C data showed that there are a number of cell-type specific chromatin loops within larger com-partments and TADs[124], suggesting that enhancer-promoter chromatin loops tend to be shorter and rather cell-type specific.
1.5
Chromatin Remodeling During Development Compared
with Chromatin Remodeling During Signal Response
Chromatin remodeling is a major component of cellular differentiation during develop-ment[90-92, 125-127]. The chromatin landscape remodels as a cell differentiates in order to cause changes in active regulatory elements that, in turn, will drive changes in gene ex-pression to establish the new cell phenotype[90-92, 125, 127]. In embryonic stem cells, most of the genome begins in a euchromatic state[90, 128]. As a cell differentiates, the chromatin landscape is remodeled to alter the accessibility of genes and enhancers active within a particular cell type[128]. This also includes the expansion of heterochromatin as most differentiated cells tend to have a larger heterochromatin content than euchro-matin[128, 129] and the remodeling of bivalent domains [90, 94].
In terminally differentiated cells, the importance of chromatin remodeling less well un-derstood. Multiple studies have suggested that chromatin remodeling accompanies cellular response to external stimuli[66, 85, 130-133] or even normal rhythms[134]. For example, changes in nucleosome positioning may occur in response to an external stimulus through changes in transcription factor binding[66, 133], possibly converting heterochromatic re-gions into euchromatic rere-gions. Chromatin remodeling has also been reported to occur at the TSS of genes expressed in response to external stimuli[132]. In neurons, changes in H3K27ac were observed at candidate neuronal enhancers in response to depolarization of the neuron[131]. In mouse dendritic cells, multiple extracellular stimuli cause the activa-tion of latent enhancers, de novo H3K4mel and H3K27ac deposiactiva-tion at previously inactive regions[85]. While there are examples of chromatin remodeling in terminally
differenti-ated cells, few studies have studied temporal changes of chromatin structure over short time courses and connected it with downstream changes in gene expression.
1.6 The regulation of Pol II and transcription by
regulat-ing both initiation and the entry into elongation
RNA polymerases transcribe genes into RNA under many layers of regulation[77, 135,
136]. Animal genomes generally contain three RNA polymerases. (Comparatively, plants
have five RNA polymerases[137, 138].) Each RNA polymerase transcribes a particular set of genes. RNA Polymerase I transcribes several rRNA genes[102]. RNA Polymerase III transcribes tRNA genes as well as some rRNA genes[102]. Pol I transcribes the majority of genes since it transcribes both protein coding and long, non-coding RNA genes, in addi-tion to snRNA and miRNA genes[102, 136]. Pol II is a multi-protein complex that contains several of general transcription factors[102, 136]. After establishing the Pol II pre-initiation complex at a promoter[102], Pol II begins transcribing the gene; but, before entering pro-ductive elongation, Pol II pauses just downstream and proximal to the TSS[77, 135, 136]. This Pol IL promoter-proximal pausing often occurs between 20 to 60 bp downstream of the
TSS[77, 135, 139], and it remains paused until it is released to begin elongation. The pause
is caused by the binding of negative elongation factor (NELF) and DRB-sensitive inducing factor (DSIF) to Pol II[77, 135]. Additionally at this point, the 5-serine on the C-terminal domain (CTD) of Pol II is also phosphorylated[77, 136]. Pol II remains in this paused state until released through the recruitment of positive transcription elongation factor
(P-TEFb)[77, 135, 136]. P-TEFb removes NELF and phosphorylates serine 2 on the Pol II CTD tail in order for Pol II to begin elongation[77, 136]. The P-TEFb complex includes the 7SK IncRNA and CDK9[136], and the activity of P-TEFb is blocked by the small
molecu-lar inhibitor flavopiridol[135, 136, 140] (FP). After pausing release, elongating Pol II may
pause elsewhere along the gene body (e.g., during co-transcriptional splicing) even though
these other pauses appear currently unrelated to the regulation of promoter-proximal Pol II pausing[135, 141].
This promoter-proximal pausing was initially discovered at Drosophila heat shock genes[77]. By heat shocking Drosophila cells, there was a surprising rapid transcriptional upregulation on a set of heat shock genes, faster than expected from the time it took to transcribe a non-heat shock gene[77]. Initially, it was hypothesized that Pol II pausing helped mediate rapid changes in gene expression since pausing would maintain stable, transcriptionally engaged Pol II for rapid activation[77, 142]. Since then, several studies showed that Pol I pausing was widely present at non-signal responsive genes in the human
and Drosophila genomes[143-145], and Pol II pausing was not necessary for rapid changes
in gene expression[142]. Since then, estimates of the number of paused genes range from
30% to 90% of all genes within a genome[77], depending on the technology and criterion
used. But this suggests a widespread rather than narrow phenomenon in transcriptional regulation.
With increasing understanding of Pol IL pausing, several reports have identified that transcriptional output can be regulated through altering pausing release rather than only
![Figure 1-2: A graphical summary of a typical ChIP-seq experiment workflow[9]](https://thumb-eu.123doks.com/thumbv2/123doknet/14751288.580303/18.918.296.606.191.909/figure-graphical-summary-typical-chip-seq-experiment-workflow.webp)

![Figure 2-11: Using GREAT[ 166], each set of H3K27ac variant sites per cluster were ana- ana-lyzed for functional Gene Ontology (GO) enrichments based on nearby genes](https://thumb-eu.123doks.com/thumbv2/123doknet/14751288.580303/40.918.360.565.127.572/figure-using-great-variant-cluster-functional-ontology-enrichments.webp)