HAL Id: hal-02968284
https://hal.archives-ouvertes.fr/hal-02968284
Submitted on 15 Oct 2020
HAL is a multi-disciplinary open access
archive for the deposit and dissemination of sci-entific research documents, whether they are pub-lished or not. The documents may come from teaching and research institutions in France or abroad, or from public or private research centers.
L’archive ouverte pluridisciplinaire HAL, est destinée au dépôt et à la diffusion de documents scientifiques de niveau recherche, publiés ou non, émanant des établissements d’enseignement et de recherche français ou étrangers, des laboratoires publics ou privés.
Visualization of drug interactions for supporting
medication review
Abdelmalek Mouazer, Karima Sedki, Rosy Tsopra, Jean-Baptiste Lamy
To cite this version:
Abdelmalek Mouazer, Karima Sedki, Rosy Tsopra, Jean-Baptiste Lamy. Visualization of drug inter-actions for supporting medication review. International Conference on Informatics, Management and Technology in Healthcare, Jul 2020, Athen, Greece. �hal-02968284�
Visualization of drug interactions for
supporting medication review
Abdelmalek MOUAZERa,1 Karima SEDKIa, Rosy TSOPRAb,c and Jean-Baptiste
LAMYa,d
aUniversité Sorbonne Paris Nord, LIMICS, INSERM, UMR 1142, F-93000, Bobigny bINSERM, Université de Paris, Sorbonne Université, Centre de Recherche des
Cordeliers, Information Sciences to support Personalized Medicine, F-75006 Paris
cDepartment of Medical Informatics, Hôpital Européen Georges-Pompidou, AP-HP,
Paris, France
dLaboratoire de Recherche en Informatique, CNRS/Université Paris-Sud/Université
Paris-Saclay, Orsay, France
Abstract. The number of elderly patients with multimorbidities has considerably increased since recent years. These patients are often polymedicated and at higher risk of safety incidents due to polypharmacy. To reduce polypharmacy, one solution is Medication review (MR). MR aimed at optimizing drug treatments, is unfortunately not very frequent in practice. Indeed, consulting the properties of 5-20 drugs in parallel is a cognitively complex task. It is therefore necessary to develop software for supporting MR. The existing tools only list alerts concerning drugs and their interactions. The objective of our work is to facilitate the pharmacist's access to the medical knowledge necessary for drug interactions. Using visual analytics, we propose an interactive tool that synthesizes information on drug interactions. It shows an overview of drug treatment and make it visually accessible by the pharmacist to facilitate MR.
Keywords. Visual analytic, Medication review, Drug interactions.
Introduction
The number of elderly patients with multimorbidities has considerably increased since recent years. These patients are often polymedicated (i.e. they receive 5 drugs or more) and are consequently at higher risk of safety incidents due to polypharmacy. Polypharmacy is both a public health and an economic issue.
To reduce polypharmacy, one solution is medication reviews (MR). A MR is “a structured interview with the patient, carried out by the pharmacist in collaboration with the general practitioner (GP) with the aim of optimizing patient care” [2]. In many countries, including France, MR is reimbursed by health insurances.
However, the simultaneous consultation of the properties of 5-20 drugs is a long, difficult and cognitively complex task. This often discourages pharmacists, and in practice few MR are performed. It is therefore necessary to develop software for supporting MR.
Current systems for MR display a flat list of all drug interactions; when interactions are numerous, the list occupies multiple pages and it is tedious to read and to summarize because the user has to scroll continuously.Other systems offer a table-based approach to summarize drug information [3], but it becomes visually less readable as the number of drugs and drug properties increases. In a previous work [4], we showed that visual analytics can help to present drug properties when comparing similar drugs.
The objective of this work is to propose an interactive tool relying on visual analytics for providing an at-a-glance overview of all interactions of the drugs taken by a given patient, in order to facilitate the pharmacist's access to the necessary medical knowledge during MR.
1. Method
To carry out this project, we exploited the Thériaque drug database (http://www.theriaque.org/), one of the four accredited databases in France, to extract drug interactions and contraindications. In our approach, we were inspired by the approach of A.Galopin for the medication management of poly-pathological patients [5]. In the context of prescription support, the method he proposed consisted in representing recommended drug association using “therapeutic circles”: candidate drugs are represented by small circles, organized in a large circle. Then, recommended bitherapies are represented by edges connecting two drugs. We adapted this idea by presenting the drugs taken by the patient, with edges representing the drug-drug interactions. In addition, we represented drug-disease interactions by the color of the drug circles.
For implementation, we worked with Python and the Django framework for the development of a web application. We generated vector images (SVG) for the visualization of the analysis of drug interactions.
2. Results
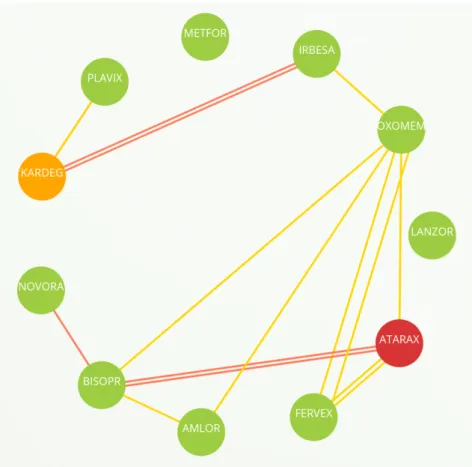
Figure 1 shows the proposed interface showing drug-drug and drug-disease interactions.
First, the drugs are represented by small circles. The first letters of the drug name are displayed in the circle; the full name appears by moving the mouse over the drug.
The system detects interactions between the patient's condition and the drug.
According to the level of risk, it colors the circles of the drugs according to a gradient of color ranging from yellow for the drugs presenting a minor risk to red for the contraindicated drugs. The other circles are green.
Second, the system detects all drug-drug interactions and represents each interaction by an edge connecting the two drugs involved. These edges are colored according to the four levels of interaction with a gradient of colors ranging from yellow (for minor interactions) to red (for major interactions).
Figure 1. Screenshot of the proposed visual interface showing 11 drugs, 2 drug-disease interactions and 15 drug-drug interactions.
In addition, the system offers the user the possibility of accessing the explanatory text of interactions and contraindications in an interactive way by clicking on the segment representing the interaction or on the drug presenting an alert.
In Figure 1, one can immediately identify two drug-disease interactions, and see that there are many (15) drug-drug interactions, 5 of them being of moderate seriousness. The visualization allows identifying at a glance the drugs with the highest number of interactions (here, Oxomemazine) and those involved in the most serious interactions (Bisoprolol). The pharmacist may decide to reevaluate the risk-benefit balance of these drugs, and suggest to stop them or reduce their posology.
3. Discussion and conclusion
The system we propose provides an at-a-glance overview of drug and drug-disease interactions of all drug in a given drug order. It allows information to be accessed quickly in a concise and efficient manner.
This type of representation in a circle has the advantage of synthesizing interactions well. It is effective in displaying all interactions and thus makes it possible
to visually detect the most risky and potentially dangerous drugs, e.g. those with the highest number of interactions and the most severe ones. In some circumstances, the drug database detects interactions that are not relevant, for example: (a) the interaction is linked to the dose while this dose is not reached (e.g. aspirin – furosemide); (b) the interaction is limited to a clinical condition that the patient does not have (such as pregnancy); (c) the contraindications are purposely violated by the prescribers for very specific reasons. However, these problems are well-known in drug alert systems, and are not specific to the proposed visual tool.
In the future, the proposed interface could be improved as follows: (a) Drugs could be grouped or arranged according to their indication or their prescriber (e.g. cardiologist, endocrinologist, etc.), this will make it possible to detect interactions between drugs from different prescribers. (b) Interactions could be grouped according to the potential risk for facilitating the risk assessment. (c) Interactions could be filtered to keep only the most relevant according to the patient profile and the dose of the drugs. (d) Drugs could be ordered in order to avoid intersecting edges. (e) The system can be enriched with proposals of therapeutic alternatives. (f) The visualization could also list the foods that may interact with the treatment. (g) Inappropriate medicines for the elderly could also be detected and highlighted in the interface.
Another perspective of this work is the evaluation of the proposed interface in controlled and/or clinical conditions with pharmacists.
Acknowledgment
Funding was obtained from the “Agence Nationale de Sécurité du Médicament et des Produits de santé (ANSM)”. APP 2016 – RaMiPA Project (Raisonner pour Mieux Prescrire les Antibiotiques or Reasoning for better antibiotic prescription).
References
[1] Hilmer, S. N. & Gnjidic, D. The Effects of Polypharmacy in Older Adults. Clin. Pharmacol. Ther. 85, 86–88 (2009).
[2] Masson, E. Le bilan de médication en soins primaires chez les plus de 65 ans. EM-Consulte https://www.em-consulte.com/article/1190899/resume/le-bilan-de-medication-en-soins-primaires-chez-les.
[3] T Koskela, S Sandström, J Mäkinen, and H Liira. User perspectives on an electronic decision-support tool performing comprehensive medication reviews - a focus group study with physicians and nurses. BMC medical informatics and decision making, 16:6, 2016. [4] J.B. Lamy, H. Berthelot, M. Favre, A. Ugon, C. Duclos, A. Venot, Using visual analytics for
presenting comparative information on new drugs, Journal of Biomedical Informatics 71 (2017) 58-69.
[5] B. Séroussi, A. Galopin, M. Gaouar, S. Pereira, J. Bouaud, Using Therapeutic Circles to Visualize Guideline-Based Therapeutic Recommendations for Patients with Multiple Chronic Conditions: A Case Study with GO-DSS on Hypertension, Type 2 Diabetes, and Dyslipidemia, Stud Health Technol Inform 245 (2017) 1148-1152.