Contents lists available at ScienceDirect
Int J Appl Earth Obs Geoinformation
journal homepage: www.elsevier.com/locate/jagSmall-scale surface mining of gold placers: Detection, mapping, and
temporal analysis through the use of free satellite imagery
Elsy Ibrahim
a,*, Luisa Lema
b, Pierre Barnabé
a, Pierre Lacroix
c,d, Eric Pirard
a a Minerals Engineering, Materials & Environment (GeMMe), University of Liège, Sart-Tilman B52, 4000 Liège, Belgiumb United Nations Environment, Cl. 82 #1062, Bogotá, Colombia
c University of Geneva, Institute for Environmental Sciences, EnviroSPACE Lab., 66 Boulevard Carl-Vogt, 1205 Geneva, Switzerland d University of Geneva, Institute for Environmental Sciences, GRID-Geneva, Bd Carl-Vogt 66, CH-1211 Geneva, Switzerland
A R T I C L E I N F O Keywords:
Alluvial Classification Multispectral
Sequential pattern analysis
A B S T R A C T
Informal small-scale mining is spread in many countries and provides livelihood to numerous families in rural areas yet often with devastating social and environmental impacts. The alluvial gold mining process in Colombia, also known as placer mining, involves excavations using heavy machinery and creates large footprints of bare soil and mining ponds. The very dynamic nature of this extractive activity and its spread in rural and remote areas make its mapping and monitoring very challenging. The use of freely available satellite data of the Copernicus programme provides great new possibilities to study these activities and provides stakeholders in-tegrated data to better understand the spatial and temporal extent of the activities and mitigate affected areas. The objective of this work is to assess the potential of Sentinel-2 data to identify mining areas and to understand the dynamics in landcover change over a study area located at the border of the municipalities of El Bagre and Zaragoza in Bajo Cauca, Colombia. The study utilizes a classification approach followed by post-processing using field knowledge on a set of images from 2016 to 2019. Sequential pattern mining of classified images shows the likelihood of certain annual and seasonal changes in mining-impacted landcover and in the natural vegetation. The results show a slight reduction in the detected mining areas from 2016 to 2019. On the other hand, there are more mining activities in the dry season than in the wet season. Excavated areas of bare soil have a 50% chance to remain in excavation over the considered period or they transition to non-vegetated areas or mining ponds. Vegetation loss due to the extractive activities corresponds to about 35% while recovered vegetated areas are 7% of the total excavated areas in June 2019. An analysis of abandoned sites using NDVI shows that it takes a much longer period than the one considered in this paper for potential natural recovery of vegetation. Finally, the work was disseminated among stakeholders and the public on MapX (https://mapx.org), an online open platform for mapping and visualizing geospatial data on natural resources. It is a pilot study the will be the basis of the analysis of more regions in the department of Antioquia.
1. Introduction
Small-scale and artisanal mining occur in various parts of the de-veloping world, where this mining provides livelihood to households exceeding those provided by industrial mining (Carstens, 2017). Un-fortunately, these extractive activities are mostly common in poor and rural areas with relatively low monitoring or regulation. They can have major environmental, health and social impacts, and have been known to be at the heart of major armed conflicts just as in the case of Co-lombia that illustrates the country's complicated links of armed conflicts with drugs and gold mining (Power, 2002; Rettberg and Ortiz-Riomalo, 2016). Therefore, these extractive activities have major implications on
several of the United Nations’ Agenda 2030 for Sustainable Develop-ment Goals (SDGs) (UN, 2019) including SDG1 (End Poverty), SDG3 (Good Health and Well-Being), SDG6 (Clean water and Sanitation), SDG8 (Decent Work and Economic Growth), SDG12 (Responsible Consumption and Production), SDG15 (Life on Land), and SDG16 (Peace and Justice; Strong Institutions).
In Colombia, two main small-scale and artisanal gold mining ac-tivities are underground mining of veins and alluvial mining that is of secondary deposits, i.e. gold particles that tend to concentrate in water channels, giving rise to “placeres auríferos” (Bustamante et al., 2016; Rettberg and Ortiz-Riomalo, 2016). Small-scale placer land mining uses machinery and creates a large footprint. However, artisanal or
https://doi.org/10.1016/j.jag.2020.102194 Received 7 February 2020; Accepted 8 July 2020
⁎Corresponding author.
E-mail address: elsy.ibrahim@uliege.be (E. Ibrahim).
0303-2434/ © 2020 The Authors. Published by Elsevier B.V. This is an open access article under the CC BY-NC-ND license (http://creativecommons.org/licenses/BY-NC-ND/4.0/).
subsistence mining does not include machinery where gold particle are separated through panning (Ministerio de Minas y Energía, 2016). Nowadays, artisanal mining can take place along the rivers or in ponds created by small-scale miners. Alluvial gold deposits have been his-torically relatively simple to mine using inexpensive technology since the gold is present as free separate particles (Teschner et al., 2017). With the major increase in gold mining, heavy machinery is allowing for larger exploitation of deposits of lower grades, including re-mining of abandoned mining areas that had been exploited in the past with less elaborate equipment. Alluvial gold mining, or placer gold mining, can take place on land, resulting in a footprint of bare soil and ponds, but it can also be dredging activities in water bodies without a lasting visible impact. Due to the complexity of these types of activities, a good esti-mation of legally produced gold has not been possible. Yet, companies affiliated with the Association of Large-Scale Mining (Asociación del Sector de la Minería a Gran Escala) have been reported to contribute to 12% to the total national gold production (Bernal, 2016) confirming that the majority of gold produced in Colombia is from informal small- scale alluvial mining (UNODC, 2018).
Evidence of implications on various SDGs in Colombia can be traced through the threats of placer mining where the great footprint of mining activities impacts the landscape, modifies slopes in rivers, leads to major deforestation, forms large degraded areas with major dis-turbance to soil structure and composition, and leads to the loss of habitat and connectivity of biological species (Cordy et al., 2011; Vargas, 2012; Andres et al., 2018; Lara-Rodríguez, 2018; Betancur- Corredor et al., 2018; UNODC, 2018). Furthermore, it destroys natural wetlands that have an important role in providing habitat to wildlife, provide protection during storms, and allow the improvement of water quality (Martinez, 2018; Chen et al., 2019). The health hazards throughout the mining process are many including the lack of stability of the mine excavations, the inhalation and ingestion of mercury, and heavy metal accumulation and biomagnification in the environment (Smith et al., 2016).
Earth observation can greatly contribute to tackling humanitarian issues (Boyd et al., 2018), and in this case identifying and assessing areas impacted by small-scale placer mining. Multispectral data has been analyzed with various approaches that are either pixel-based or object-based and have both shown great potential in the mapping of placer mining and its impacts (Myint et al., 2011). The ability of Landsat, for example, in contributing to this field was illustrated in the identification of artisanal and small-scale gold mining and in the ana-lysis of landscape change in Indonesia (UNITAR, 2016). Landcover change was considered between pairs of images that were 10-years apart. Furthermore, Landsat was also used to identify the impact of small-scale mining in Ghana through the change detection of supervised classification of six landcover classes using eight images from 1998 to 2016 (Obodai et al., 2018) with a pixel-based approach. Furthermore, multispectral imagery acquired by Pleiades and SPOT were used to identify small-scale mining footprints in the Philippines while utilizing an object-based supervised classification (Isidro et al., 2017). Analysis using Earth observation has not only been limited to the detection of mining areas but also has allowed the identification of specific impacts of these activities. For example, Landsat data was utilized in Indonesia and Brazil to address landcover change to estimate mercury use in gold production (Telmer and Stapper, 2007). UK-DMC2 satellite acquisitions were used to map the expansion of gold mines in Ghana in the cocoa growing area (Snapir et al., 2017), and IKONOS and WorldView-2 were used as a basis to identify land-grabbing in Ghana due to the recent gold rush (Hausermann et al., 2018). Pixel-based approaches have been the most utilized and have proven great capabilities, yet they can face the challenge in mapping mining-related landcover due to the presence of similar spectral reflectance signatures that can lead to misclassification (Myint et al., 2011). On the other hand, object-based classification detects features that are aggregates of pixels, yet segmentation errors could dramatically affect their results (Liu and Xia, 2010). Furthermore,
deep learning techniques have been utilized to quantify the carbon emissions in Amazonia due to small-scale mining in Peru using com-mercial high resolution satellite remote sensing and airborne LiDAR (Csillik and Asner, 2020). For Colombia, areas that host informal allu-vial mining activities are being mapped in a two-year interval with a two year reporting period using optical remote sensing with data ac-quired by Landsat 8 and Unmanned aerial vehicles (UAVs) (UNODC, 2018). The latest 2018 report thus describes results obtained in 2016 and compares with results of 2014. The report covers the entire coun-try's alluvial mining areas and shows an increase of 6% in affected areas from 2014 (79,000 ha) to 2016 (84,000 ha). The municipality of Zar-agoza, in Bajo Cauca, was found to be one of the major impacted areas (UNODC, 2018).
Even with the shown great potential of the use of Earth Observation to detect, map, assess impacts of placer mining, the work with this data has been limited, and the use of the new data acquired by the Copernicus program has not been well tapped into. The Copernicus program of the European Space Agency provides free continuous data from passive and active sensors. Sentinel-2 is a mission of two satellites, launched in 2016, hosting the Multispectral Instrument (MSI), pro-viding imagery with a spatial resolution of 10 m, 20 m, or 60 m de-pending on the band (Drusch et al., 2012). With this free data at a relatively high spatial resolution and high revisit time provided by the twin satellites, Sentinel-2 has the potential to provide much more in- depth understanding and monitoring possibilities of the highly dynamic small-scale mining activities. With Sentinel-2's 10 m resolution, a tra-deoff could be achieved between the use of Landsat's 30 m resolution and expensive imagery of higher resolutions as it is enough to detect mining ponds.
This paper aims to utilize this free data of Sentinel-2 to identify mining areas and to understand the dynamics in landcover change over a study area located at the border of the municipalities of El Bagre and Zaragoza in Bajo Cauca, Colombia. To overcome the constraints of pixel-based and object-based approaches, the study utilizes a pixel- based approach followed by post-classification processing using field knowledge to overcome challenges in misclassification of classes with similar reflectance signatures. The mapping aims to achieve an in-depth understanding of spatial and temporal variations of the landcover in the area, with the focus on areas impacted by mining activities. Image processing techniques used for this purpose are supervised classification and sequential pattern mining of classified images. Finally, the work is a pilot case that also includes data dissemination on the online open source platform MapX (https://mapx.org). MapX has been developed by the United Nations Environment Programme (UNEP) and UNEP/ GRID-Geneva (https://unepgrid.ch). It is an online open platform for mapping and visualizing geospatial data on natural resources. 2. Study area and dataset
Bajo Cauca region in the department of Antioquia is one of many highly resourceful areas of Colombia. This region is comprised of six municipalities and includes rivers that contain the riches of alluvial gold, making the region a major source of gold. With the increase in the price of gold since 2000, informal mining increased dramatically (García et al., 2015; Council, 2018; Betancur-Corredor et al., 2018).
The study area of focus is a region at the border of El Bagre and Zaragoza municipalities (Fig. 1) and includes the central part of the town of El Bagre, in the department of Antioquia, Colombia. It has a tropical climate with frequent high cloud coverage. The precipitation in Antioquia ranges between 1,500 and 4,000 mm per year. Bajo Cauca is one of the areas of highest recorded rainfall ranging between 2,500 and 5,000 mm per year (source: http://atlas.ideam.gov.co/ visorAtlasClimatologico.html), where it experienced two seasons: (i) dry from December to March and (ii) rainy the rest of the year (IDEAM, 2019). Flooding of the Nechí river is not uncommon in the rainy season in the surroundings of El Bagre (Dane, 2011).
Two field visits to the study area were on 28/11/2018 and 18/02/ 2019. Various active and abandoned mining areas were visited, both formal and informal. Photos, GPS measurements, and interviews with the miners were carried out. Six Sentinel-2 images with no cloud cover over the study site were chosen from 2016 to 2019 acquired on (DD/ MM/YYYY): 08/07/2016, 03/07/2017, 23/06/2018, 30/12/2018, 24/ 01/2019, and 18/06/2019. They were downloaded from the Copernicus hub (https://scihub.copernicus.eu/) then were atmo-spherically and radiometrically corrected to Level-2A using Sen2Cor (Louis et al., 2016). There are twelve bands of the Sentinel-2 Multi-spectral Instrument (MSI) reported after atmospheric correction. Four bands are in the visible part of the spectrum: two blue bands (B1 and B2), one green (B3), and one red (B4) centered at 443 nm, 490 nm, 560 nm, and 665 nm, respectively. The remaining bands cover the near- and short-wave infrared (NIR and SWIR) parts of the spectrum with eight bands namely B5 (705 nm), B6 (740 nm), B7 (783 nm), B8 (856 nm), B8a (842 nm), B9 (940 nm), B11 (1,610 nm), and B12 (2,190 nm).
3. Methodology
3.1. Overview
The methodology involved a classification approach of Sentinel-2 data and a post-classification approach using field knowledge. Thus, understanding the mining process is essential in order to create suitable decisions and rules for the post-classification process and for validation purposes. Land placer mining requires the excavation of a large pond using mechanical excavators (typically 60 m by 30 m) that is filled with water from a nearby water body. Most commonly, this requires pumping of the water using gasoline-powered pumps (Fig. 2). The ex-cavated material is mixed in the partially filled pond with the added water to form an ore slurry. This slurry is used to wash the ore as the slurry arrives to the sluice box using pressurized pumps. The washing is carried out over sluices lined with a “miner's carpet” (locally referred to as Tapete Brasiero or Felpa Brasilera) that collects the gold particles as they have a higher density than the other sediment particles. The water is then circulated using pumps until most of the gold is extracted. The process can take up to 3 months per location (based on personal com-munication with alluvial miners in El Bagre and Zaragoza, Colombia, December 2018). The miner's carpet is washed regularly in a bucket or concrete washing unit where the gold particles are collected. Even in a low-grade mine where the carpet could take weeks till it requires washing, miners wash it regularly due to fear of theft. After the washing of the carpet, the material can be panned by hand to separate the gold;
in informal mining, mercury is often used in this step to improve the capture of the finest particles. With the banning of the use of mercury in July 2018, its price has increased. The interviewed formal and informal miners during field visits in November 2018 and February 2019 re-ported that they did not use mercury in the process anymore. Mercury has been the most popular to form an amalgam of gold, separating it from other particles. This amalgam is then heated to achieve a rela-tively pure form of gold through the burning of the mercury.
Even though this gravitational system could have a relatively high gold recovery rate (Teschner et al., 2017), the impact of these activities is very high. Both formal and informal land placer mining use similar equipment and carry out similar processes. The main difference is the requirements of mitigation and accountability for formal excavations. For a formal mining activity, a mining and environmental license is required that includes a program of works (Programa de Trabajos y Obras – PTO) and obliges the miners to restore impacted areas. In Zaragoza and El Bagre, miners (formal and sometimes informal) who restore the land tend to fill up the created ponds after halting mining activities and attempt to plant acancia mangium and rubber trees or experiment with plants of household use such as herbs and vegetables. In the region under study, mining titles cover the majority of the land. Yet, the presence of mining titles does not reflect formal activities on the site where a PTO is also required. Furthermore, areas with mining titles can be occupied by informal miners if access is possible.
The approach used for the identification of mining sites using Sentinel-2 includes the detection of affected land and mining ponds in their proximity. With the size of the ponds being relatively small, only the 10 bands of 10 m and 20 m resolution were used for analysis. Image bands of 20 m resolution were resampled to 10 m pixel size, and images were co-registered and subsetted to cover the study area. Then, the methodology involved these major steps: (a) a supervised classification of the data was carried out to extract 4 major classes from the time series; (b) post-classification processing was used to improve results and create more classes of interest that are not seperable only based on surface reflectance; (c) sequential pattern mining was used to analyze the temporal change in land cover in the area over the last four years; and (d) significant changes in the landcover were mapped and quan-tified including an NDVI analysis of regeneration of vegetation in abandoned mining sites.
3.2. Classification of Sentinel-2 images 3.2.1. Support vector machine classifier
Four relatively broad land cover types were considered for the classification, namely “mining areas”, other “non-vegetated areas”, “vegetated areas”, and “water”. A supervised classification approach was carried out using the support vector machine classifier (SVM). SVM is a powerful and popular classifier based on statistical learning theory and does not require a-priori assumptions regarding the underlying probability density functions of its classes, thus, it is referred to as a non-parametric supervised classifier. SVM has proven to be advanta-geous for remote sensing applications as it is effective in high dimen-sional spaces with limited and unbalanced training data (Pedregosa et al., 2011; Mountrakis et al., 2011; Ibrahim et al., 2017). It aims to identify the location of decision boundaries that produce the optimal separation of classes through determining a suitable hyperplane (Smola and Olkopf, 2004; Pal and Mather, 2005; McInerney et al., 2019; Kranjcic et al., 2019).
A linear SVM assumes that the multi-spectral feature data, such as spectra of Sentinel-2, are linearly separable in the input space. Yet, since this assumption is rarely valid in practice, new approaches were used such as “kernels” that add additional variables to improve the separability (Mountrakis et al., 2011). For this study, the SVM was trained with a Radial Basis Function (RBF) kernel or Gaussian kernel as it allows the samples to be projected nonlinearly into a higher dimen-sional space. Another advantage of using RBF kernels is the use of cross-
Fig. 1. The study site in RGB view with Sentinel-2's acquisition on December
validation and the grid-search approach to obtain the optimal para-meters for the highest overall accuracy. The two main considered parameters are “gamma” and “C”. Gamma reflects the spread of the kernel, i.e. the decision region, where the curvature of the decision boundary is low with lower values of gamma. This results in a relatively broad region of decision. On the other hand, C expresses the penalty for misclassifying data. It creates a tradeoff between correct classification and maximizing the decision function's margin. As C decreases, a larger margin is expected, yet a lower accuracy results (Pedregosa et al., 2011). The classification in this paper was carried out using the open- source libraries of “Scikit-learn: Machine Learning in Python” (Pedregosa et al., 2011). Classification accuracy was then reported as precision value Pr = T/(T + F), where T is the number of true positives and F the number of false positives.
3.2.2. Reference spectra
Based on the field visits, a selection of reference spectra from the image acquired on the 30th of December, 2018 was carried out for each
of the four classes of interest. Table 1, Fig. 3 give an overview of the land coverage included in each class and the number of available re-ference spectra. These rere-ference spectra were also the training dataset for all the considered images in this work. It can be noted that ex-cavations have higher surface reflectance than other types of non-ve-getated areas and can in many cases be even identified through visual interpretation.
3.2.3. Post-SVM processing
With a pixel-based approach to the classification, possible classifi-cation errors can be present due to similarity in reflectance signatures of pixels in different classes, in this case, especially MineBare and NonVeg classes. Furthermore, in order to distinguish important and new classes such as mine ponds, additional information such as the proximity of water bodies to MineBare pixels and the size of these bodies should be included. Thus, a post-classification refining approach was carried out using QGIS as follows (a summary is shown in Fig. 4):
•
The river is identified: The Nechí river is the single continuous spatial unit in the images and is identified through the vectorization of water bodies (Water class). Then, a buffer of 20 m along the river is considered to include mixed pixels of the river banks. Finally thebuffered river is separated from isolated water bodies.
•
Proximity of MineBare to isolated water bodies: To include mine ponds in the direct proximity or within the MineBare zone, a buffer of 30 m is created around BareMine areas, so it would intersect or include these ponds that are typically 30 m × 60 m in size. This buffer serves two purposes: (a) identifying mining ponds that are isolated water bodies intersecting with the buffered area, and (b) exclusion of any classified pixels in the MineBare class that are not in the proximity of a mining pond to remove false positives that should belong to the NonVeg class.3.3. Sequential pattern mining of the temporal series
To uncover temporal attributes in a large dataset, sequence mining has played an important role, especially with a large search space (Parthasarathy et al., 1998; Zaki, 2001; Huynh et al., 2018). Sequential pattern mining has had various applications including Earth observa-tion where temporal informaobserva-tion is involved (Wu and Zhang, 2019) and contributed to a better understanding of temporal change patterns. In this paper, a pixel-class-based method is considered to extract sequen-tial patterns from the Sentinel-2 temporal data, where a sequence is a chronologically ordered listing of classes.
The classified images are used as the input space where each pixel represents a class at a certain time. The pattern mining reveals the frequency of temporal sequences of these classes considering the six classes and that each pixel can belong to only one class per image (i.e. at a specific time). The approach used to find patterns in the sequences was Sequential PAttern Discovery using Equivalence classes (SPADE) as it is efficient and not sensitive to data-skewness (Zaki, 2001; Huynh et al., 2018). SPADE finds the frequent sequences and provides in-formation regarding the relationship among the different items in the sequence. Thus, “confidence” is reported and it indicates the likelihood that the sequential rule occurs among specific items, while “support” refers to the fraction of sequences that contains a considered sequence (Zaki, 2001), in other words, it is the number of sequences where a pattern occurs divided by the total number of sequences in the input database. SPADE was applied using the “arulesSequences” version 0.2- 22 in R Programming (Diaz and Buchta, 2019).
3.4. Analysis of significant changes
With the analysis of sequences, a change detection of important sequences is considered. Specifically, areas that were mined con-tinuously through the considered period are detected. Furthermore, areas that were transformed from vegetated areas to mined areas are revealed. Finally, areas that transformed from mining areas to non- vegetated areas are analyzed to assess their level of vegetation re-generation using the Normalized Difference Vegetation Index (NDVI),
NDVI = (NIR − RED)/(NIR + RED) where NIR is B8 (856 nm) and RED
is B4 (665 nm) of the Sentinel-2 data. NDVI has been shown to be a
Fig. 2. Overview of the mining setting captured at one of the few formal mines in December 2018.
Table 1
Overview of reference spectra.
Class Included land-cover Number of reference spectra
MineBare Bare soil in mining areas 419 NonVeg Other non-vegetated areas including
built areas 784 Water River, wetlands, and mining ponds 626 Veg Vegetated areas including forests 1020
valid indicator for vegetation monitoring in mining areas, where prior to mining a vegetated area, NDVI is at its highest values. Yet, once areas are excavated and the vegetation cover is lost, NDVI is relatively low and increases back with rehabilitation and revegetation (Yang et al., 2018). Thus, a comparison of NDVI values for areas mined at different periods of time can provide an indicator of the time-frame required for a disturbed areas to regain its vegetation cover.
3.5. Dissemination using MapX
For extractive activities to achieve environmental sustainability and have a positive social impact, legislation requires updated and in-tegrated information to make informed decisions. This includes locating mining sites and understanding their disturbance and impacts. Furthermore, for any recovery or mitigation plan to be successful, it is important to understand the dynamics in the mined areas and the time it might take the natural vegetation to recover. Field monitoring methods limited to traditional in-situ techniques are limited in spatial and temporal coverage and are relatively expensive. Earth observation offers great opportunities in this regard (Yang et al., 2018).
In order to maximize the availability of data and results to stake-holders along with other spatial data available for Colombia, MapX, an online information and engagement platform, is utilized to integrate data and reduce the data fragmentation problem facing authorities all over the world. The idea of MapX originated from the G7+ countries so that stakeholders of the extractives sector can have the tools needed for informed decision-making, good governance, and conflict prevention. This requires a consolidation of data, analysis, and spatial visualization of environmental data, etc.
MapX aims at: (1) aggregating data at various geographical scales (from site to global); (2) authenticating data integrity using a score
card; (3) visualizing and analyzing data using both client side or service applications; and (3) communicating this data using, for example, data dashboards and dynamic story maps for further prioritization and ac-tion. In MapX the geospatial layers can be grouped into dedicated spaces which can be public or private depending on their level of confidentiality. Furthermore, MapX offers a graphical interface in dif-ferent languages including English and Spanish in order to circumvent language barriers (Atibu et al., 2018; Lacroix et al., 2019).
4. Results
4.1. Classification results
The image of 30/12/2018 was classified using the SVM classifier and standardized reference spectra. A grid search was used to de-termine the suitable parameter values where gamma = 1 and C = 100 for the RBF kernel were optimal for this work. A three-fold cross vali-dation was carried out resulting in an average Pr = 0.978 ( ± 0.034). Then, all other images were classified with the same reference spectra. The resulting classification is shown in Fig. 5. Even though the classi-fication accuracy is high, several expected false positives are identified in the built area and of the Nechí riverbank sediment of high reflectance that are classified wrongly as MineBare. The post-SVM processing re-sulted in the removal of false positives through the identification of mine ponds and corrected mining areas to be limited to those in the proximity of mining ponds (Fig. 6).
4.2. Sequential pattern mining of the temporal series
For the sequential analysis, two sets of four images were used: (a) for an annual temporal analysis, images acquired in months 6 or 7 of
Fig. 3. Reference spectra of the four considered classes.
Fig. 4. Summary of post-processing class decision tree; the final created classes are in green. (For interpretation of the references to color in this figure legend, the
2016, 2017, 2018, and 2019, thus with approxamtely a 12-month timestep; (b) for a seasonal temporal analysis, the image series acquired in 2018 and 2019 was used, thus having time-steps of 6 months, 1 month, and 5 months. Therefore, for the 6 classes, 4 images in two sets are analyzed, with each image containing 606,886 pixels, the reported sequences in this paper are those with a sufficient number of occur-rences that are higher than the defined threshold of support = 0.001, thus a sequence is to appear in more than 0.1% of all sequences in the input data to be reported in the results.
4.2.1. Annual temporal analysis
A set of 134 sequences are reported and have a minimum support of 0.001, median support of 0.004, and maximum support of 0.8. The most frequent items appearing in these sequences is class NonVeg indicating high changes in that class with a relatively high number of pixels (a)
NonVeg : 87 appearances, (b) Veg : 55 appearances, (c) MineBare : 31
appearances, (d) IsolatedWater : 29 appearances, (e) MinePonds : 28 ap-pearances, and (f) River : 26 appearances.
A subset of the 12 sequences is shown in Table 2 where the selected supports in the table are those higher than 0.05. The highest supports reflect the dominant presence of vegetated areas with the sequence
Veg → Veg → Veg → Veg and its subsequences Veg → Veg → Veg and Veg → Veg showing a 50% to 70% chance that vegetated areas in the
area in 2016, 2017, and 2018 remained vegetated in 2019.
Table 3 shows an extract of the sequences starting with MineBare in 2016. The supports are relatively low, yet this is expected as MineBare has overall smaller coverage than the other classes. The relative values of the support indicate the most frequent sequences. The sequences confirm that there is approximately a 50% chance that mined areas remain classified as MineBare in the proceeding years. The sequences also show that mined areas typically transition to the NonVeg class or in several cases to the MinePonds class. No considerable transition from MineBare to Veg.
4.2.2. Seasonal temporal analysis
A set of 123 sequences are reported and have a minimum support of 0.001, median support of 0.005, and maximum support of 0.78. The
most frequent items appearing in these sequences is class NonVeg, and the least is the River as follows: (a) NonVeg : 83 appearances, (b)
Veg : 42 appearances, (c) MineBare : 28 appearances, (d) IsolatedWater : 26 appearances, (e) MinePonds : 22 appearances, and (f) River : 27 appearances.
A subset of the 9 sequences is shown in Table 4 where the selected supports are those higher than 0.01. The results show a decrease in the support of consistent vegetation and an increase in the transition be-tween vegetated and non-vegetated areas (sequence Veg → NonVeg →
Veg) mainly due to the dry to wet seasonal change reaching at 55%
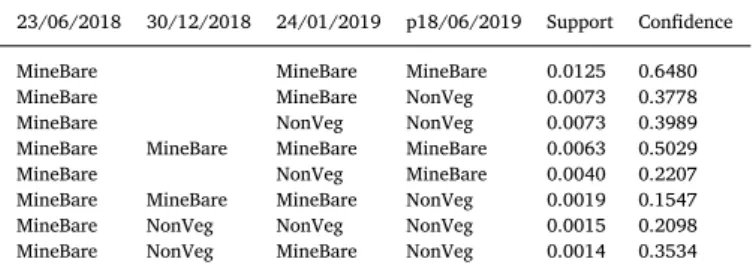
chance of change. Table 5 shows that there is a 50% to 60% chance that MineBare will remain classified as that class or can change to NonVeg class.
4.2.3. Selected change detection
Fig. 7 shows the detected mined areas covered by MineBare and MinePond classes and their variations throughout the years and the seasons from mid 2018 to mid 2019. The considered sequences are all those with MineBare and MinePonds existing in the four images con-sidered for the annual analysis. It can be noticed that there is a re-duction in the detected mining areas from 2016 to 2019. On the other hand, there is more mining activity in the dry season than in the wet season, as expected i.e. dry season in December 2018 and January 2019. The non-increase in mining operations is not surprising for the area due to increased control of illegal mining activities in the area over the last few years, such as the latest in January and May 2019 reported here: https://sostenibilidad.semana.com/medio-ambiente/articulo/ golpe-a-mineria-ilegal-en-antioquia/42703 and https://www.policia. gov.co/noticia/intervencion-mineria-ilegal-cauca-antioqueno.
Fig. 8 show persistent mining areas from 2016 to 2019 and is equivalent to 0.4 km2. Considering the areas mined in June 2019
reaching 1.44 km2, persistent mining accounts for approximately 28%
of the total mined area. This persistence captures the behavior of the miners where there can be subsequent excavations by different informal groups. Fig. 9 shows the areas transformed from vegetated areas to mining areas, showing that a total of vegetated areas of about 0.5 km2
has been lost to mining activities since 2016, corresponding to about
Fig. 6. Post-SVM processing results of S2 imagery. Table 2
Sequences with support higher than 0.05.
08/07/2016 03/07/2017 23/06/2018 p18/06/2019 Support Confidence Veg Veg 0.7531 0.9386 Veg Veg Veg 0.6820 0.9057 Veg Veg Veg Veg 0.5204 0.7631
NonVeg NonVeg 0.2328 0.5593 Veg NonVeg 0.1983 0.2472 NonVeg Veg 0.1868 0.4489 NonVeg NonVeg NonVeg 0.1438 0.6179 Veg Veg NonVeg 0.1209 0.1605 NonVeg Veg Veg 0.1106 0.5922 NonVeg NonVeg NonVeg NonVeg 0.0849 0.5904 Veg NonVeg Veg 0.0757 0.3820 NonVeg Veg Veg Veg 0.0503 0.4549
Table 3
All sequences starting with class MineBare in the 2016 image.
08/07/2016 03/07/2017 23/06/2018 p18/06/2019 Support Confidence MineBare NonVeg NonVeg 0.0138 0.6121 MineBare MineBare MineBare 0.0083 0.4733 MineBare MineBare NonVeg 0.0074 0.4217 MineBare MineBare MineBare MineBare 0.0040 0.4891 MineBare NonVeg NonVeg NonVeg 0.0040 0.2890 MineBare MineBare NonVeg NonVeg 0.0032 0.4284 MineBare NonVeg MineBare 0.0026 0.1154 MineBare MineBare MineBare NonVeg 0.0017 0.2022 MineBare MinePonds NonVeg 0.0010 0.4469
35% of active mining areas and ponds of June 2019. On the other hand, Fig. 10 shows the areas that have been recovered to vegetated areas from mining activities, and that they correspond only to about 0.1 km2
mainly for areas that halted mining in 2016, thus accounting for 7% of the total excavated areas in June 2019. As mining persisted in 2017 and 2018, fewer areas recovered, showing that the impact of mining re-quires a much longer period for potential natural recovery since the majority of the activities are informal where miners do not mitigate the land once activities are stopped.
4.2.4. Vegetation regeneration
As the sequential patterns revealed, major sequences contained a transition of MineBare to NonVeg classes. Thus, in order to assess the progress of revegetation of mined areas, it is of interest to consider vegetation signature change in these transition areas. Areas that were classified as NonVeg areas on 18/06/2019 while classified previously as MineBare were compared using NDVI. Higher NDVI reflected an in-crease in vegetation cover, where a lower value shows a dein-crease. NDVI values of these areas were also compared to MineBare areas and Veg areas of the same image (Fig. 11). The results show that the average NDVI value of these areas is higher than MineBare areas. Also, they show an increase in average NDVI values with older transformations from MineBare to NonVeg, i.e. increase in NDVI the older the halt of mining activities. Yet in a two-year period, NDVI is still much lower than average NDVI of areas classified as vegetated areas. Thus, the
natural recovery of the mined areas surely requires more than two years since the stop of mining activities.
5. Implications for stakeholders
The sustainable use of natural resources is essential for all stake-holders in the mining sector. Informed dialogue, decision making, and monitoring are the foundation for sustainability objectives and can only be achieved through transparency and the equalization of information at the level of individual mining sites. Copernicus satellite acquisitions can greatly contribute to that through the free-access to high quality geospatial information. On the other hand, MapX provides the tech-nology and monitoring tools to manage, analyze, visualize, and share available information.
The paper considers only a small study area, yet the approach will be utilized to map various areas in the country, and to understand the dynamics in landcover over a period of time. Stakeholders have been consulted for this work in 2018 and 2019 including formal and informal miners, local mining and environmental authorities of El Bagre, Corantioquia, Ministry of Mines and Energy, the Ministry of Environment and Sustainable Development, and UNEP. MapX allows the researchers to share the findings with those entities in an interactive manner. Thus outcomes of the research create a better understanding of the dynamics in the mining areas and their possible recovery timeline. This is essential to clearly assess the impacts of such activities and to plan suitable approaches for mitigation. These results are included in MapX which allows a view of the results with the available national database that includes layers of protected areas, socio-economic data, conflict statistics, etc. The results of the research will be available at different levels to the public, to relevant local authorities, mining op-erators and to local communities, national and international organiza-tions. This aims for improved dialogue among the different parties for better decision making. Thus, the aim is to extend this research on a larger-scale and to include possible management options such as miti-gation efforts or intervention prioritization. The main output for the current study have been published on a private space on MapX that can accessed by stakeholders. A public storymap has been created and can be accessed from (English) https://app.mapx.org/static.html?project= MX-RQK-6E8-WLA-GBV-QBF&views=MX-OZI0O-9YLHC-DSBRX& zoomToViews=true&language=en& and (Spanish) https://app.mapx. org/static.html?project=MX-RQK-6E8-WLA-GBV-QBF&views=MX- U9E0Y-3K2O8-IFGSP&zoomToViews=true&language=en&h. When agreed upon by stakeholders, each dataset or group of datasets can also be shared through a unique URL for dissemination on social media or inclusion into a website through the use of an iframe.
6. Conclusion
Alluvial mining in Colombia is mainly informal and is located in remote areas. In order to understand impacts of this mining and to plan or monitor any remediation efforts, Earth observation can be a great
Table 4
Sequences with support higher than 0.01.
23/06/2018 30/12/2018 24/01/2019 p18/06/2019 Support Confidence Veg Veg 0.7263 0.9256 Veg Veg Veg 0.6481 0.8922 Veg Veg Veg Veg 0.4956 0.7647
NonVeg NonVeg 0.2716 0.6095 Veg NonVeg 0.2381 0.3035 NonVeg Veg 0.2018 0.4527 NonVeg NonVeg NonVeg 0.1732 0.6376 Veg NonVeg Veg 0.1303 0.5474 Veg Veg NonVeg 0.1276 0.1757
Table 5
All sequences starting class MineBare in mid 2018.
23/06/2018 30/12/2018 24/01/2019 p18/06/2019 Support Confidence MineBare MineBare MineBare 0.0125 0.6480 MineBare MineBare NonVeg 0.0073 0.3778 MineBare NonVeg NonVeg 0.0073 0.3989 MineBare MineBare MineBare MineBare 0.0063 0.5029 MineBare NonVeg MineBare 0.0040 0.2207 MineBare MineBare MineBare NonVeg 0.0019 0.1547 MineBare NonVeg NonVeg NonVeg 0.0015 0.2098 MineBare NonVeg MineBare NonVeg 0.0014 0.3534
tool to provide guidance and a better understanding of the activities in an integrated manner with high spatial and temporal coverage. This paper addresses a study site in a highly resourceful part of Antioquia and creates an approach for a better understanding of mining evolution in the area using freely available Sentinel-2 data. The methods can be easily used for other areas and with larger coverage. This paper con-siders mining zones around the town of El Bagre in the municipalities of El Bagre and Zaragoza. It addresses the evolution of mining from 2016 to 2019 that shows mined areas covering 1.44 to 1.92 km2. It detects
the locations of the mining zones including mined bare soil and mining ponds and other important land cover; namely vegetated and non-ve-getated areas and water bodies. Sequential pattern mining of classified images shows the likelihood of certain annual and seasonal changes in mining-impacted landcover and in the natural vegetation. The temporal analysis revealed a slight reduction in the detected mining areas from 2016 to 2019. On the other hand, more mining activity was detected in
the dry season than in the wet season. Regarding the natural vegetation, the annual analysis of images acquired in June and July shows that there is 50% to 70% chance that vegetated areas in 2016, 2017, and 2018 remained vegetated in 2019. Yet, the seasonal analysis from mid 2018 to mid 2019 shows that there is a 55% chance that vegetated areas in the wet season would transform into non vegetated areas in the dry season. Excavated areas of bare soil have a 50% chance remain in ex-cavation over the considered period or they transition to non-vegetated areas or mining ponds. Persistently mined areas of bare soil and ponds throughout the considered period account for approximately 28% of the total mined area detected in June 2019. Vegetation loss due to the extractive activities corresponds to about 35% while recovered vege-tated areas are 7% of the total excavated areas in June 2019. An ana-lysis of abandoned sites using NDVI shows that it takes a much longer period than the one considered in this paper for potential natural re-covery of vegetation. Finally, the work includes data dissemination
Fig. 8. Persistently mined areas from 2016 to 2019 (MineBare and MinePonds) shown in red overlain on a Sentinel-2 image acquired on 30/12/2018.
among stakeholders and the public on MapX (https://mapx.org), an online open platform for mapping and visualizing geospatial data on natural resources. This work a pilot study that leads to the analysis of several areas in Antioquia, covering larger regions impacted by placer mining.
Conflict of interest
The authors declare no conflict of interest. Declaration of Competing Interest
The authors report no declarations of interest. Acknowledgements
This research was funded by the Copernicus RawMatCop pro-gramme funded by EIT RawMaterials and the European Commission DG Internal Market, Industry, Entrepreneurship and SMEs (DG GROW). https://eitrawmaterials.eu/eit-rm-academy/rawmatcop/, in the scope of project CopX: Geospatial mining transparency through Copernicus and MapX.
The authors would like to express great appreciation to several
persons who made this work possible. (a) UNEP office Geneva, cially David Jensen and Inga Petersen, (b) UNEP Bogota Office, espe-cially Juan Bello, Juliana Ibarra, Silvio Lopez, and Ursula Jaramillo, (c) the secretary of mines at El Bagre Rafael Sanchez, (d) Corantioquia especially Janneth Zoraida Duque Quintero and Ana Castana, (e) and all the representatives of the national authorities who contributed to this work.
References
Andres, V., Espana, A., Rodriguez, A.R., Bardos, P., Naidu, R., 2018. Contaminated land in Colombia: a critical review of current status and future approach for the management of contaminated sites. Sci. Total Environ. 618, 199–209. https://doi.org/10.1016/j. scitotenv.2017.10.245.
Atibu, E.K., Lacroix, P., Sivalingam, P., Ray, N., Giuliani, G., Mulaji, C.K., Otamonga, J.p., Mpiana, P.T., Slaveykova, V.I., Pote, J., 2018. High contamination in the areas sur-rounding abandoned mines and mining activities: an impact assessment of the Dilala, Luilu and Mpingiri rivers, democratic Republic of the Congo. Chemosphere 191, 1008–1020. https://doi.org/10.1016/j.chemosphere.2017.10.052.
Bernal, M., 2016. Mineria de oro en Colombia: Auge y Problematica. (Online). https:// revistadelogistica.com/actualidad/mineria-de-oro-en-colombia-auge-y-
problematica/.
Betancur-Corredor, B., Loaiza-Usuga, J.C., Denich, M., Borgemeister, C., 2018. Gold mining as a potential driver of development in Colombia: challenges and opportu-nities. J. Clean. Prod. 199, 538–553. https://doi.org/10.1016/j.jclepro.2018.07.142. Boyd, D.S., Jackson, B., Wardlaw, J., Foody, G.M., Marsh, S., Bales, K., 2018. Slavery from space: demonstrating the role for satellite remote sensing to inform evidence-based
Fig. 10. Vegetation recovery from MineBare and MinePonds overlain on a Sentinel-2 image acquired on 30/12/2018.
Fig. 11. Boxplot of NDVI calculated for the Sentinel-2 image acquired on 18/06/2019 for NonVeg areas that were previously classified as MineBare, benchmarked
action related to UN SDG number 8. ISPRS J. Photogramm. Remote Sens. 142, 380–388. https://doi.org/10.1016/j.isprsjprs.2018.02.012.
Bustamante, N., Danoucaras, N., McIntyre, N., Diaz-Martinez, J.C., Restrepo-Baena, O.J., 2016. Review of improving the water management for the informal gold mining in Colombia. Revista Facultad de Ingeniería Universidad de Antioquia 79, 174–184.
https://doi.org/10.17533/udea.redin.n79a16.
Carstens, J., 2017. European Policy Brief – Strategic Dialogue on Sustainable Raw Materials for Europe (STRADE) No. 09/2017: The Artisanal and Small-Scale Mining (ASM) Sector and its Importance for EU Cooperation with Resource-Rich Developing and Emerging countries. (Tech. Rep.). www.STRADEproject.eu.
Chen, V.Y.c., Lin, J.C., Tzeng, l.G.H., 2019. Assessment and improvement of wetlands environmental protection plans for achieving sustainable development. Environ. Res. 169 (33), 280–296. https://doi.org/10.1016/j.envres.2018.10.015.
Cordy, P., Veiga, M.M., Salih, I., Al-saadi, S., Console, S., Garcia, O., Alberto, L., Velásquez-lópez, P.C., Roeser, M., 2011. Science of the total environment mercury contamination from artisanal gold mining in Antioquia, Colombia: the world's highest per capita mercury pollution. Sci. Total Environ. 410–411, 154–160. https://doi.org/ 10.1016/j.scitotenv.2011.09.006.
Council, W.G., 2018. Gold Demand Trends. (accessed January 2019) (Online). https:// www.gold.org/.
Csillik, O., Asner, G.P., 2020. Aboveground carbon emissions from gold mining in the peruvian amazon. Environ. Res. Lett. 15 (1), 014006. https://doi.org/10.1088/1748- 9326/ab639c.
Dane, I.I., 2011. Reporte no. 5 de Áreas afectadas por inundaciones 2010–2011. techre-port. (accessed February 2019). https://www.dane.gov.co/files/noticias/Reporte_ cinco.pdf.
Diaz, D., Buchta, M.C., 2019. Package Arules Sequences’ vs.0. 2-22. (Tech. Rep.).
https://cran.r-project.org/web/packages/arulesSequences/arulesSequences.pdf. Drusch, M., Del Bello, U., Carlier, S., Colin, O., Fernandez, V., Gascon, F., Hoersch, B.,
Isola, C., Laberinti, P., Martimort, P., Meygret, A., Spoto, F., Sy, O., Marchese, F., Bargellini, P., 2012. Sentinel-2: ESA's optical high-resolution mission for GMES op-erational services. Remote Sens. Environ. 120, 25–36. https://doi.org/10.1016/j.rse. 2011.11.026.
García, O., Veiga, M., Cordy, P., Suescún, O., Martin, J., Roeser, M., 2015. Artisanal gold mining in Antioquia, Colombia: a successful case of mercury reduction. J. Clean. Prod. 90, 244–252. https://doi.org/10.1016/j.jclepro.2014.11.032.
Hausermann, H., Ferring, D., Atosona, B., Mentz, G., Amankwah, R., Chang, A., Hartfield, K., Effah, E., Asuamah, G.Y., Mansell, C., Sastri, N., 2018. Land-grabbing, land-use transformation and social differentiation: deconstructing “small-scale” in Ghana's recent gold rush. World Dev. 108, 103–114. https://doi.org/10.1016/j.worlddev. 2018.03.014.
Huynh, B., Trinh, C., Huynh, H., Van, T., Vo, t.B., Snasel, V., 2018. An efficient approach for mining sequential patterns using multiple threads on very large databases. Eng. Appl. Artif. Intell. 74 (2018), 242–251. https://doi.org/10.1016/j.engappai.2018.06. 009.
Ibrahim, E., Kim, W., Crawford, M., Monbaliu, J., 2017. A regression approach to the mapping of bio-physical characteristics of surface sediment using in situ and airborne hyperspectral acquisitions. Ocean Dyn. 67 (2), 299–316. https://doi.org/10.1007/ s10236-016-1024-1.
IDEAM, 2019. Instituto de hidrología, Meteorología y estudios ambientales: Antioquia. pp. 9. (Online, accessed February). http://atlas.ideam.gov.co/basefiles/antioquia_ texto.pdf.
Isidro, C.M., McIntyre, N., Lechner, A.M., Callow, I., 2017. Applicability of earth ob-servation for identifying small-scale mining footprints in a wet tropical region. Remote Sens. 9, 945. https://doi.org/10.3390/rs9090945.
Kranjcic, N., Medak, D., Zupan, R., Rezo, M., 2019. Support vector machine accuracy assessment for extracting green urban areas in towns. Remote Sens. 11 (655), 1–13.
https://doi.org/10.3390/rs11060655.
Lacroix, P., Moser, F., Benvenuti, A., Piller, T., Jensen, D., Petersen, I., Planque, M., Ray, N., 2019. Mapx: an open geospatial platform to manage, analyze and visualize data on natural resources and the environment. SoftwareX 9, 77–84. https://doi.org/10. 1016/j.softx.2019.01.002. http://www.sciencedirect.com/science/article/pii/ S2352711018300177.
Lara-Rodríguez, J.S., 2018. All that glitters is not gold or platinum: institutions and the use of mercury in mining in Chocó Colombia. Extr. Ind. Soc. 5 (3), 308–318. https:// doi.org/10.1016/j.exis.2018.03.011.
Liu, D., Xia, F., 2010. Assessing object-based classification: advantages and limitations. Remote Sens. Lett. 1 (4), 187–194. https://doi.org/10.1080/01431161003743173.
Louis, J., Debaecker, V., Pflug, B., Main-Knorn, M., Bieniarz, J., Mueller-Wilm, U., Cadau, E., Gascon, F., 2016. Sentinel-2 SEN2COR: L2A Processor for Users. European Space Agency, (Special Publication) ESA SP SP-740(May), pp. 9–13.
Martinez, Z.Q., 2018. Evaluación de las condiciones fisicoquímicas y la composición de algas fitoplanctonicas en lagunas derivadas de la actividad minera mecanizada en diferentes periodos de abandono, en el municipio de Cértegui, Chocó. Master thesis.
Universidad De Manizales Centro De Investigaciones en Medio Ambiente Y Desarrollo “CIMAD”.
McInerney, D., Kempeneers, P., Marron, M., Mcroberts, R.E., 2019. Analysis of broadleaf encroachment in coniferous forest plantations using multi-temporal satellite imagery. Int. J. Appl. Earth Obs. Geoinf. 78 (February), 130–137. https://doi.org/10.1016/j. jag.2018.12.005.
Ministerio de Minas y Energía, C. Decreto 1666, Bogotá. (accessed January 2019) (Online). https://www.minminas.gov.co/documents/10180/23517/37238-Decreto- 1666-21Oct2016.pdf/17f4f90c-4481-47cd-a084-c7fa0319f9cf.
Mountrakis, G., Im, J., Ogole, C., 2011. Support vector machines in remote sensing: a review. ISPRS J. Photogramm. Remote Sens. 66 (3), 247–259. https://doi.org/10. 1016/j.isprsjprs.2010.11.001.
Myint, S.W., Gober, P., Brazel, A., Grossman-Clarke, S., Weng, Q., 2011. Per-pixel vs. object-based classification of urban land cover extraction using high spatial resolu-tion imagery. Remote Sens. Environ. 115 (5), 1145–1161. https://doi.org/10.1016/j. rse.2010.12.017. http://www.sciencedirect.com/science/article/pii/
S0034425711000034.
Nations, U., 2019. Sustainable Development Goals. https://sustainabledevelopment.un. org/sdgs.
Obodai, J., Amaning, K., Nii, S., Lumor, M., 2018. Remote sensing applications: society and environment land use/land cover dynamics using landsat data in a gold mining basin: the Ankobra, Ghana. Remote Sens. Appl.: Soc. Environ. 13 (October 2018), 247–256. https://doi.org/10.1016/j.rsase.2018.10.007.
Pal, M., Mather, P.M., 2005. Support vector machines for classification in remote sensing. Int. J. Remote Sens. 26 (5), 1007–1011. https://doi.org/10.1080/
01431160512331314083.
Parthasarathy, S., Zaki, M.J., Li, W., 1998. Memory placement techniques for parallel association mining. KDD-98 Proceedings.
Pedregosa, F., Varoquaux, G., Gramfort, A., Michel, V., Thirion, B., Grisel, O., Blondel, M., Prettenhofer, P., Weiss, R., Dubourg, V., Vanderplas, J., Passos, A., Cournapeau, D., Brucher, M., Perrot, M., Duchesnay, E., 2011. Scikit-learn: machine learning in Python. J. Mach. Learn. Res. 12, 2825–2830.
Power, T., 2002. Digging to development? A Historical Look at Mining and Economic Development. University of Montana, Oxfam (Tech. Rep.). http://scholar.google. com/scholar?hl=en&btnG=Search&q=intitle:Digging+to+Development+?#1. Rettberg, A., Ortiz-Riomalo, J.F., 2016. Golden opportunity, or a new twist on the
re-source-conflict relationship: links between the drug trade and illegal gold mining in Colombia. World Dev. 84, 82–96. https://doi.org/10.1016/j.worlddev.2016.03.020. Smith, N.M., Ali, S., Bofinger, C., Collins, N., 2016. Human health and safety in artisanal and small-scale mining: an integrated approach to risk mitigation. J. Clean. Prod. 129, 43–52. https://doi.org/10.1016/j.jclepro.2016.04.124.
Smola, A.J., Olkopf, B.S.C.H., 2004. A tutorial on support vector regression. Stat. Comput. 14, 199–222.
Snapir, B., Simms, D., Waine, T., 2017. Mapping the expansion of galamsey gold mines in the cocoa growing area of Ghana using optical remote sensing. Int. J. Appl. Earth Obs. Geoinf. 58, 225–233. https://doi.org/10.1016/j.jag.2017.02.009. http://linkinghub. elsevier.com/retrieve/pii/S0303243417300351.
Telmer, K., Stapper, D., 2007. Evaluating and Monitoring Small Scale Gold Mining and Mercury Use: Building a Knowledge-base with Satellite Imagery and Field Work. UNIDO PROJECT EG/GLO/01/G34 (Tech. Rep.).
Teschner, B., Smith, N.M., Borrillo-hutter, T., Quaghe, Z., Wong, T.E., 2017. How efficient are they really? a simple testing method of small-scale gold miners’ gravity separation systems. Miner. Eng. 105, 44–51. https://doi.org/10.1016/j.mineng.2017.01.005. UNITAR, 2016. Satellite Mapping of Artisanal and Small Scale Gold Mining in Central Kalimantan, Indonesia UNITAR's Operational Satellite Applications Programme. (Tech. Rep.). https://wedocs.unep.org/bitstream/handle/20.500.11822/11526/ UNOSAT_Central_Kalimantan_Report_Feb2016o.pdf?sequence=1& %3BisAllowed=.
UNODC, 2018. Alluvial Gold Exploitation: Evidences from Remote Sensing 2016. United Nations office of Drugs and Crime (Tech. Rep.). http://www.biesimci.org/ Documentos/Documentos.html.
Vargas, L., 2012. Diagnoostico De La Calidad Ecoloogica a Travees De Algas Perifiiticas en Escenarios Hidricos Afectados Por Mineria a Cielo Abierto Con Diferente Temporalidad, Jigualito, Condoto, Choco. Master's Thesis. University of Antioquia. Wu, X., Zhang, X., 2019. An efficient pixel clustering-based method for mining spatial sequential patterns from serial remote sensing images. Comput. Geosci. 124 (January 2018), 128–139. https://doi.org/10.1016/j.cageo.2019.01.005.
Yang, Y., Erskine, P.D., Lechner, A.M., Mulligan, D., Zhang, S., Wang, Z., 2018. Detecting the dynamics of vegetation disturbance and recovery in surface mining area via Landsat imagery and LandTrendr algorithm. J. Clean. Prod. 178, 353–362. https:// doi.org/10.1016/j.jclepro.2018.01.050.
Zaki, M.J., 2001. SPADE: an efficient algorithm for mining frequent sequences. Mach. Learn. 42, 31–60.