Publisher’s version / Version de l'éditeur:
Vous avez des questions? Nous pouvons vous aider. Pour communiquer directement avec un auteur, consultez la première page de la revue dans laquelle son article a été publié afin de trouver ses coordonnées. Si vous n’arrivez pas à les repérer, communiquez avec nous à PublicationsArchive-ArchivesPublications@nrc-cnrc.gc.ca.
Questions? Contact the NRC Publications Archive team at
PublicationsArchive-ArchivesPublications@nrc-cnrc.gc.ca. If you wish to email the authors directly, please see the first page of the publication for their contact information.
https://publications-cnrc.canada.ca/fra/droits
L’accès à ce site Web et l’utilisation de son contenu sont assujettis aux conditions présentées dans le site LISEZ CES CONDITIONS ATTENTIVEMENT AVANT D’UTILISER CE SITE WEB.
11th International Building Performance Simulation Association (IBPSA)
Conference [Proceedings], p. 10, 2009-07-27
READ THESE TERMS AND CONDITIONS CAREFULLY BEFORE USING THIS WEBSITE.
https://nrc-publications.canada.ca/eng/copyright
NRC Publications Archive Record / Notice des Archives des publications du CNRC :
https://nrc-publications.canada.ca/eng/view/object/?id=ef0db606-77b8-46e5-a74e-1ea82d9a5e92 https://publications-cnrc.canada.ca/fra/voir/objet/?id=ef0db606-77b8-46e5-a74e-1ea82d9a5e92
NRC Publications Archive
Archives des publications du CNRC
This publication could be one of several versions: author’s original, accepted manuscript or the publisher’s version. / La version de cette publication peut être l’une des suivantes : la version prépublication de l’auteur, la version acceptée du manuscrit ou la version de l’éditeur.
Access and use of this website and the material on it are subject to the Terms and Conditions set forth at
Field summer performance of interior reflective screen shades for
residential windows
Galasiu, A. D.; Laouadi, A.; Armstrong, M. M.; Swinton, M. C.; Szadkowski,
F.
http://www.nrc-cnrc.gc.ca/irc
Fie ld sum m e r pe rform a nc e of int e rior re fle c t ive sc re e n
sha de s for re side nt ia l w indow s
N R C C - 5 1 4 1 8
G a l a s i u , A . D . ; L a o u a d i , A . ; A r m s t r o n g , M . ;
S w i n t o n , M . C . ; S z a d k o w s k i , F .
J u l y 2 0 0 9
A version of this document is published in / Une version de ce document se trouve dans:
The 11th International Building Performance Simulation Association (IBPSA)
Conference (University of
Strathclyde in Glasgow, Scotland, July 27-30, 2009),
pp. 1-10
The material in this document is covered by the provisions of the Copyright Act, by Canadian laws, policies, regulations and international agreements. Such provisions serve to identify the information source and, in specific instances, to prohibit reproduction of materials without written permission. For more information visit http://laws.justice.gc.ca/en/showtdm/cs/C-42
Les renseignements dans ce document sont protégés par la Loi sur le droit d'auteur, par les lois, les politiques et les règlements du Canada et des accords internationaux. Ces dispositions permettent d'identifier la source de l'information et, dans certains cas, d'interdire la copie de documents sans permission écrite. Pour obtenir de plus amples renseignements : http://lois.justice.gc.ca/fr/showtdm/cs/C-42
FIELD SUMMER PERFORMANCE OF INTERIOR REFLECTIVE SCREEN
SHADES FOR RESIDENTIAL WINDOWS
A.D. Galasiu, A. Laouadi
*, M.M. Armstrong, M.C. Swinton, and F. Szadkowski
Institute for Research in Construction, National Research Council Canada, 1200 Montreal
Road, Ottawa, Ontario, Canada, K1A 0R6
Fax: +1 613 954 3733
Tel: +1 613 990 6868 Email: aziz.laouadi@nrc-cnrc.gc.ca
ABSTRACT
Recent statistics published by Natural Resources Canada estimates that the energy demand for heating and cooling accounts for ~60% of the total energy use of an average Canadian home. Although the overall demand for cooling energy is much lower than the demand for heating, many populated areas experience a peak demand for electricity on summer afternoons. Interior reflective window shading devices have the potential to reduce solar overheating and electricity peak demand in the summer, and to improve the thermal comfort of the house occupants when seated near windows. This work is part of a project aiming to develop guidelines for effective exterior, mid-pane (inside the window) and interior shading devices in Canadian residences. This paper presents the results of three weeks of summer field measurements of interior highly reflective perforated shading screens installed on the windows of a typical two-storey detached house compared to typical interior Venetian blinds installed in an identical neighbouring house.
The shading devices were closed in both houses during both daytime and night-time in order to assess the maximum possible savings in cooling energy on a 24-hour basis. The results showed that the daily total electric energy used by the air-conditioning unit and the furnace circulation fan in the house equipped with interior screen shades was on average ~8±2% lower than in the house equipped with interior blinds. The savings in daily energy used by the air-conditioning unit alone ranged between 10-18%. The interior screen shades also reduced the hourly electricity demand for cooling by up to 45% during a sunny day, which represents one of the most important benefits of this window shading strategy by having reduced the demand load on the electricity supply system during high-peak demand hours.
INTRODUCTION
In Canada, the energy demand for heating and cooling accounts for 60% of the total energy use of the average home (NRCan, 2006). Although the overall demand for cooling energy is much lower than that for heating, many populated areas experience a peak demand for electricity on summer afternoons. Interior shading devices are common in Canadian residential buildings and houses. They are used for various purposes, including the control of privacy, overheating and furniture fading. Interior movable reflective shading devices may reduce the energy use and peak demand for cooling and improve the thermal comfort conditions near windows, but they may also increase the risk of glass breakage due to excessive temperatures, particularly when used with high performance windows. Furthermore, field observations showed that the use of highly reflective solar shades is very limited, likely due to a lack of occupant awareness towards their energy saving potential, or because of their cost and aesthetics. In addition, the relative effect of reflective shades compared to typical (absorptive) interior shades is not known. Knowing this shading effect is important for both the design of new houses, where high performance windows are becoming the standard, and for the retrofitting of old houses, which employ conventional windows. A previous field study conducted in the same research facility showed that the daytime cooling energy used by a house with interior Venetian blinds covering its south-facing windows was 10-12% lower than that used by a house with uncovered windows (Galasiu et al., 2005). When opaque exterior shades consisting of white plastic panels were used instead of Venetian blinds, the daytime cooling energy was 70% lower compared to uncovered windows. These experiments also showed that the exterior shades outperformed the
interior Venetian blinds by 25% when both were closed during a 24-hour period.
Subsequent summer experiments resulted in daily cooling energy savings of up to 27% when reflective interior shades made of aluminum foil bubble wrap were used, and the seasonal cooling energy savings were estimated to be 10% when compared with windows covered by interior Venetian blinds with slats horizontal (Manning et al., 2006). These experiments also showed that the reflective interior shades substantially increased the glass interior surface temperature by more than 25ºC when used with high performance windows with low-e coating and argon gas fill. Large temperature differences (~30ºC) were also observed between the glass centre and its edge. Excessive glass temperatures and thermal stresses due to temperature differences between the centre and the edge of the glass are not desirable as the durability of the window components may be jeopardized (glass breakage, spacer seal, gas ex-filtration, etc.) if these components are not designed to withstand high temperatures.
OBJECTIVES
This work is part of a project aiming to develop guidelines for effective window solar shades for Canadian houses when using: (1) movable exterior shading devices; (2) between-panes reflective blinds; and (3) various interior reflective solar shading devices. The project investigates the following issues:
• thermal peak loads and energy use for heating and cooling of Canadian houses;
• energy costs and paybacks;
• occupant thermal and visual comfort;
• potential risk of condensation and thermal stresses on conventional and high performance windows;
• homeowners use and control of shading devices, and how these factors affect the energy demand.
This paper presents the results of three weeks of summer energy performance and occupant thermal comfort measured in a house equipped with interior reflective shading screens compared with similar performance metrics measured in a reference house equipped with interior typical Venetian blinds. The data is also used to calibrate a whole-house energy simulation model, which will predict the effect of various types of window shading devices on the
cooling energy use in representative Canadian cities.
DESCRIPTION OF CCHT TWIN
HOUSES
The study took place at the Canadian Center for Housing Technology (CCHT) located in Ottawa, Ontario, at the Montreal Road campus of the National Research Council Canada. Built in 1998, the facility is jointly operated by the National Research Council Canada (NRC), Natural Resources Canada (NRCan), and Canada Mortgage and Housing Corporation (CMHC). The facility features two side-by-side twin-houses as shown in Figure 1. The house on the right is used as a baseline (Reference House), while the house on the left is used for the testing of advanced technologies (Test House). Both houses are two-storey high, have a total area of 210 m2 and replicate a popular model on the local residential market. They were built by a local builder according to the R-2000 standard, using regular construction technologies for the region.
Each house features 26 high performance double-glass windows with low-e coating, insulated spacer and 95% argon gas concentration, U-value = 1.65 W/m2K, SHGC = 0.72, and a north-facing glazed patio door with a total glass area of 24.14 m2. The windows are distributed as follows: 11 south-facing windows (10.22 m2); 12 north-facing windows (10.97 m2); one west-facing window (1.3 m2) and 2 east-facing windows (1.65 m2).
Both houses are equipped with a standard set of appliances (stove, dishwasher, washer and dryer) typically found in North American homes. The houses are unoccupied but include a simulated occupancy system that reproduces the daily water draws and electrical loads of a family of four. The internal heat gains from the occupants are also simulated using two 60 W (2 adults) and two 40 W (2 children) incandescent bulbs distributed at various locations in each house. The houses employ high efficiency gas furnaces for heating, continuous flow heat recovery ventilators and programmable thermostats located in the central hallway on the main floor. The set point temperature for cooling is fixed at 24ºC.
More details about the CCHT facility are available at: http://www.ccht-cctr.gc.ca/main_e.html.
Figure 1 The Twin-House Facility of the Canadian Center for Housing Technology (CCHT)
DESCRIPTION OF THE SHADING
DEVICES
The windows of the Reference House were fitted with a mix of common interior horizontal Venetian blinds (on most windows) and vertical blinds (on the patio glass door, dining room window and stairwell window). The slats of the Venetian blinds were slightly curved and made of aluminium with the following characteristics: slat spacing = 0.02 m, slat width = 0.025 m, slat visible reflectance = 63%. The vertical blinds were made of fabric with the following characteristics: slat spacing = 0.075 m, slat width = 0.090 m, slat visible reflectance = 71%. All interior blinds were mounted outside the window frames, leaving an open air space between the blinds and the wall incorporating the window frames.
Most of the windows of the Test House were fitted with interior reflective screen shades (known commercially as SilverScreen). Exempted were three north-facing windows (two located in the ground floor family room and one located in the 2nd floor bathroom), which were kept identical to those in the Reference House (with closed horizontal Venetian blinds). Previous experiments conducted with another type of shading devices mounted on these particular windows showed that they were continuously shaded by other construction elements of the house (the walls including these windows are slightly indented relative to other walls). Therefore, these windows were not provided with interior reflective screen shades as this would have not affected the energy balance of the house.
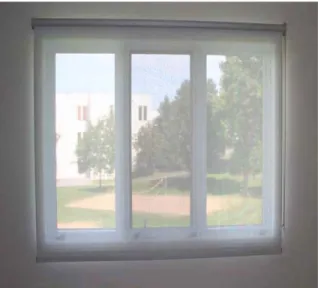
The screen shades were made of a 0.5 mm PVC-coated fiberglass material with an openess factor of
4%, which allowed a good view-through to the outside as shown in Figure 2. The surface facing the outside was aluminum-coated and had a solar reflectance of 77%. The surface facing the inside was painted white and had a solar reflectance of 71%. The normal solar/visible transmittance was 6%.
Figure 2 Close-up picture of the interior reflective and perforated screen shades installed on the windows of the Test House
MEASUREMENT SETUP
The measurements were conducted over a period of three weeks, from August 26 to September 15, 2008. The shading devices in both houses were closed at the beginning of the experiments and were left in a closed position until the end of the testing period.
The similarity between the two houses was verified before and after the reflective screen measurements through benchmarking tests conducted over a total of 12 discontinuous days with the houses in the same configuration. During the benchmark tests, the windows in both houses were equipped with interior Venetian blinds with slats in an open horizontal position. The theoretical assumption was that if the houses were completely identical, they would use the same amount of daily energy for cooling. However, in reality, due to small differences between the houses and the impossibility of synchronizing the cooling equipment perfectly, the daily energy use of the two houses was expected to be slightly different. By comparing the houses’ energy performance on multiple days a realistic trend was established to
indicate the performance of one house relative to the other. This benchmark correlation was used subsequently in the calculation of the energy savings generated by the reflective window screens. AIR TEMPERATURE AND RELATIVE
HUMIDITY
As part of the regular instrumentation each house had a thermocouple and a relative humidity sensor located on the ground floor. An exterior thermocouple and a relative humidity sensor were also located on the north side of the Reference House to measure the outdoor conditions.
ELECTRICAL ENERGY AND GAS USE
The electrical energy use of the furnace circulation fan and the furnace gas use were measured in each house on a 5-minute basis by individual electric meters with pulse output at a resolution of 0.6 Wh/pulse (2.0 Btu/pulse) and 1.4 L/pulse (0.05 ft3/pulse). Additional electric meters measured the energy use of the other electric end-users, including lights and appliances.
SOLAR RADIATION
Horizontal and south-facing vertical pyranometers were used to measure the horizontal and vertical global solar radiation (W/m2).
THERMAL COMFORT CONDITIONS NEAR WINDOWS
Environmental conditions important for thermal comfort (air temperature and velocity, globe temperature and relative humidity) were measured at a distance of 1.2 meters from the south-facing living room window and were used to calculate the predicted percentage of dissatisfied (PPD) index. This model is widely used and accepted in the design and field assessment of thermal comfort conditions and predicts the mean value of the thermal votes of a large group of people exposed to the same environment (ISO 7730, 1984; ANSI/ASHRAE 55-1992).
Globe temperature probes (for operative temperature measurements), thermocouples (for air temperature measurements) and hot wire anemometers (for air velocity measurements) were installed on a tripod at two occupant positions: seated, 0.6 meters from floor, and standing, 1.1 meters from floor (Figure 3). A horizontal illuminance meter was also used to measure daylight availability at a height of 0.6 meters from the floor. The globe temperature measurements, which incorporated the effect of the transmitted solar radiation, were used to estimate the mean radiant temperature necessary in the calculation of
the PPD index. An equivalent mean radiant temperature was defined to take into account this solar effect.
Figure 3 Probes for thermal and air measurements (air temperature and velocity, globe temperature and illuminance) near the south-facing window WINDOW AND SHADING TEMPERATURES
The south, west and north-facing windows in each house were equipped with thermocouples, which measured the surface temperature at one exterior location (center of glass), and four interior locations (center of glass, bottom/top edge of glass and sill). The thermocouples were secured to the windows and sill surfaces with conductive epoxy. Additional thermocouples were used for the south-facing windows on the ground floor, which measured the temperature of the interior blind slats and shading screen.
RESULTS
COOLINGENERGYUSE
The cooling energy data was analyzed using a side-by-side method, which compares the energy use of the Test House versus the energy use of the Reference House. Figure 4 shows the daily electrical energy use of the air-conditioning (A/C) unit and the circulation fan collected during the 12 summer days of benchmarking when the houses were operated in an identical configuration (discontinuous days between August 21 to September 23, 2008), compared to the daily electrical energy use during the testing of the reflective screen shades (August 26 to September 15, 2008). Similarly, Figure 5 shows the daily energy use of the A/C units alone during the same periods.
During the benchmark period, the maximum relative difference in daily electric energy use between the two houses was ~9%, however, calculated across the 12-day benchmarking period the average difference was only 2%. Both research houses used about 15 KWh/day for cooling (A/C unit plus circulation fan), with the A/C units using ~40% of this energy, the rest being required by the circulation fans. On average, the A/C units used about 6 kWh/day (each), whereas the circulation fans used about 9 kWh/day (each).
The testing of the reflective screen shades comprised days with a mix of sky conditions (2 clear sky, 11 clear/party cloudy sky and 8 overcast/partly cloudy sky), outdoor temperatures ranging from a minimum of +9ºC during night-time to a maximum +31ºC during daytime, and outdoor relative humidity levels between 28-99%.
The results show that under clear/partly cloudy sky conditions on days requiring cooling., the interior reflective shades decreased the total daily energy use of the Test House on average by ~8±2% compared to the Reference House, and the daily energy used by the A/C unit of the Test House was on average 13% lower than that used by the A/C unit of the Reference House. The maximum difference in A/C daily energy use recorded was about 18%, whereas the lowest difference was about 10%.
The reflective screen shades increased the temperature of the window glass by maximum 10-12ºC compared to the Venetian blinds. However, in both houses, regardless of the window orientation, the temperatures measured in the center of the glass interior surface were within maximum 5 to 10ºC from the temperatures measured on the glass edge, which suggests a low risk of glass breakage due to thermal stress. The maximum temperature recorded on the glass interior surface was always below 60ºC.
COOLINGPEAKLOAD
Figure 6 shows the hourly electricity demand profiles of the A/C units and circulation fans of the Test and Reference houses on a typical sunny day, (September 2, 2008). The electricity demand for cooling was lower in the house equipped with reflective screen shades compared to the house equipped with Venetian blinds. The maximum difference in electricity demand recorded under a clear sky was 45% and occurred around 2pm. Calculated across the 21-day measurement period, the average daily reduction in electricity demand during the on-peak period (11am to 5pm) was 19%.
It should be noted that the cooling requirement also peaked in both houses around 8pm due to the accumulated internal heat gains generated by the houses’ occupancy schedule and appliances. These results highlight an important benefit of the reflective shade strategy: significant on-peak demand reductions. Generally, electricity use is not constant throughout the day and the demand is higher on weekdays than during weekends and holidays. The electricity supply system needs to meet the demand on an instantaneous basis and a larger amount of electricity needs to be generated during the hours when the demand peaks. Particularly, peaks in electricity demand occur during heat-waves in the summer, especially during mid- to late afternoon hours. In the last few decades, electricity demand has also increased as more air conditioners were installed in both residential and business facilities.
COOLING ENERGY COST SAVINGS
In order to shift the load off the electricity supply system during high-demand hours, the Ontario Energy Board started the implementation of smart electricity meters and time-of–use (TOU) pricing throughout the province, a process scheduled to be completed by the end of 2010. The TOU pricing structure takes into account the specific season (summer or winter), the specific day (weekday, weekends, holidays), as well as the specific period of the day when the electricity is used, defining these periods as: off-peak hours (low demand), mid-peak hours (moderate demand) and on-peak hours (high demand). All weekdays from May 1 to October 31 are part of the TOU summer pricing structure, with the period from 11am to 5pm being considered on-peak, the periods between 7am to 11am and 5pm to 10pm being mid-peak, and off-peak from 10pm to 7am. The smart-meter TOU rates for the summer of 2008 were: 2.7/kWh (off-peak), 7.3c/kWh (mid-(off-peak), and 9.3c/kWh (on-peak) (IESO, 2008).
Table 1 presents the cost for electricity during the 21-days of the reflective shades measurements if billed according to the time-of-use (TOU) pricing structure. The screen shades reduced the average cost for cooling the Test House by 7% compared to the Reference House equipped with Venetian blinds (the total cost for air-conditioning the house with reflective screen shades would have been ~$18, whereas the cost for the house with Venetian blinds would have been ~$20).
THERMAL COMFORT CONDITION NEAR
Figure 7 shows on the right hand axis the operative temperatures measured at a height of 0.6 m from the floor surface and at a distance of 1.2 m from the living-room south-facing window, along with the calculated PPD indexes (left hand axis) for a clear sunny day (September 2). The PPD index was calculated for a sedentary person (household activity level=1.2 met) wearing typical summer household clothing (clo=0.5). PPD indexes below 10% and space temperatures between 20ºC to 24ºC are considered by standards to be acceptable thermal environments for residential applications (ISO 7730).
The thermal comfort conditions near the south-facing living-room window in the house equipped with reflective screen shades were only slightly better than those measured in the house equipped with Venetian blinds, especially during morning and evening hours. In both houses, the space operative temperatures were for two hours around mid-day about 3ºC above the comfort limit specified by the ISO 7730 standard, which, however, resulted in a very low PPD index of about 6%. In the Test House, the PPD index was mostly below 10% for most of the day, reaching maximum values of 22% during the evening hours. In the Reference House, the PPD index was slightly above 10% especially during night-time, reaching maximum values of 34% during some evening hours.
The higher PPD indexes obtained in the Reference House during night, morning and evening hours were due to the lower temperatures measured in this house in the absence of sunlight compared to those measured in the Test House (a difference of about 1-2 ºC), and the fact that typical summer household clothing and metabolic rates for a sedentary activity were considered in the PPD calculations. This is also the reason why very low PPD indexes (~5%) were obtain around noontime despite the fact that the operative temperatures were slightly above the ISO 7730 comfort limit.
CONCLUSION
Summer field measurements were conducted to assess the relative cooling energy performance of interior reflective screen shading devices versus typical interior blinds. Both types of shading devices were installed on the windows of two side-by-side typical Canadian houses and measurements of the electric energy used for cooling, as well as window surface temperatures and other conditions important for thermal comfort near windows were
collected for three consecutive weeks in the summer.
Results showed that the daily total electric energy used by the air-conditioning unit and the circulation fan in the house equipped with reflective screen shades was on average ~8±2% lower than in the house equipped with interior blinds. The savings in daily energy use of the air-conditioning unit alone ranged between 10-18% (average of 13%). The reflective shades also reduced the hourly electricity demand for cooling during sunny days by up to 45%. Calculated across the 21-day measurement period, the average daily reduction in electricity demand during the on-peak period (11am to 5pm) was 19%, which not only diminished the strain on the electricity supply system but would also decrease significantly the price of electricity for an end-user billed according to the time-of-use pricing structure. The results showed that both the reflective shades and the interior Ventian blinds resulted in similar thermal comfort conditions near the south facing windows.
ACKNOWLEDGMENT
This work was supported by the Institute for Research in Construction of the National Research Council Canada (NRC-IRC), CETC Buildings Group of Natural Resources Canada (NRCan), Canada Mortgage and Housing Corporation (CMHC), Ontario Power Authority, Hydro Quebec, Gas Metro Quebec, Pilkington USA, Prelco Inc., Talius, and Lutron Electronics Corporation USA. The authors are very grateful for all these contributions and support.
REFERENCES
ANSI/ASHRAE Standard 55-1992, Thermal
Environmental Conditions for Human Occupancy,
Atlanta: American Society of Heating, Refrigeration and Air-Conditioning Engineers, 1992.
Galasiu, A.D.; Reinhart, C.F.; Swinton, M.C.; Manning, M.M. Assessment of Energy Performance
of Window Shading Systems at the Canadian
Centre for Housing Technology, Research Report,
Institute for Research in Construction, National Research Council Canada, RR-196, 2005.
ISO Standard 7730-1984, Moderate Thermal Environments – Determination of the PMV and PPD Indices and Specification of the Conditions for Thermal Comfort, International Organization for Standardization.
Manning, M.M.; Swinton, M.C.; Ruet, K. Assessment of Reflective Interior Shades at the Canadian Centre for Housing Technology, B-6020, 2007, http://irc.nrc-cnrc.gc.ca/pubs/fulltext/b-6020/. Natural Resources Canada (NRCan), Energy Use Data Handbook, 1990 and 1998 to 2004, August 2006. (www.oee.nrcan.gc.ca/Publications). Accessed in May 2008.
Swinton, M.C.; Moussa, H.; Marchand, R.G. Commissioning twin houses for assessing the performance of energy conserving technologies, Performance of Exterior Envelopes of Whole Buildings VIII Integration of Building Envelopes, 2001.
Table 1 Daily total cost of electricity used for cooling during the reflective screen shades tests (A/C unit + circulation fan) calculated based on the August 2008 smart-meter time-of-use (TOU) pricing structure (Note: Highlighted rows indicate the weekends in the testing period with off-peak prices).
Daily Total Cost with Venetian blinds ($) Daily Total Cost with Screens ($) Cost Savings
(%) Sky Condition AM Sky Condition PM
26-Aug 0.96 0.84 12% clear/partly cloudy clear/partly cloudy
27-Aug 1.25 1.10 12% clear partly cloudy
28-Aug 1.50 1.37 8% overcast/partly cloudy partly cloudy
29-Aug 0.74 0.73 1% overcast overcast
30-Aug 0.57 0.53 8% partly cloudy clear
31-Aug 0.52 0.47 10% clear partly cloudy
1-Sep 1.71 1.51 12% clear clear
2-Sep 2.08 1.86 10% clear clear
3-Sep 2.14 1.94 9% clear partly cloudy
4-Sep 1.78 1.59 11% partly cloudy partly cloudy
5-Sep 1.67 1.49 10% partly cloudy partly cloudy
6-Sep 0.29 0.29 0% overcast overcast
7-Sep 0.24 0.23 3% overcast/partly cloudy partly cloudy/overcast
8-Sep 0.71 0.61 14% partly cloudy overcast
9-Sep 0.59 0.57 3% overcast partly cloudy
10-Sep 0.65 0.58 10% clear clear/partly cloudy
11-Sep 0.71 0.65 8% clear partly cloudy
12-Sep 0.49 0.51 -4% overcast overcast
13-Sep 0.33 0.32 3% overcast/partly cloudy overcast/partly cloudy
14-Sep 0.38 0.37 4% overcast/partly cloudy overcast/partly cloudy
15-Sep 0.53 0.54 -2% overcast/partly cloudy partly cloudy
y = 0.9664x + 0.8327 R² = 0.9971 y = 0.8855x + 0.7849 R² = 0.9966 0 5 10 15 20 25 30 0 5 10 15 20 25 30 Tes t H o u se A /C & C ir c ul at ion Fan D a il y El ec tr ic Ener gy U s e ( k W h )
Reference House A/C & Circulation Fan Daily Electric Energy Use (kWh)
benchmark
interior screen shading daily (24 hrs)
Figure 4 Daily electric energy used by the research houses for cooling (A/C plus circulation fan) during the reflective screen shades tests.
y = 0.9768x + 0.2386 R² = 0.9972 y = 0.8912x - 0.2719 R² = 0.9967 0 5 10 15 20 25 30 0 5 10 15 20 25 30 T e st H o u se A /C D ai ly E lect ri c E n er g y U se ( kW h )
Reference House A/C Daily Electric Energy Use (kWh)
benchmark
interior screen shading daily (24 hrs)
Figure 5 Daily electric energy used by the A/C units of the research houses during the reflective screen shades tests.
0 500 1000 1500 2000 2500 0:00 2:00 4:00 6:00 8:00 10:00 12:00 14:00 16:00 18:00 20:00 22:00 0:00 Ho u rl y Ave ra g e El e c tr ic De m a n d fo r C ool in g [W ] Time‐of‐day Ref House (W) Test House (W) Sep 2, 2008
Figure 6 Hourly average electric demand profiles of the research houses A/C units and circulation fans during the reflective screen shades tests under a clear sky (September 2).
0 5 10 15 20 25 30 35 0 10 20 30 40 50 60 70 80 90 100 0:00 2:00 4:00 6:00 8:00 10:00 12:00 14:00 16:00 18:00 20:00 22:00 0:00 Te m p e ra tu re (C ) PP D (% ) PPD Reference House PPD Test House Toperative: Reference House Toperative: Test House Top_lower_limit Top_upper_limit
Living-room south-facing window 2-Sep-08 (clear sky)
Figure 7 PPD index, operative temperature comfort limits and space operative temperatures at a height of 0.6m from the floor surface and at a distance of 1.2m from the living-room south-facing window on September 2, 2008