READ THESE TERMS AND CONDITIONS CAREFULLY BEFORE USING THIS WEBSITE. https://nrc-publications.canada.ca/eng/copyright
Vous avez des questions? Nous pouvons vous aider. Pour communiquer directement avec un auteur, consultez la première page de la revue dans laquelle son article a été publié afin de trouver ses coordonnées. Si vous n’arrivez pas à les repérer, communiquez avec nous à [email protected].
Questions? Contact the NRC Publications Archive team at
[email protected]. If you wish to email the authors directly, please see the first page of the publication for their contact information.
NRC Publications Archive
Archives des publications du CNRC
This publication could be one of several versions: author’s original, accepted manuscript or the publisher’s version. / La version de cette publication peut être l’une des suivantes : la version prépublication de l’auteur, la version acceptée du manuscrit ou la version de l’éditeur.
Access and use of this website and the material on it are subject to the Terms and Conditions set forth at
Calibration of a neutron soil moisture meter
Burn, K. N.
https://publications-cnrc.canada.ca/fra/droits
L’accès à ce site Web et l’utilisation de son contenu sont assujettis aux conditions présentées dans le site LISEZ CES CONDITIONS ATTENTIVEMENT AVANT D’UTILISER CE SITE WEB.
NRC Publications Record / Notice d'Archives des publications de CNRC:
https://nrc-publications.canada.ca/eng/view/object/?id=6f6d9a63-d4f6-4b8c-b3cb-d4efa97943b4 https://publications-cnrc.canada.ca/fra/voir/objet/?id=6f6d9a63-d4f6-4b8c-b3cb-d4efa97943b4
25.
Calibration of a Neutron Soil Moisture Meter
I(. N.
B
~
N
National Research Council, Division of Building Research, Ottawa, Canada
ABSTRACT Council of Canada in order to provide a
suitable device for measuring moisture content
I n both the design and the calibration of a changes in natural ground. A depth probe MTas neutron moisture meter, the following assump- constructed using a scintillation type of tions are made: all other atm.s present in soils detector for use with a battery- have such a hrge when wmpared to operated scaler.
hydrogen atoms that their in reducing the Initial laboratory calibration1 of the instru- energy of neutrons is negligible; the only ment was undertaken only after carefully reactions in which the neutrons are involved are selecting certain media whose bull; densities mechanical; and the hydrogen atoms Present in we, similar to those of natural soils and soils are only those chemically bonded to oxygen whose chemical properties included nothing in the form of water. Early workers stated that that might interfere in any with the any errorscausedb~ t h e s e a s s u m ~ t i m y except in physical process upon which the principle of a extreme cases, would be loo small to nxmure. neutron moisture meter is based. This cali- This inevitably led to the broader supposition bration embraced the range of moisture that, once calibrated, a neutron moisture meter densities from 0 to 62.4 1blcu ft.
wuld be used i n a n y t Y P e o f s o i l - * n a s s ~ ~ ~ ~ ~ o n Field checks which consisted of oven drying that ~ p e r i e n c e is now showing to be u?%wise. the samples obtained in the of a lined Experience in the use of a neutron hole a t which neutron moisture meter readings moisture meter in substitute media i n the were made, revealed a si*ificant discrepancy hborator~ and in natural soils led the dis- between measurements of moisture density by covery that actml neutron activities wuld di,fer the two method^.^ Chemical analysis of the soil by 11 ~ercentfromoneto the other- The e x ~ : p l a m - indicated that large percentages of iron were tion for this discrepancy appears to lie the present in the natural soil deposit, and even presence in the ??.&uTu~ soil of an elemestt .whose though the capture cross section of this capture cross section for neutrons
is
wm- element for neutrons is not much larger than paratively low but which occurs in such hrge that of some others present in the soil, it qmsttities that the absorption of neutrons is appeared t o occur in sufficiently large quan- signi$cant.
tities to explain the discrepancy that was dis- The design of a scintilhtion moisture meter, covered. Finally, a series of laboratory es- its calibration in the hboratory, and its sub- periments Tvas conducted using an iron salt sequeszt $eld as~essme7tt are described. !i''hose mixed into an artificial soil whose bulk density factors found to cause the discrepancy in i72str~- was in the range of natural soils and in which ment readings are also discussed. the ratio of iron content to water content wasequivalent to that in the natural soil d e p o ~ i t . ~ The design and development of a neutron The results of these experiments proved that moisture meter was carried out by the Division the presence of iron in the natural deposit has of Building Research of the National Research a sufficiently high absorption effect to account
206 MEASURING JfOISTURE IN LIQUIDS AND SOLIDS
for most of the observed reduction in slow neutron activity.
PRINCIPLE OF THE NEUTRON METER
This is discussed in detail in a number of publications, and ~x-ill be only very briefly mentioned here.
Simply stated, a neutron moisture meter is a detecting apparatus for neutrons of high initial energy, sloxved t o thermal velocities by the loss of kinetic energy in elastic collision with tlie nuclei of atoms of sinlilar mass. I n natural soils only hydrogen atoms fall into this category, the n e s t lightest element en- countered is about 10 times its mass and therefore much less effective than hydrogen. To add to its mechanical effectiveness in slowing neutrons, hydrogen presents a larger target t o the neutron than most other elements encountered in soils. Together, these prop- erties make hydrogen so effective in reducing the energy of emission neutrons t h a t it is assumed that the role played b y other atoms generally present in natural soils is negligible. Tn-o further assumptions are made in this use of a neutron meter:
( I ) ,&I1 hydrogen atoms detected are chemi- cally bonded t o oxygen atoms in the form of water. and
(2) S o other process is involved except the mechanical one of elastic collisions with neutrons emitted from a constant source.
I t seemed a simple matter to conform t o these basic assumptions, and it was considered, n-it11 some justification, t h a t a neutron moisture meter once calibrated, could be used in different soil types. Some found good agree- ment when the instrument was used in a material other than t h a t in which i t uras calibrated; others did not.
THE NEUTRON METER
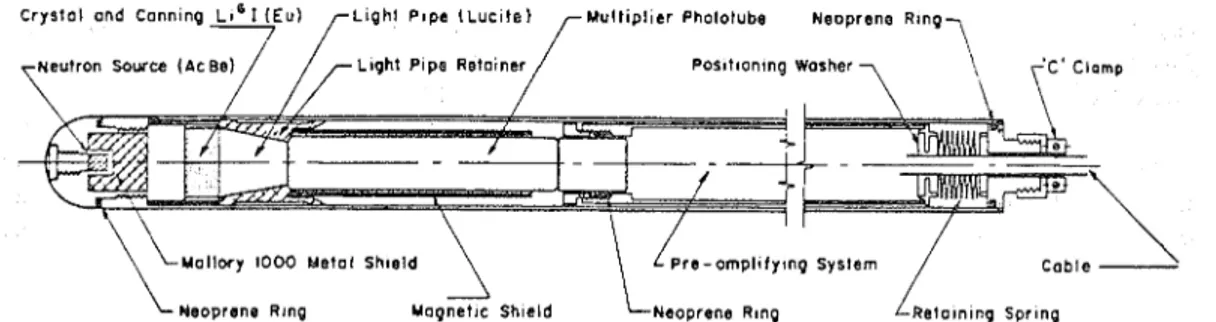
The probe was designed with a scintillation detector and its geometrical arrangement was dictated by the desire t o have i t slip inside a n aluminum access tube with a n outside diameter of 1% in. and a mall thickness of
x6
in. (Fig. 1).A source of actinum and beryllium emitting
lo5
neutrons per second is located a t the lower end of the probe and separated from the Li61 scintillation crystal by a shield of alloy of a specific gravity of 16.9.A
lucite light pipe funnels the light activity from the crystal t o the window of the photomultiplier tube, and this is followed by a preamplifier which pro- duces the signals t h a t drive the scaler.The portable, battery-operated scaler is manufactured by Nuclear Chicago Corpora- tion, Chicago, Illinois.
THE CALIBRATION PROBLEM
Initial considerations included the use of natural soils for calibration purposes. Moisture contents in situ would be impossible t o control, however, and i t was considered a t this stage that manual placing of natural soils in drums in the laboratory left much to be desired in uniformity of density and distribution of moisture.
Much thought was given to the use of sub- stitute materials, preferably in the form of fluids, whose hydrogen contents could easily be varied and calculated in a manner more accurate than t h a t possible by oven drying the samples, e.g., from specific gravities a n d chemical formulas. Such materials must also conform closely t o the moisture-content- bulk-density relationships of natural soils so t h a t the scatter geometry of neutrons would
Cryslal and Cann~ng
eutron Source ( A c Llqht Plpe Retarne P o s ~ t ~ o n t n g Washer
U a l l w y IOOO Metal Shleld r e - o r n p l ~ f y l n g System Neoprene Rlng
25. N E U T R O N M E T E R C A L I B R A T I O N 207
not be seriously altered. These ideal conditions were not easily satisfied, however, and a search for a substitute material was only partly successful.
Laboratory Calibration
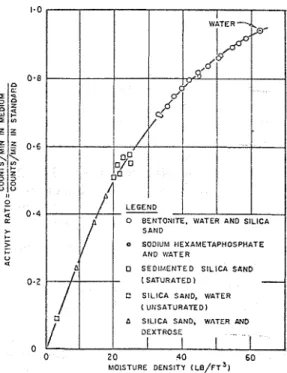
The instrument was calibrated in the laboratory by preparing samples in 55-gallon steel drums which had previously been found to be of adequate size for this p u r p o ~ e . ~ Readings were obtained with the probe positioned a t every inch or two of depth, and only those values that were unaffected by the upper and lower limits of the sample were averaged for construction of the calibration curve. All actual values of readings were related to readings obtairied with the probe positioned in a wax standard. Tlie values of these ratios were used in the construction of the laboratory calibration curve (Fig. 2).
Calibration Media. The several media used for calibration were as follolrrs.
Ottawa Sand, Water and Dextrose. Depend- ing to some extent upon the size distribution of the grains, only a small amount of water can be added to sand before i t begins to drain. To avoid this condition of nonuniformity in the
FIG. 2. Laboratory calibration curve of neutron
moisture meter.
lower range of moisture density, additional hydrogen atoms were supplied by adding dextrose. The equivalent moisture content was determined from its chemical formula and percentage weight. One point was established near the bottom of the curve using simply a mixture of sand and water. After thorough mixing by machine, the material was carefully placed in layers and compacted as uniformly as possible by hand. Resulting variations in the density of layers were small.
Saturated Sand and Water. Under these con- ditions drainage cannot occur, and samples were prepared by carefully sedimenting the sand into water. Again there \\-as a small calculated variation in the density of la: vers. Two such loose samples were prepared, and further points were obtained by vibrating the media to a greater density after the initial readings mere made. Water contents Tvere calculated by measuring the volumes of these samples, assuming conditions of PO0 per cent saturation and deducting, from the total volume, that occupied by the known weight, of Ottawa sand. These points exhibited a greater deviation from the mean curve than any of ti?: others obtained.
Sodium Hexametaphosphate and TTater
.
Sodium hexametaphosphate which contains no hydrogen is highly soluble in water, and the densities of solutions a t high concentrations are similar to natural soils in the high moisturcl content range. Two points for the calibratior, curve were established using solutions which were prepared by slowly adding the powdered chemical to water. Actual water contents a t the calibration points were determined by titrating for phosphorous.
Bentonite, Water and Silica Sand. Bentonite
is a clay mineral which has a very high affinity for water. At proportions of ten times as much water as bentonite (by weight) it exhibits thixotropic properties. It is possible to mix in sand as in a fluid without danger of its settling to the bottom. In this manner, a sample of high initial water content was pro- duced ~vhich n-as gradually reduced by in- creasing tlie content of silica sand. Several points on the calibration curve mere deter- mined from such samples, and their water contents calculated by oven drying.
For all types of materials the bulk densities were calculated from total \veiglits and
208 .MEASURING J l O I S T U R E I N L I Q U I D S A N D SOLIDS
volumes determined by weighing equal volumes of 17-ater. Moisture densities were then determined from the water contents and bulk densities. TTThen plotted, all of the results
appeared to fall along a fairly smooth curve
''
= =
uninfluenced by the change in media. A 2 2 - 6 5-
masimum deviation from the curve of less than 1 lb/cu f t of water occurred in a saturated
=!"
sample of sand and water vhich contained a n;
.60-
appreciable but u n l i n o l ~ n quantity of en- 2
trapped air. Field Calibration
AUGERlNG
Field calibration n-as carried out in a
sensitire, post glacial clay called Leda clay 2 0 25 30 35 4 0 45
n-hich is commonly found in the Ottawa and MOISTURE DENSITY. LB PER cu FT
St. L a l r ~ e n c e River TTalleys. Based on the
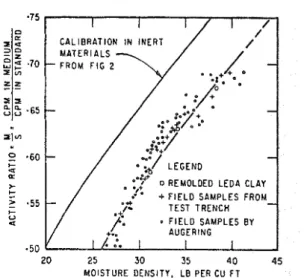
FIG. 3. Calibration curve for Leda clay.
experience of others, i t was expected t h a t there might be some difference in readings when the meter was used in the field b u t t h a t the laboratory calibration cun-e would be reasonably valid. E r e n the preliminary field tests, hon-erer, indicated substantially lower moisture contents using the laboratory cali- bration curre than those obtained b y oven d r 5 n g the natural samples.
I t rr-as necessary therefore t o undertake a field calibratioil and if possible t o check i t in the laboratory n-ith large samples of natural clay. nllere control of moisture and density would be more positive.
Samples of highly sensitive clay from deep escarations xere obtained and thoroughly remolded until they had the consistency of a heal-?- oil, which could easily be made t o flow into a container by means of a small vibrator. Three samples a t different water contents were prepared. Readings of neutron activity in tile media compared with t h a t in t h e wax standard n-ere determined in the same manner as n-as used to establish the calibration curve. lloisture contents n-ere determined by oven drying the samples and calculating the densities as before. The results obtained fell well below those obtained in the laboratory tests.
Further correlative values of neutron actirity vs moisture density were found by obtaining samples from vertical boreholes in the vicinity of a 12-ft deep access tube. These boreholes were all located no further away than 3 f t and no closer than 1 f t from the access tube. Samples and readings were taken
on t h e same day periodically during the summer months a s the soil a t this test site gradually dried. A t the close of t h e drying season a trench was excavated and samples were obtained from the area immediately adjacent to the tube for purposes of deter- mining in-place density and water content.
A profile of dry densities was established and, from this, values of moisture density from the borings obtained during the summer. All these points were plotted and resulted in t h e curve shown in Fig. 3.
I n plotting, most xeight was given to t h e laboratory points and those values determined for the test trench samples. A natural varia- tion in x a t e r content exists in the soil where samples from auger borings only 354 f t apart shoa1ed differences as large a s 10 per cent for the same depths. For comparison, a small section of the laboratory curve of Fig. 2 is also shown in Fig. 3. The two appear to be parallel with a difference in activity ratio of 11 per cent or in moisture density of 6 lb/cu ft. Possible Causes of DiEerences in the Calibra-
tion Curves
If no large errors exist in determining t h e two curves, t h e only possible explanation is t h a t there is something in the natural soil causing a reduction in the flux of slow neutrons. Elements with high capture cross sections for neutrons t h a t might logically occur in either the pore water or the clay minerals were immediately suspect. Chlorine
25. NEUTRON METER CALIBRATION
salts occurring in the pore water had been found to occur in concentrations greater than 2 g/l in only one case, a t a n elevation much lower than the test site. Chemical analysis of the soil showed Ca, Mg, Si and Na to be the main constituents of the salts with the con- centrations of chloride ions less than 0.1 g/l. From the work of J.
W.
H o l m e ~ , ~ i t was deduced t h a t this could not affect the counting rate by more than 2 per cent.Available mineralogical analyses6 for Leda clav were examined for a n indication of an element or elements which might be the cause
-
of neutron absorption, but no element with a high absorption cross section was found. Itbecame evident, however, t h a t both potassium and iron, which have absorption cross sections a little higher than those of the elements most commonly occurring in soil, might be present in sufficiently large quantities t o cause a significant reduction of neutron flux.
Potassium was &st investigated in a pilot study because large proportions of felspars were found in the mineralogical analises. Aqueous solutions of potassium carbonate were prepared in a 15-gallon drum, and read- ings of activity were obtained with the probe centered in the medium. Only small quantities of potassium carbona,te were immediately available, and i t uras not possible t o reach the concentration in the clay which was estimated
to be about 5 per cent by weight. The results showed a n appreciable decrease in counting rate, however,-which was roughly linear with concentration. At a maximum concentration equivalent t o 2 per cent of dry weight of soil, a reduction of 4 per cent of neutron activity was detected. If this very meager evidence could be extrapolated, i t would mean t h a t a t 5 per cent potassium by weight a reduction of neutron activity on the detector amounting t o about 10 per cent of t h a t determined in the initial calibration curve mould result.
Chemical analyses of the samples of natural Leda clay, however, revealed only a very small quantity of potassium, less than 1 per cent, but a n unexpectedly high proportion of iron, averaging ? per cent.
Theoretically, the absorption of neutrons is related t o the number of atoms of a n element present in a given volume and its absorption cross section. Iron is a little heavier than potassium and therefore has fewer atoms in a
given weight, but its capture cross section for neutrons is slightly greater. The relative effectiveness of a given weight for absorbing neutrons is roughly inversely proportional t o the atomic weight and directly proportional t o the capture cross section:
Iron - - - 39.1 2.5 barns
X
potassium 55.8 2.2 barns = 0.8 Therefore 20 per cent more iron than potas- sium would be required t o effect the 10 per cent reduction of neutron activity. The -ialue of 7 per cent of total weight for iron, as compared with the estimated 5 per cent of potassium which, by extrapolation from a limited test, caused a 10 per cent neutron absorption, gare promise t h a t this might hold the ansn-er.
NEUTRON ABSORPTION BY IRON Following the discovery t h a t a n unusually large percentage of iron was present in Leda clay and t h a t i t should, in theory, cause the same amount of neutron absorption as rhe estimated quantity of potassium, a series cl' experiments was carried out t o substantierr this observation. The experiments used soluble iron salt in substitute soil media t h i t had a natural bulk density equivalent to thst of the clay. Ferric sulfate, Fe,(SO,),~tH,C: was selected as the neutron absorber becau-e of its high solubility. The ultimate purpose c l
these tests was not to determine a precise relationship between the iron content of the soil and the reduction of neutron activitv. but to establish quickly and roughly the mngni- tude of the effect in Leda clay.
An activated bentonite mixed with a sllica sand in proportions of 1:2 with water content a t about 50 per cent prored t o be suitable for easy mixing and placement in a small drum without the sand particles segregating at the bottom. The free water content in the actual experimental mises was reduced to compen- sate for t h a t added in the form of water of crystallization in the ferric sulfate. I t was important t o maintain the ratio of iron t o water in the experimental mixtures in the same range as that in the natural soils. A
large imbalance in this ratio would niean a greater or lesser number of thermal neutrons available for capture by iron and a n erroneous result in overall reduction of detectable sloxx-
210 1IIEASURIh7G XOISTURE IN LIQUIDS AhTD SOLIDS
neutron actirity. (This had been overlooked in t h e pilot experiment t o assess t h e effect of potassium in t h e reduction of sloxir neutron activity.)
The natural ratio of iron t o water is n o t constant because of t h e movelnent of moisture in t h e soil from season t o season. It tends t o be liipli near t h e surface when t h e soil is d r y in the sunliller and lover a t the depth \\here moisture changes are r e r y small. T h e actual ranse was found t o be from 1 0 t o 35 per cent. Samples were prepared in a large piginent miser of about 33-gallon capacity \vhich was also used t o blend the add~tioilal quantities of ferric sulfate a s the ,qeries progressed. The rt-aultq of clleiliical anal-ses b y which nloisture
, I I : ~ iron contents were determined differed
1-er!- little throughout each sample indicating
a uniform distribution of components. The \-iwous consistency of these mixes made it possible t o use a concrete vibrator t o cause t!iem to flon-lnto a 15-gallon container without entrapping a n y air. I t n-as also possible when tile drum was filled t o push a short length of a1u:llinum access tubing into t h e sample and no? leare annular spaces around it. T h e t u b e ua. carefull- placed upright because i t n-as s u ~ p e c t e d t h a t t h e rolume of t h e sample was approaching a minimum necessarJ- for this moi-ture content. I f it were in fact too small, then it was essential to maintain identical collfigurations of access t u b e a n d sample in all
t h e tests, so t h a t a n y errors caused b y geo- metrical limitations would be uniform.
T h e densities of t h e samples were deter- mined from total weights and volumes measured b y weighing equal volumes of water. Smaller samples mere taken from three depths in t h e drum and chemical analjrses were made on these t o determine both water content and percentage weight of iron. lloisture densities of t h e prepared samples ranged b e t m e n 28.0 and 33.25 lb/cu f t . so i t was necessary t o refer t o the initial laboratory calibration curve t o eliminate this variable from t h e relationship under study.
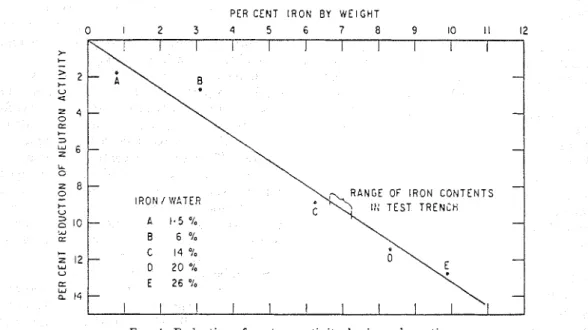
Readings of neutron activity were obtained a s described previously and ratios of these t o t h e readings in t h e a7ax standard were found for every inch of depth. \Vithin t h e central region. uniform readings were obtained and a n average of these are t h e values t h a t were used in constructing Fig. 4. The first two points o n t h e curve h a r e iron-to-water ratios less t h a n those encountered In Leda clay. The last three points having larger ratios of iron t o water fall within t h e natural range, although they go beyond t h e range of percentage of iron en- countered in Leda clay.
I f t h e range of per cent iron by weight for t h e soil a t t h e t e s t site is plotted in Fig. 4. t h e reduction of neutron activity t h a t might be expected on t h e basis of this relationship is about 9 per cent. This corresponds quite well
PER CENT I R O N B Y W E I G H T 0 1 2 3 4 5 6 7 8 9 1 0 1 1 1 2 -
-
6 - 8 - IRON I WATER 10 - C 1.5 % B 6 % C 14 % 12-
D 2 0 % E 2 6 % 14-
25. . NEUTRON M E T E R CALIBRATION 21 1 with the discrepancy observed between the
initial calibration curve and that determined a t the test site, when the small additional effects of chlorine and potassium are borne in mind.
CONCLUSIONS
(1) The initial laboratory calibration con- ducted on samples of materials selected according to those conditions upon which the technique is based resulted in a smooth curve.
(2) No points deviated from the curve by more than 1 lb/cu ft, indicating an adequate accuracy and instrument stability.
(3) Field trials of the instrument resulted in the discovery that a t the same moisture density, there was a substantial difference in counting rate between inert soil substitutes and Leda clay.
(4) Subsequent calibration of the instrument in Leda clay resulted in a curve of related points which indicated uniform absorption of slow neutrons amounting to about 11 per cent of the initiallevel of activity.
( 5 ) Chemical analyses oftlle clay and its pore water revealed relatively small quantities of potassium and iron, which have only slightly higher capture cross sections for neutrons than most elements in natural soils, and a smal! amount of chlorine, which has a relatively high capture cross section for neutrons.
(6) The effect of chlorine salts in the pore water was found to be very small because of the very low concentrations in Leda clay.
(7) The absorption effect of potassium on the neutron flux was investigated experi- mentally and was found to cause a significant decrease in counting rate. The small amounts actually present in Leda clay would, however, only account for a fraction of the observed difference.
(8) The absorption effect of iron was in- vestigated experimentally and was also found to have a significant effect on the counting rate. At the measured proportions of iron in Leda clay, the decrease in neutron activity would account for 85 to 90 per cent of the observed discrepancy.
(9) The remaining difference in neutron counts could be explained by the additional effects of the small quantities of potassium and chlorine in the soil.
(10) The general usefulness of the neutron meter to measure absolute quantities of moisture appears to be limited by neutron absorption. Although the absorption of neutrons by iron in Leda clay probably represents an extreme condition, this ex- perience indicates that the best use of the instrument cannot be made unless separate field checks of calibration are undertaken a t the site of all soil types in which it is antici- pated the neutron meter will be used.
(11) Neutron absorption, unless caused by some changing conditions in a soil deposit, nil1 not limit the usefulness of the instrument in a long-term study designed to follow moisture content changes a t any one location.
Acknowledgments. The author wishes to express his gratitude to all those in the National Research Council of Canada whose continued interest in this work was a source of encouragement and guidance. Many helpful discussions were held with Dr. N. B. Hutcheon, Assistant Director of the Division of Building Research, Dr. K. Geiger of the Division of Applied physic^, and his colleagues in the Division of Building Research.
For assistance in the preparation of samples and measurements of neutron activity throughout al! phases of this work, the author is particularl:; grateful to Mr. L. Boyd. Thanks are also expressed. t o Mr. R . Ironside of the Division of Applied Chemistry for the conducting of numerous chemical analyses which were essential for this study.
This paper is a contribution from the Division of Building Research, h'ational Research Council; Canada, and is published with the approval of the Director of the Division.
References
1. Burn, K. N., "Desig-n and Calibration of a Seutron Moisture Ileter," A.S.T.;11. Special Tech. P u b . , 293, 14-26 (1960).
2. Burn, K. N., "Calibration of a h'eutron Moisture Meter in Leda Clay," Canadian Qeoiecl~nical Journal, 1, No. 2, 9 6 1 0 3 (1964).
3. Burn, I<. N., "TheEffect of Iron on theDetermina- tion of Soil Water Content by the JIodcration of Neutrons (in preparation).
4. van Bavel, C. H. >I., et al., "So11 3Ioisture Measure- ment by Neutron hloderation," Soil Sci., 82, No. 1, 29 (1956).
5. Holmes, J. \Ir., "Calibration and Field Use of the Neutron Scattering Method of hleasuring Soil Water Content," .4ustralian J. App. SCL., 7, NO.
1, 4 6 5 8 (1956).
6. Brydon, J. E., and Patry, L. &I., "BIineralogy of Champlain Sea Sedi~nents and a Rideau Clay So11 Profile," Can. J . S o ~ l S c i . , 41, No. 2, 160-181 (1961).