HAL Id: halshs-03153539
https://halshs.archives-ouvertes.fr/halshs-03153539
Preprint submitted on 26 Feb 2021
HAL is a multi-disciplinary open access archive for the deposit and dissemination of sci-entific research documents, whether they are pub-lished or not. The documents may come from teaching and research institutions in France or abroad, or from public or private research centers.
L’archive ouverte pluridisciplinaire HAL, est destinée au dépôt et à la diffusion de documents scientifiques de niveau recherche, publiés ou non, émanant des établissements d’enseignement et de recherche français ou étrangers, des laboratoires publics ou privés.
Are epidemiological indicators misleading under
uncertainty? An evaluation and a remedy from an
economic perspective
Christelle Baunez, Mickaël Degoulet, Stéphane Luchini, Patrick A. Pintus,
Miriam Teschl
To cite this version:
Christelle Baunez, Mickaël Degoulet, Stéphane Luchini, Patrick A. Pintus, Miriam Teschl. Are epi-demiological indicators misleading under uncertainty? An evaluation and a remedy from an economic perspective. 2021. �halshs-03153539�
Working Papers / Documents de travail
WP 2021 - Nr 12
Are epidemiological indicators misleading under
uncertainty? An evaluation and a remedy from an
economic perspective
Christelle Baunez
Michaël Degoulet
Stéphane Luchini
Patrick Pintus
Miriam Teschl
Are epidemiological indicators misleading under
uncertainty? An evaluation and a remedy from an
economic perspective
∗Christelle Baunez† Michaël Degoulet ‡
Stéphane Luchini§ Patrick Pintus¶ Miriam Teschlk February 20, 2021
Abstract
Even though much has been learned about the new pathogen SARS-CoV-2 since the be-ginning of the COVID-19 pandemic, a lot of uncertainty remains. In this paper we argue that what is important to know under uncertainty is whether harm accelerates and whether health policies achieve deceleration of harm. For this, we need to see cases in relation to diagnostic effort and not to look at indicators based on cases only, such as a number of widely used epi-demiological indicators, including the reproduction number, do. To do so overlooks a crucial dimension, namely the fact that the best we can know about cases will depend on some well-defined strategy of diagnostic effort, such as testing in the case of COVID-19. We will present a newly developed indicator to observe harm, the acceleration index, which is essentially an elasticity of cases in relation to tests. We will discuss what efficiency of testing means and propose that the corresponding health policy goal should be to find ever fewer cases with an ever-greater diagnostic effort. Easy and low-threshold testing will also be a means to give back people’s sovereignty to lead their life in an “open” as opposed to “locked-down” society. Keywords: Uncertainty, Acceleration Index, Anti-fragility, Reproduction Factor, Test Strat-egy, Sovereignty
∗
This research was supported by French National Research Agency Grants ANR-17-EURE-0020.
†
Aix-Marseille Univ, CNRS, Institut Neurosciences Timone. christelle.baunez@univ-amu.fr
‡
Aix-Marseille Univ, CNRS, Institut Neurosciences Timone. michael.degoulet@univ-amu.fr
§
Aix-Marseille Univ. (Aix-Marseille School of Economics) and CNRS, 5-9 Boulevard Maurice Bourdet, 13001 Marseille, France. stephane.luchini@univ-amu.fr
¶
Aix-Marseille Univ. (Aix-Marseille School of Economics) and CNRS, 5-9 Boulevard Maurice Bourdet, 13001 Marseille, France. patrick.pintus@univ-amu.fr
k
Aix-Marseille Univ. (Aix-Marseille School of Economics) and EHESS, 5-9 Boulevard Maurice Bourdet, 13001 Marseille, France. miriam.teschl@ehess.fr
1
Introduction
The COVID-19 pandemic clearly brings home the fact that we live in a world of uncertainties where the calculation of what is best to do is not included in the choice set. This is, if we follow the definition of uncertainty by the economist Frank Knight (1921), because the necessary in-formation about probabilities and magnitudes of consequences are not known. Choice situa-tions under uncertainty must be distinguished from those with quantifiable risk, which can be used to make some prediction of possible future events, but predictions under uncertainty, even if they are presented with confidence intervals, have the touch of an oxymoron. Given the pan-demic circumstances, epidemiologists and pub-lic health specialists were probably the most in-formed and experienced people about the neces-sary actions to undertake and the tools available to control the outbreak of the pandemic. How-ever, whilst their knowledge was and is impor-tant for many aspects of health-decision mak-ing, in particular during early stages “to flatten the curve” and to gain time for better under-standing the viral spread of the new pathogen SARS-CoV-2 and its medical treatment, they also derive their recommendations from mod-els which actually abstract away uncertainty by making a number of more or less plausible, but at that stage unverifiable starting assumptions to predict scenarios of what might be happening if particular public health actions were or were not to be taken.1 “Fighting a pandemic” is not
exactly like playing dice in a casino.
But what happens if we take uncertainty se-riously? If we accept uncertainty as a starting point, then, so our argument goes, we must be open for new ways of looking at the problem. Accepting uncertainty changes our epistemolog-ical stance and forces us to look for new an-swers to the questions of what we can and want to know. Our standpoint is that at a moment of urgency such as a pandemic, what we cru-cially want to know, in real-time, and in partic-ular from a public health perspective is whether harm is accelerating or whether the pandemic spread is slowing down as a consequence of the measures that were taken. So how can we know about the dynamic of harm under uncertainty? Coming from a neuro-economic perspective and studying decision-making under uncertainty at the time the pandemic started to unfold, it soon became clear to us that recognising the dynamic of harm meant more than looking at the pat-tern of cases against time. In fact, before we know anything about cases, we have to go out and find them. That is, looking at the charts representing the evolution of cases does not tell us much if we do not link them to the effort invested into finding or “producing” them, i.e. without relating them to the evolution of tests or any other diagnostic method. In the next sec-tion, after briefly introducing the notion of ac-celeration and deac-celeration of harm [or benefits for that matter at better times] that we took from our neuro-economic research on
decision-1
Certainly one of the most mediatised examples was the study by the Imperial College Covid-19 Response Team, which predicted in their Report paper 9 on the 16th of March 2020 that if the UK or the US would not engage in any control measures and if individual behaviour would not change, the mortality peak would be reached within the three months of their published report and achieve over 500 thousand deaths in the UK and over 2.2 million in the US. It was this forecast that apparently led to a drastic policy change in the UK, switching from a mitigation strategy to achieve herd immunity to a suppression strategy with a total lockdown, similar to other European countries.
making under uncertainty, we show that com-mon epidemiological indicators of harm that de-pend on cases, including the reproduction num-ber R, are failing to incorporate this relation-ship between diagnostic effort, i.e. tests, and outcome, i.e. cases and are therefore giving a biased measure of the extent of real-time harm. We will also present a new index we have de-veloped, the acceleration index (Baunez et al 2020a), and argue that it better captures the dynamic of harm. In a nutshell, the accelera-tion index shows that if a percentage increase in tests finds more than that percentage increase of new cases, then the pandemic is accelerating; if it finds less, the pandemic slows down and may achieve deceleration levels leading to extinction. We will provide some examples of our accelera-tion index in comparison to other indicators, us-ing data from Santé Publique France, the French agency in charge of informing the general public. Diagnostic effort, such as testing, allows learning about the pandemic, at least to the ex-tent that this effort “produces” cases at a par-ticular location, at a parpar-ticular time, involving particular people. So we know who has the virus when and where, and we can take appro-priate, even targeted measures to diminish fur-ther transmissions. This leads to three furfur-ther observations, which we will discuss in section three. One is that we need to know what the best searching algorithm is for finding cases, es-pecially at the beginning of a pandemic when we face penury of diagnostic methods such as testing. We will show that the acceleration in-dex will also be useful for allocating tests to find the maximum of cases with a given amount of diagnostic effort. Second, as the pandemic pro-gresses, diagnostic effort needs to increase, even
as cases fall. This is a typical diseconomies of scale argument, which can serve well as an ex-plicit health policy goal: if we multiply diagnos-tic effort, we want to “produce” less than that multiple of cases –indeed the fewer the better. Third, public health specialists may be as benev-olent to stop the pandemic and as eager to find cases as possible, they may not capture all cases if they do not incite people to reveal their private information on their type, that is, their health-related behaviour and provide the tools to do so. Individuals know best whether they may have been in contact with a possible COVID-19 case, or simply whether they have been meeting many people who respected the social distancing requirements or not. Providing widespread and easy access so that people can test at their own initiative is a way to inform people–and health officials about their COVID-19 status and be-haviour. Individualising diagnostic effort, in combination with other non-pharmaceutical in-terventions such as masks and social distanc-ing, also restores people’s sovereignty in their daily life-decisions, whether this is to meet el-derly family members, to go and visit a concert or to have coffee with friends. We will conclude by pointing out that uncertainty requires not only a top-down approach where health author-ities dictate people what to do and monitor their behaviour, but also to provide the means for a bottom-up approach allowing people to regain control over their lives. Diagnostic effort such as tests are such a mean and possibly more so than vaccines, which may not be taken up by everyone and as rapidly as necessary to return to a life in an “open society”.
2
Acceleration and deceleration
of harm
The one thing the experience of pandemic uncer-tainty clearly demonstrates is that decision mak-ing and actmak-ing under uncertainty is not the same as our more habitual or experienced decisions we take under known situations or with relatively well-specified risks. Taking an umbrella with us when the weather app tells us that there is a 70% chance of heavy rain this afternoon when we leave office clearly is a sensible choice to do given we do not like to get wet, but is it as rea-sonable to forgo next weeks skiing trip to the Italian or Tyrolean Alps given there is a new virus circulating in China? Typical utility max-imisation or cost-benefit models will not help us making this decision because we are lacking the probabilities associated with a possible in-fection. Another strategy may be to change be-haviour and, for example, to go ahead with the skiing trip but to avoid after-skiing clubs and other gatherings that may increase the chance of infection. That is, one may want to adopt a behaviour that protects against major harm of a very rare event, even if this is not neces-sarily one’s best choice, impossible to find out anyway given agnosticism about the probabil-ity of events and the magnitudes of their conse-quences. In short, uncertainty calls for “antifrag-ile” behaviour (Taleb 2012): to be protected against rare but very harmful happenings, but also, in other circumstances, to be open for rare but very beneficial events. However, being open or protected is not an invariable attribute or characteristic, it is a movement, an effort that should be monitored in real time. Uncertainty needs effort, effort to explore or to exploit, and
to find out more information about actions and their possible consequences on the dynamic of harm (or gain).
Some of us were studying exactly this ques-tion in an neuro-economic experimental setup, conducting a comparative behavioural study of rats and humans in order to find out whether they would engage in antifragile behaviour when they are faced with different options involving unknown frequencies and magnitudes of gains and losses when the pandemic started to unroll (Degoulet et al. 2020). That is, the question we were studying for some time already was whether subjects sensed, through their choice experiences, very rare but increasingly larger gain differentials and chose to go for them in-stead of much more regular but smaller gain dif-ferentials? And did they develop sensitivities for avoiding very rare but increasingly greater loss differentials and went for much more regular but smaller losses? Said differently, did they have a convex uncertainty exposure which antifragile behaviour would imply? A convex uncertainty exposure means that subjects would choose con-vexity in gains (that is, gains are smaller at first but accelerating quickly as they are ex-ponentially increasing) and convexity in losses (that is, losses do increase very slowly and are bounded) over other exposures including, for ex-ample, concave ones, i.e. those that had fre-quent higher gains [lower losses] at the begin-ning but which did not increase as quickly [did increase more rapidly] as the states of nature unfolded.
On the background of this research, we were obviously led to ask ourselves what antifrag-ile behaviour meant in the pandemic context. More specifically, how would we be able to see
when harm was accelerating so that we, individ-ually speaking, feel informed rather than fright-ened and would better be able to adjust our be-haviour? And what information is needed so that we, collectively speaking, can better ob-serve, in real-time, whether public health deci-sions that are taken to slowing down harm are successful and will eventually attain decelera-tion?
This may sound like some odd questions, be-cause defining harm as the increasing number of COVID-19 cases, for example, it suffices, one might say, to look at its daily variation or cumu-lative number. Well, not quite. Known cases is an indication that something is happening, but it cannot give us the precise picture of acceler-ation or deceleracceler-ation of harm as cases can only be the result of diagnostic effort. If there is no testing, or too little, then confirmed cases are rare and cannot be a correct representation of harm. Donald Trump’s intuition was right when he said that the high number of cases in the US were the result of massive testing–but wrongly implied that fewer tests would mean that the US “had” fewer cases.2 Moreover, there may be a number of asymptomatic cases that will not get tested at all if there is no clearly defined testing strategy, and hence may go unnoticed altogether. The same holds true for the inci-dence rate, which represents, often over a pe-riod of 7-days, the number of confirmed cases per 100 thousand inhabitants. The test posi-tivity rate represents the percentage of positive cases among all the tests that were done, usu-ally also over a period of the last 7 days. But again, a high positivity rate will not tell us if it’s high because there are so many positive cases or
whether only a few tests were done.
Remains the reproduction number. The re-production number measures the average num-ber of secondary infections that is produced by infected individuals. There are several ways of measuring the reproduction number, but one way commonly used sets the change of newly (or secondary) infected cases , say on a daily basis, over the average number of (primary) in-fected cases over a given time-window (Cori et al. 2013). This window is determined by the generation time of the infection, that is, the number of days that an infected individual will on average be able to contaminate other individ-uals. For Covid-19, this generation time is often assumed to be in between four to seven days (see e.g. an der Heiden and Hamouda 2020). But how many people an infected individual will in-deed contaminate will depend, for example, on the number of people an infected person is ex-posed to on each of those days, on the proba-bility of each exposure becoming an infection, on the duration of infectiousness including pe-riods of asymptomatic infectiousness, and other individual characteristics such as age and obe-sity (Edwards et al. 2021, Pandit 2020). Hence the reproduction number is an average number that assumes away a number of supposedly im-portant, and possibly time-varying, character-istics that may affect the “reproduction” of the virus depending on who, when and where one is infected. It is, in principle, an interesting num-ber to look at if all that information was avail-able, because it visualises well how an epidemic evolves, but this information is at most available ex post, but not when it is needed. Moreover, and as importantly, the reproduction number is,
2
https://edition.cnn.com/2020/07/09/politics/fact-check-coronavirus-cases-donald-trump-testing/ index.html (last access 15/02/2021)
again, not adjusted by the testing rate. With no clear testing strategy, known cases will not rep-resent the true extent of the epidemic outbreak and consequently, even the reproduction num-ber will be a biased measure of viral activity (Baunez et al. 2020b), upward as well as down-ward in principle. Hence, public policies that aim at curbing the pandemic and proclaim as aim to push the reproduction number below 1 or to achieve an incidence rate at a particular number are certainly achieving something, but given biased measurements of what is happening in real time, they may not get what they want. The moral of the story is, as it may have become clear, that we are navigating through this pandemic without having any clear under-standing or strategy as to where those “cases” are coming from that inform those epidemiolog-ical parameters, or said otherwise, how they are produced. Here “producing cases” is not meant in an epidemiological sense of “re-production” (which we cannot observe but only deduce), but in a straightforward economic sense: using in-puts to produce an output (which we can ob-serve, and that is the point). Output is “finding cases” and it is produced with an input that is “diagnostic effort”.
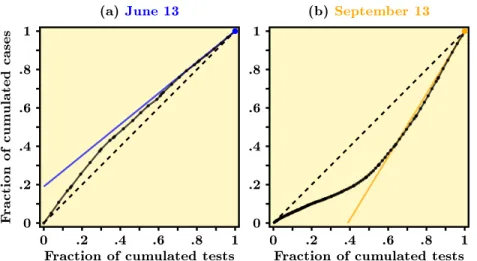
The idea of employing effort to produce cases also indicates what the information is that tells us whether harm is accelerating or decelerating: we need to see the evolution of cases in relation to, i.e. against, tests over time (Baunez et al. 2020a). Graphically, this means that we have to plot the cumulative number of cases against the cumulative number of tests, and look at how such a relationship changes over time. If we see that with increased testing, less and less new cases are found, then we face a concave
expo-sure that indicates that the epidemic is slow-ing down. If however we see that as cumulated tests increase, more and more cases are found, we observe a convex relationship and understand that the epidemic is accelerating. These rela-tionships can be seen in Figure 1. The left-hand side, using official data from Santé Publique France from mid-may up to June 13, shows a concave scatter plot: the pandemic was decel-erating in France at that time, right after the end of the first national lock-down. But three months later, the scatter plot on the right-hand side shows a convex relationship between tests and cases: the pandemic accelerated, even be-yond that date and ended in a second wave and lock-down as well as other restrictive measures, some of which are still on-going (Baunez et al. 2020c). From this relationship between tests and cases, we can deduce an acceleration index. To be able to compare different dates with each other, we normalise this fraction by the relation-ship between the total cumulative cases over to-tal cumulative tests. The slope of the scatter plot at end date captures the daily increase in cases over daily increase in tests, adjusted by the ratio of the corresponding average rates up to the final date we sit in. But this gives noth-ing else than an elasticity, a well known concept in economics: If a percentage increase in tests produces a greater percentage increase in cases, viral spread is accelerating (the acceleration in-dex is larger than one) and decelerating other-wise (Baunez et al 2020a).
3
Testing strategies
A number of public health experts argued very early during the epidemic outbreak that tests
Figure 1: Scatter-plot of cumulated daily cases against cumulated daily tests for COVID-19 in France at different dates (Data source: Agence Santé Publique France.)
(a)June 13 Fracti on of cum ulated cases 0 .2 .4 .6 .8 1 0 .2 .4 .6 .8 1
Fraction of cumulated tests
(b) September 13 0 .2 .4 .6 .8 1 0 .2 .4 .6 .8 1
Fraction of cumulated tests
Note: Data normalized using min-max re-scaling. The dashed black line represents the diagonal. The slope of colored solid lines in each panel is a visualization of our acceleration index. Figure (a) shows that harm was decelerating in June 2020 in France as cases grow less quickly than tests–the scatterplot is concave, Figure (b) shows that harm was accelerating in September because the scatterplot of tests and cases show a convex relationship: more tests find even more cases.
are crucial in the handling of the pandemic. Tests are necessary to understand the “scope of the outbreak” (Fineberg 2020), to “locate cases and to stop onward transmissions” (Bed-ford et al 2020) especially through contact trac-ing. Strategies were discussed as to how best to increase testing capacities (e.g. Binnicker 2020). Indeed, testing was a scarce resource, in partic-ular at the beginning of the pandemic and we all may remember statements such as “[n]ot ev-eryone needs to be tested, but evev-eryone with symptoms does.” (Fineberg 2020). More re-cent papers use mathematical models to eval-uate the impact of regular testing on COVID-19 transmission (e.g. Paltiel et al. 2020, Grassly et al 2020). These papers understand diagnos-tic effort as a therapeudiagnos-tic tool to mitigate the pandemic (which it obviously is), but not as a “microscopic” or searching tool that acts as an input in producing cases and thus to “see” the pandemic. One has probably to be an economist
to establish this input-output relation, which translates into a very specific question of pol-icy making: which search-algorithm do we need to find the most cases with a given amount of diagnostic effort?
The acceleration index is helpful to find an answer to this question (Baunez et al 2020a; Baunez et al 2020d). Remember that this in-dex tells us about the acceleration and deceler-ation of harm. Suppose that we have two dif-ferent regions called A and B and we allocate testing resources equally in between them. If we continue to test in both regions but find more and more cases in A but fewer and fewer cases in B, then at that moment of testing, the pan-demic is exploding in A, but decelerating in B. It would thus make sense to reallocate resources and to test more in A than in B to find more quickly more cases. As time goes on, this rela-tion may change and we would need to update the allocation of diagnostic effort. It should be
noted that we do not necessarily find more cases where there is a greater density of people–this will all depend on the particular circumstances of which we may be agnostic. The pandemic may also not accelerate as much where we cur-rently have the greatest number of cases in com-parison to a place that so far has not had many cases. This may be because of the feedback of diagnostic effort on the pandemic: if there are many cases, then those cases will also be quar-antined and hence transmission reduced, which may show up as a lower acceleration index than elsewhere. Similar reasoning applies to allocate tests across age groups, given that vulnerability is not homogeneous.
We can again turn to economics and wonder whether having found the search algorithm of diagnostic effort that gives us a maximum num-ber of cases with a given amount of testing is the best we can do. Clearly not, because as long as diagnostic effort is constrained, we do not know whether we have reached the production frontier of “finding cases” or better, the efficiency fron-tier of diagnostic effort. What we really would like to see is that as we multiply diagnostic ef-fort, we detect less than that multiple of cases. This “diseconomies of scale” argument translates into the following health policy goal: to bring the pandemic under control, we have to increase testing (across space and across age groups, pos-sibly together with other measures) such that we find ever fewer cases. Said differently, the more we search, the less we want to find.
But who is “we”? Clearly, we have taken here the perspective of the benevolent public
health policy maker, the decision maker or group of experts and politicians who coordinate the pandemic management and specify the actions to be taken and the guidelines to be followed by all fellow-inhabitants. However, centralised decision-making may be not enough to control the pandemic. The reason is that important pri-vate information of individuals may be lost if they do not have easy and simple access to di-agnostic testing. People know best their “type”, whether they strictly conformed to the social distancing rules or not, whether they have been in contact with a lot of different people who may have themselves not fully respected social dis-tancing rules, or who may have had particular COVID-19 symptoms. Giving people the oppor-tunity to have low-threshold access to be diag-nosed at their own initiative, and thus to resolve their own uncertainty about their health status, is resolving uncertainty for the public health pol-icy maker. And making the effort to inquire their own health status is also expressing their social preferences: if COVID-19 negative they know not to infect others, if COVID-19 positive, they will quarantine themselves in order not to infect others. Some may argue that providing easy access to testing may be a green card for irresponsible behaviour and for not respecting preventive behaviour to safeguard one’s health and those of others. But this argument would be equivalent to saying we do not distribute con-doms to prevent people from being infected with the HIV virus and let them rather be responsi-ble and abstemious and leading a chaste life.3 Both arguments are not feasible and, more
im-3
This is indeed what had happened in 2003: President Bush’s emergency plan for Aids relief was coming with a number of moral imperatives: “Recipient countries have to emphasise abstinence over condoms, and - under a congressional amendment - they must condemn prostitution.” (https: //www.theguardian.com/world/2005/aug/30/usa.aids), last access 18/02/2021.
portantly, are not respecting people’s dignity as human beings and their right of exerting a “nor-mal” social, professional and sexual life for that matter.
From an economic point of view, again, pro-viding low-threshold diagnostic facilities, includ-ing rapid antigen tests for home-use, are not only offering the right kind of institution for peo-ple to reveal their “type”, that is their health status and whether they are COVID-19 positive or not, which is an important information for people and for pandemic management, it also gives people their sovereignty back to decide for themselves what life they want to live. Even if a vaccination campaign is under way, testing will continue to be important as long as herd immu-nity will not be attained. Given virus mutations and vaccine hesitancy, there may still a long shot to go until worldwide immunity will be obtained (Schwarzinger et al. 2021). Massive and contin-uous low-threshold testing (in addition to other policies such as respecting social distancing rules or face masks for example) provides the possibil-ity for an open society. Individualised diagnos-tic effort is, we may say, the price to pay to end the “stop and go” policies that have paralysed private and public life in many of our societies over a year by now. It is a bottom-up measure that needs to complement the top-down policy and regulating approach that was prominent in many countries over the past year.
4
Conclusion
Standard epidemiological indicators are case-based, without however taking into considera-tion that cases must be found first. Not to relate
cases to the effort employed to find them biases the picture of the real extent of harm during this pandemic. But our claim goes further than this: we say that in times of uncertainty, it is essential to search to understand harm. Simply counting numbers may indicate that something happens, but in order to understand what happens, es-pecially when a novel event such as a pandemic with a new pathogen unfolds, we must get our hands dirty so that we really see all that there is that happens.
It is interesting to see that this insight is extensively disregarded in the epidemiological literature. Even more, a number of important public health experts from different disciplines are seemingly not recognising it. For example, on the website of the endcoronavirus.org ini-tiative, which regroups a number of highly in-fluential researchers, one can read as answer to the FAQ “Is not much of the confirmed case data inaccurate? Why should I trust this?” the fol-lowing answer (probably having in mind the cal-culation of the reproduction number): “While there is some amount of uncertainty in the ac-tual numbers, we argue that those are likely ir-relevant to the question of which actions need to be taken. Let’s assume the testing is done in a way in which you only catch 10% of the cases. This would simply scale down the curves by a factor of 10, which would not change the shape of the curves. If there is a sharp increase in the amount of testing vs time, one would ex-pect to see more confirmed cases, even if the actual number of infections is going down. Tak-ing a rollTak-ing 7-day average helps reduce the size of the features which show up on timescales of a few days.”4
4
This answer can be found quite at the bottom of the following page:https://www.endcoronavirus.org/ countries (last access 18/02/2021)
How can one know that the uncertainty in numbers is irrelevant for the actions taken? Given uncertainties of numbers, how would one ever know that only 10% of cases got caught? How does one know that the curves’ shapes would not be different if more cases are found? There are more examples such as this one in the literature, and one may be excused to think that even health specialists “assume a can opener” to simplify what surely is a more complex and espe-cially uncertain world.5 The tragic feeling that comes along with it is that, as with the financial crises in 2008, human lives depend on “assumed can openers”.
5
References
an der Heiden M, Hamouda O. (2020). “Schätzung der aktuellen Entwicklung der SARS-CoV-2-Epidemie in Deutschland– Nowcasting”. Epidemiologisches Bulletin Robert Koch Institut 17, pp.10-15. DOI 10.25646/6692.2
Baunez, C., Degoulet, M., Luchini, S., Pintus, P., Teschl, M. (2020a), “Tracking the Dynamics and Allocating Tests for COVID-19 in Real-Time: an Acceleration Index with an Application to French Age Groups and Départements”. Available at: https://www. medrxiv.org/content/10.1101/2020.11.05. 20226597v2
Baunez, C., Degoulet, M., Luchini, S., Pin-tus, M. PinPin-tus, P., Teschl, M. (2020b), “The Acceleration Index as a Test-Controlled Re-production Number: Application to COVID-19 in France”. Available at: https://www. medrxiv.org/content/10.1101/2020.12.01.
20241570v2
Baunez, C., Degoulet, M., Luchini, S., Pin-tus, P., Teschl, M. (2020c), “An Early Assess-ment of Curfew and Second COVID-19 Lock-down on Virus Propagation in France “. Avail-able at: https://www.medrxiv.org/content/ 10.1101/2020.11.11.20230243v1
Baunez, C., Degoulet, M., Luchini, S., Pin-tus, P., Teschl, M. (2020d), “Sub-National Allo-cation of COVID-19 Tests: An Efficiency Cri-terion with an Application to Italian Regions”, Covid Economics: Vetted and Real Time Pa-pers, CEPR Press, Issue 12, pp. 192-209. Avail-able at: https://cepr.org/sites/default/ files/news/CovidEconomics12.pdf
Bedford J., Enria D., Giesecke J., et al. (2020), “Towards Controlling of a Pandemic”. The Lancet 395, pp. 1015-1018.
Binnicker, M.J. (2020), “Emergence of a Novel Coronavirus Disease (COVID-19) and the Importance of Diagnostic Testing: Why Part-nership between Clinical Laboratories, Public Health Agencies, and Industry Is Essential to Control the Outbreak”. Clinical Chemistry, 66 (5), pp. 664-666.
Cori, A., Ferguson, N., Fraser, C., Cauchemez, S. (2013). “A New Framework and Software to Estimate Time-Varying Reproduc-tion Numbers During Epidemics”. American Journal of Epidemiology, 178(9), pp. 1505-1512. Degoulet, W., Baunez, C., Luchini, S. , Pin-tus, P. (2020) “Sensitivity to Rare and Extreme Events in Rats: the Black-Swan-Avoidance Bias”, forthcoming bioRΧiv and AMSE working paper.
Edwards, D., Ausiello, D., Salzman, J., et al. (2021). “Exhaled aerosol increases with
19 infection, age, and obesity”. Proceedings of the National Academy of Sciences 118 (8), 118 (8) e2021830118; https://doi.org/10.1073/ pnas.2021830118
Ferguson, N., Laydon, D., Nedjati-Gilani, G. et al. (2020). “Report 9: Impact of non-pharmaceutical interventions (NPIs) to reduce COVID-19 mortality and healthcare demand”. Imperial College COVID-19 Response Team, DOI: https://doi.org/10.25561/77482
Fineberg, H.V. (2020), “Ten Weeks to Crush the Curve”. New England Journal of Medicine 382, pp. e37(1)-e37(3).
Grassly, N., Pons-Salort, M., Parker, E. et al. (2020). “Comparison of molecular testing strategies for COVID-19 control: a mathemati-cal modelling stud”. The Lancet Infectious Dis-eases 20(12), pp. 1381-1389.
Knight, F. H. (1921) Risk, Uncertainty, and Profit. Boston, MA: Hart, Schaffner & Marx;
Houghton Mifflin Company
Paltiel, D., Zheng, A., Walensky, R. (2020). “Assessment of SARS-CoV-2 Screen-ing Strategies to Permit the Safe Reopen-ing of College Campuses in the United States”. JAMA Network Open 3(7):e2016818. doi:10.1001/jamanetworkopen.2020.16818
Pandit, J.J. (2020). “Managing the R0 of COVID-19: mathematics fights back”. Anaesthesia 75. pp.1643-1647, doi:10.1111/anae.15151.
Schwarzinger, M., Watson, V., Arwidson, P., Alla, F., Luchini, S., (2021), “COVID-19 vaccine hesitancy in a representative working-age population in France: a survey experi-ment based on vaccine characteristics.” The Lancet Public Health, https://doi.org/10. 1016/S2468-2667(21)00012-8
Taleb, N.N., 2012, Antifragile: Things that Gain from Disorder, Random House.