HAL Id: hal-02905980
https://hal.archives-ouvertes.fr/hal-02905980
Submitted on 23 Jul 2020HAL is a multi-disciplinary open access archive for the deposit and dissemination of sci-entific research documents, whether they are pub-lished or not. The documents may come from teaching and research institutions in France or abroad, or from public or private research centers.
L’archive ouverte pluridisciplinaire HAL, est destinée au dépôt et à la diffusion de documents scientifiques de niveau recherche, publiés ou non, émanant des établissements d’enseignement et de recherche français ou étrangers, des laboratoires publics ou privés.
polyelectrolyte-surfactant complexes from pH-stimulated
phase transition using microbial biosurfactants
Chloé Seyrig, Patrick Le Griel, Nathan Cowieson, Javier Perez, Niki Baccile
To cite this version:
Chloé Seyrig, Patrick Le Griel, Nathan Cowieson, Javier Perez, Niki Baccile. Synthesis of multil-amellar walls vesicles polyelectrolyte-surfactant complexes from pH-stimulated phase transition using microbial biosurfactants. Journal of Colloid and Interface Science, Elsevier, 2020, 580, pp.493-502. �10.1016/j.jcis.2020.07.021�. �hal-02905980�
1
Synthesis of multilamellar walls vesicles polyelectrolyte-surfactant
complexes from pH-stimulated phase transition using microbial
biosurfactants
Chloé Seyriga, Patrick Le Griela, Nathan Cowieson,b Javier Perez,c Niki Baccilea
a Sorbonne Université, Centre National de la Recherche Scientifique, Laboratoire de Chimie de
la Matière Condensée de Paris , LCMCP, F-75005 Paris, France
b Diamond Light Source Ltd, Diamond House, Harwell Science & Innovation Campus,
Didcot, Oxfordshire, OX11 0DE
c Synchrotron SOLEIL, L'Orme des Merisiers Saint-Aubin, BP 48 91192 Gif-sur-Yvette
Cedex
Abstract
Multilamellar wall vesicles (MLWV) are an interesting class of polyelectrolyte-surfactant complexes (PESCs) for wide applications ranging from house-care to biomedical products. If MLWV are generally obtained by a polyelectrolyte-driven vesicle agglutination under pseudo-equilibrium conditions, the resulting phase is often a mixture of more than one structure. In this work, we show that MLWV can be massively and reproductively prepared from a recently developed method involving a pH-stimulated phase transition from a complex coacervate phase (Co). We employ a biobased pH-sensitive microbial glucolipid biosurfactant in the presence of a natural, or synthetic, polyamine (chitosan, poly-L-Lysine, polyethylene imine, polyallylamine). In situ small angle X-ray scattering (SAXS) and cryogenic transmission electron microscopy (cryo-TEM) show a systematic isostructural and isodimensional transition from the Co to the MLWV phase, while optical microscopy under polarized light experiments and cryo-TEM reveal a massive, virtually quantitative, presence of MLWV. Finally, the multilamellar wall structure is not perturbed by filtration and sonication, two typical methods employed to control size distribution in vesicles. In summary, this work highlights a new, robust, non-equilibrium phase-change method to develop biobased multilamellar wall vesicles, promising soft colloids with applications in the field of personal care, cosmetics and pharmaceutics among many others.
Keywords. Polyelectrolyte-Surfactant Complex, complex coacervates, biosurfactants,
2
Introduction
Polyelectrolytes and surfactants may assemble into complex structures known as polyelectrolyte-surfactant complexes (PESCs). When these compounds are oppositely charged, their self-assembly process is mainly driven by electrostatic interactions and it results in the formation of aggregates, which have a broad range of applications in biological materials,1–5 drug delivery,6–8 surface modifications,9 colloid stabilization10 and flocculation11 and consumer health-care products. The rich mesoscopical and structural organisation of surfactants combined with the electrostatic interactions with polyelectrolytes give rise to a wide range of structures and phases.12–18 Many works reported cubic or hexagonal mesophases15,16 but also a number of micellar-based structures: pearl-necklace morphologies,2,19,20 interpenetrated polyelectrolyte-wormlike/cylindrical micelles network,19,21–23 spheroidal clusters composed of densely packed micelles held by the polyelectrolyte, the latter known as complex coacervates (Co) when they form a liquid-liquid phase separation.19,24,25
Very interesting PESCs structures are formed when the surfactant forms low curvature vesicular morphologies. It is in fact generally admitted that modifying vesicles by the addition of polyelectrolytes is an interesting, cheap and simple approach to obtain nanocapsules,23 which are good candidates to be used as versatile delivery systems,19,23 like gene delivery,1,22,26,27 or as MRI contrast agents.28 One of the first PESCs vesicular systems has been reported more than
20 years ago in DNA-CTAB (cetytrimethylammonium bromide) systems, which were the precursors of a number of carriers for gene transfection and often referred to as lipoplexes, when cationic lipids replace surfactants in DNA complexation.29,30 If the term lipoplex supposes
the use of nucleic acids as complexing agents, similar structures, often addressed to as onion-like structures31 or multilamellar vesicles,13 were observed using both lipids and surfactants
complexed by a wide range of polyelectrolytes. However, multilamellar, or onion-like, vesicles are rather characterized by single-wall membranes concentrically distributed from the outer to the inner core of the vesicle. Lipoplexes, on the contrary, are vesicular objects with a large lumen and a dense multilamellar wall. For this reason, in this work we employ the name multilamellar wall vesicles (MLWV).
The mechanism of formation of MLWV was addressed by several authors, but a common agreement is not achieved, yet. Several works propose that the lipid:polyelectrolyte ratio controls the fusion of single-wall vesicles into MLWV,19,29,32–35 while others rather observe vesicular agglutination under similar conditions.36–38 In fact, a general consensus has not been found and a multiphasic system including agglutinated vesicles and MLWV are actually observed.39 The question whether or not MLWV, and PESCs in general, are
3
equilibrium structures and how they are formed is still open, especially when they are prepared under non-equilibrium conditions.19 To the best of our knowledge, the only works exploring a
stimuli-induced approach in the synthesis of MLWV in particular, and PESCs in general, were proposed by Chiappisi et al..21,40 However, the pH variation in these works was still performed under pseudo-equilibrium conditions with equilibration times ranging from 2 to 15 days for each pH value.
In a recent work, we have explored a Co-to-MLWV phase transition under non-equilibrium conditions using a continuous variation in pH,41 as illustrated by Figure 1. We could show that in the presence of G-C18:1, an acidic microbial glycolipid biosurfactant,42,43 and poly-L-lysine (PLL), a cationic polyelectrolyte (PEC), the pH-stimulated micelle-to-vesicle phase transition of the lipid drives a continuous, isostructural and isodimensional, transition between complex coacervates and MLWV. PLL strongly binds to the lipid monolayers thus favouring (∆𝐺= -36.4 ± 1.9 kJ/mol) the formation of the multilamellar wall through both specific (∆𝐻= -2.8 ± 0.8 kJ/mol, electrostatic and possibly hydrogen bonding) and non-specific (∆𝐻= 28.9 ± 0.9 kJ/mol, entropic, hydrophobic effect) interactions, as quantified by isothermal titration calorimetry experiments.41
In the present work, we generalize the method of preparing MLWV through a phase transition approach performed under non-equilibrium conditions and we show its performance in comparison to the more accepted method of vesicular agglutination. We show that the former can be applied to a broader set of polyelectrolytes and we explore in more detail the structure and size control of MLWV.
Figure 1 – Phase transition and structures obtained by mixing G-C18:1 and PEC (chitosan, poly-L-lysine, polyallylamine or polyethylenimine) upon a rapid variation of pH. G-C18:1 is negatively charged between about pH 4 and alkaline pH, while PECs are positively charged below pH ~10 (depending on the exact pKa, given in the materials and method section). Complex coacervates (Co) composed of G-C18:1 and PEC form
pH
10
8 7 5
4
3
MLWV phaseCo phase L phase + free PEC
Loss in long-range order Continuous Co-MLWV phase transition
-+ -+ -+ -+ -+ -+ -+ -+ -+ -+ -+ -+ -+ -+ -+ -+
G-C18:1 PEC4
at pH ~10. They progressively rearrange into MLWV and dissociate below pH ~4, where G-C18:1 forms a lamellar (L) phase coexisting with free polymer chains.41
Experimental section Chemicals
In this work we use microbial glycolipids G-C18:1, made of a single β-D-glucose hydrophilic headgroup and a C18 fatty acid tail (monounsaturation in position 9,10). From alkaline to acidic pH, the former undergoes a micelle-to-vesicle phase transition.42 Syntheses
of glucolipid G-C18:1 are described in Ref 44 and 43, where the typical 1H NMR spectra and
HPLC chromatograms are given. The compound used in this work have a molecular purity of more than 95%.
The polyelectrolytes used in this work are chitosan, obtained from the deacetylation of chitin from crusteans’ shells, poly-L-lysine, widely used in biomedical field, polyallylamine and polyethylenimine. Chitosan oligosaccharide lactate (CHL) (Mw ≈ 5 KDa, pKa ~6.5)45 with
a deacetylation degree >90%, poly-L-lysine (PLL) hydrobromide (Mw ≈ 1-5 KDa, pKa
~10-10.5)46 and polyallyllamine hydrochloride (PAH) (Mw ≈ 1-5 KDa, pKa ~9.5),46
polyethylenimine (PEI) hydrochloride (linear, Mw≈ 4 KDa, pKa ~8)47 are purchased from
Sigma-Aldrich. We also employ a polyampholite, gelatin (Aldrich, type A, from porcine skin,
Mw ≈ 50-100 KDa, isoelectric point 7-9), as a control. All other chemicals are of reagent grade
and are used without further purification.
Preparation of stock solutions
G-C18:1 (C= 5 mg.mL-1, C= 20 mg.mL-1), CHL (C= 2 mg.mL-1), PLL (C= 5 mg.mL-1,
C= 20 mg.mL-1), PEI (C= 5 mg.mL-1), PAH (C= 2 mg.mL-1) and gelatin (C= 5 mg.mL-1) stock solutions (V= 10 mL) are prepared by dispersing the appropriate amount of each compound in the corresponding amount of Milli-Q-grade water. The solutions are stirred at room temperature (T= 23 ± 2 °C) and the final pH is increased to 11 by adding a few μL of NaOH (C= 0.5 M or
C= 1 M).
Preparation of samples
Samples are prepared by mixing appropriate volume ratios of G-C18:1 stock solutions at pH 11 and cationic polyelectrolyte (PEC) stock solutions, as defined in Table 1. The final total volume is generally set to V= 1 mL or V= 2 mL, the solution pH is about 11 and the final concentrations are given in Table 1. The pH of the mixed lipid-PEC solution is eventually
5
decreased by the addition of 1-10 µL of a HCl solution at C= 0.5 M or C= 1 M. The rate at which pH is changed is generally not controlled although it is in the order of several µL.min-1.
Differently than in other systems,48,49 we did not observe unexpected effects on the PESC
structure to justify a tight control over the pH change rate.
Table 1 - Relative volumes of G-C18:1 and PEC solutions to mix to obtain given concentrations
Volume Concentration G-C18:1stock solution / mL PEC stock solution / mL Water / mL CG-C18:1 / mg.mL-1 CPEC / mg .mL-1 0.5 0.5 0 2.5 or 10 2.5 or 10 0.25 0.25 2.5 1.25 0.125 0.375 2.5 0.625
Dynamic light scattering measurements (DLS)
DLS experiments are performed using a Malvern Zetasizer Nano ZS90 (Malvern Instruments Ltd, Worcestershire, UK) equipped with a 4 mW He–Ne laser at a wavelength of 633 nm. Measurements were made at 25 °C with a fixed angle of 90° and three acquisitions per sample.
pH-resolved in situ Small angle X-ray scattering (SAXS)
In situ SAXS experiments during pH variation are performed at room temperature on
two different beamlines. The B21 beamline at Diamond Light Source Synchrotron (Harwell, England) is employed using an energy of E= 13.1 keV and a fixed sample-to-detector (Eiger 4M) distance of 2.69 m. The Swing beamline at Soleil Synchrotron (Saint-Aubin, France) is employed using an energy of E= 12 keV and a fixed sample-to-detector (Eiger X 4M) distance of 1.995 m. For all experiments: the q-range is calibrated to be contained between ~5.10-3 <
q/Å-1 < ~4.5.10-1; raw data collected on the 2D detector are integrated azimuthally using the in-house software provided at the beamline and so to obtain the typical scattered intensity I(q) profile, with q being the wavevector (𝑞 = 4𝜋 sin 𝜃 𝜆⁄ , where 2θ is the scattering angle and λ is
6
the wavelength). Defective pixels and beam stop shadow are systematically masked before azimuthal integration. Absolute intensity units are determined by measuring the scattering signal of water (Iq=0= 0.0163 cm-1).
The same sample experimental setup is employed on both beamlines: the sample solution (V= 1 mL) with the lipid and PEC at their final concentration and pH ~11 is contained in an external beaker under stirring. The solution is continuously flushed through a 1 mm glass capillary using an external peristaltic pump. The pH of the solution in the beaker is changed using an interfaced push syringe, injecting microliter amounts of a 0.5 M HCl solution. pH is measured using a micro electrode (Mettler-Toledo) and the value of pH is monitored live and manually recorded from the control room via a network camera pointing at the pH-meter located next to the beaker in the experimental hutch. Considering the fast pH change kinetics, the error on the pH value is ± 0.2.
Polarized Light Microscopy (PLM)
PLM experiments are performed with a transmission Zeiss AxioImager A2 POL optical microscope. A drop of the given sample solution is deposited on a slide covered with a cover slip. The microscope is equipped with a polarized light source, crossed polarizers and an AxioCam CCD camera.
Cryogenic transmission electron microscopy (cryo-TEM)
Cryo-TEM experiments are carried out on an FEI Tecnai 120 twin microscope operated at 120 kV and equipped with a Gatan Orius CCD numeric camera. The sample holder is a Gatan Cryoholder (Gatan 626DH, Gatan). Digital Micrograph software is used for image acquisition. Cryofixation is done using a homemade cryofixation device. The solutions are deposited on a glow-discharged holey carbon coated TEM copper grid (Quantifoil R2/2, Germany). Excess solution is removed and the grid is immediately plunged into liquid ethane at -180°C before transferring them into liquid nitrogen. All grids are kept at liquid nitrogen temperature throughout all experimentation. Images were analyzed using Fiji software, available free of charge at the developer’s website.50
Results
In recent publications,41,51 we have explored the complex coacervation between microbial glycolipids and PEC. For this reason, this aspect is only briefly shown here.
Cryo-7
TEM images presented in Figure 2 show the structure of PEC-complexed G-C18:1 complex coacervates above pH 7. Above this value, we expect the G-C18:1 to be negatively charged and PEC positively charged, whereas the apparent pKa of G-C18:1 is expected to be between 6 and
7, similarly to oleic acid,52 and the pKa of PECs being provided in the materials and methods
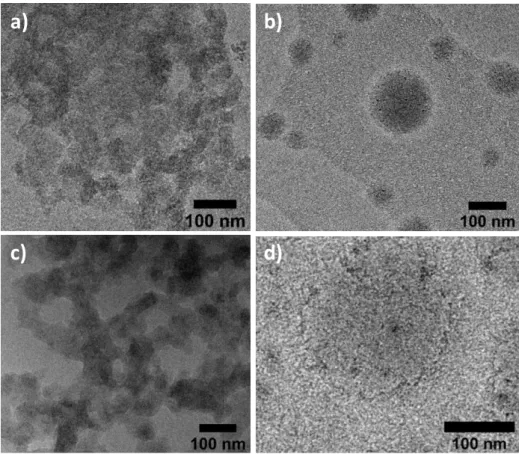
section. Irrespective of the selected PEC, all systems show spheroidal colloids of variable size in the 100 nm range. One can identify two types of structures, both typical of complex coacervates:24,25,51,53 dense aggregated structures, shown in Figure 2a,c and very similar to what was found by us41,51 and others,24 are attributed to dehydrated, densely-packed, micelles tightly interacting with the polyelectrolyte; a biphasic medium composed of spheroidal, poorly-contrasted, polymer-rich, colloids embedded in a textured, surfactant-rich, medium. The latter were also reported by us41,51 and others.53,54 In all cases, Co phase is a PESC forming in the micellar region of the surfactant’s phase diagram and having the specificity of a liquid-liquid phase separation,19,25 compared to other supramicellar PESCs undergoing a solid-liquid phase separation.19
Figure 2 – Cryo-TEM images of PESC solutions in the complex coacervate phase composed of G-C18:1 lipid complexed with a) CHL (pH 7.16), b) PLL (pH 9.16), c) PAH (pH 8.96) and d) PEI (pH 9.02). CG-C18:1= CPEI= 2.5 mg.mL-1, C CHL= 1 mg.mL-1, CPAH= 0.25 mg.mL-1, CPLL= 1.25 mg.mL-1
a)
c)
b)
d)
8
The difference between dense and poorly-contrasted structures is PEC-independent and it is more related to the stage of coacervation. At an early stage, colloids with a relatively low electron density form and coexist with a rich micellar phase. Free micelles progressively interact with residual polymer chains. At a later, entropy-driven (dehydration and counterion release),55 stage of coacervation, droplets with a higher electron density massively form. Unfortunately, neither the texture of the particles nor their internal structure can be easily controlled as they strongly depend on the type of PEC, its stiffness, charge density, stage of coacervation and even kinetics. For these reasons, isolating a specific structure in a Co phase can be challenging and we have ourselves found coexisting dense and poorly-contrasted structures,41 thus preventing any reasonable structure-composition generalization concerning the images presented in Figure 2.
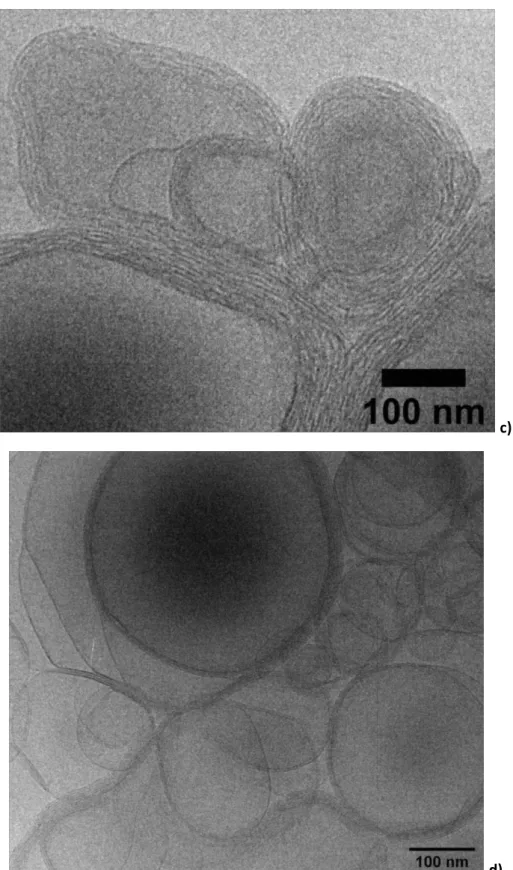
Figure 3 – Cryo-TEM images of a MLWV phase composed of acidic G-C18:1 lipid complexed with a) CHL (pH 4.87), b) PLL (pH 4.70), c) PAH (pH 4.25) and d) PEI (pH 5.33). CG-C18:1= CPEI= CPLL= 2.5 mg.mL-1, CCHL= 1 mg.mL-1, CPAH= 0.25 mg.mL-1.e) Zoomed cryo-TEM image of [G-C18:1 + PLL] mixture and its corresponding profile (f) allowing the determination of the interlamellar distance. Cryo-TEM data have been analyzed using Fiji software.50
At pH below 7, vesicular structures with multilamellar walls (MLWV phase) are observed by cryo-TEM for all PEC samples (Figure 3 and Figure S 1). These structures are closely-related to a lipoplex-type phase rather than to an onion-like phase: the latter is composed of concentric single-wall vesicles, while the former keeps a free lumen and a thick multilamellar
c)
d)
b)
0 5 10 15 20 25 30 35 40 Gray int ens ity / a.u . d / nm 1 2 3 4 5 6 7 8 910 Δd= 38 Åe)
f) 20 nma)
9
wall.29 Figure 3 also shows a strong packing of the multilamellar walls as well as a strong
interconnection between adjacent vesicular objects, in agreement with lipoplexes and other MLWV reported in the literature.23 The walls are constituted of alternating sandwiched layers
composed of tightly packed polyelectrolyte chains and interdigitated monolayers of G-C18:1.41
d-spacing can be directly estimated from cryo-TEM images (Figure 3e,f) and we find a set of
values of d= 33.7 ± 4.95 Å for the PLL system and d= 31.6 ± 3.00 Å, 25.3 ± 4.60 Å and 41.1 ± 0.30 Å respectively for CHL, PAH and PEI systems. Within the error, these values are compatible with interdigitated G-C18:1 layers,41–43 of which the thickness can be estimated to be about 25 Å by applying the Tanford relationship,56 but also close to what is classically recorded for lipoplexes.22,23,33 One may note that the multilamellar walls of the PECSs involving PEI (Figure 3d) appear more disordered than for other PESCs. At the moment, we do not have a clear explanation for that and we actually believe it to be an artifact due to freezing, because the full width at half maximum of the corresponding lamellar peak in SAXS experiments is Δq ~2.10-3 Å-1, the same value found for the PLL system.
Cryo-TEM images recorded on the Co (Figure 2) and MLWV (Figure 3) phases show that the Co-to-MLWV transition is a general property of G-C18:1 PESCs: it strictly depends on the lipid phase behavior, while the polyelectrolyte only guarantees the cohesion between the lipid membranes. We highlighted elsewhere41 by pH-resolved in situ SAXS experiments an
explicit isostructural and isodimensional continuity in the Co-to-MLWV phase transition: the broad correlation peak at q= 0.171 Å-1 (d-spacing of 36.7 Å) of the coacervate phase coexists
with the sharp diffraction peak of the MLWV phase at q1= 0.178 Å-1 (d-spacing of 35.3 Å) in a
narrow range around pH 7.41 Restructuring is driven by the progressive hydrogenation of the carboxylate group and the resulting conformational change of the lipid, which favors the formation of low curvature colloids, while inter-lipid repulsive electrostatic interactions disappear in the meanwhile.
10
Figure 4 - SAXS profiles of [G-C18:1 + PLL] PESCs at a) basic and b) acidic pH with G-C18:1:PLL concentration ratios in mg.mL-1: A= 2.5:5, B= 10:10, C= 2.5:2.5. c-e) 2D SAXS contour plots of G-C18:1:PLL concentration ratios in mg.mL-1: c) 2.5:2.5, d) 2.5:5 and e) 2.5:2.5. pH is varied from basic to acidic.
SAXS profiles presented Figure 4 show two different behaviors of the mixture [G-C18:1 + PLL]: at basic pH (Figure 4a), a broad correlation peak is observed at about q= 0.17 Å-1 for
all lipid:PLL ratios, where the peak can be more pronounced either with concentration (B profile) or lipid:PLL ratio (A profile). SAXS profiles B and C were previously assigned to complex coacervates, and more details on the structure of the Co phase can be found in Ref. 41. In similar systems, the slope at low q was shown to be indicative of the shape of the PESC;40 here, the slope is below -3. If such values are typical of fractal interfaces,57,58 we cannot unfortunately draw any conclusion on the structure of the complex coacervates, most likely because the Co phase in these systems is heterogeneous.41
Below pH 7 (Figure 4b), a sharp diffraction peak and its first harmonics are visible respectively around q1= 0.17 Å-1 and q2= 0.34 Å-1, characteristic of the (100) and (200)
reflections of a lamellar order in the walls, described previously and shown in Figure 3. The d-spacing of 37 Å is in agreement with the ones deduced from cryo-TEM (Figure 3e,f). Similar results are obtained at different lipid:PLL ratios (Figure 4c,d) but also for other PEC. Figure S 2 presents the SAXS signals of [G-C18:1 + CHL] solutions at basic and acidic pH, compared to the control solutions of [G-C18:1] and [CHL] alone as well as their arithmetic sum. If at acidic pH the signature of the lamellar wall of the mixture compared to the controls is out of
11
doubt, the signal at basic pH is less straightforward to interpret, due to the scattering of CHL alone, known to precipitate above pH 7.59 This result is similar to what was found for acidic
deacetylated sophorolipids;41,51 however, considering the fact that cryo-TEM experiments
suggest the presence of complex coacervates, we cannot exclude their formation, although their content may constitute a small minority, if compared to the PLL-based PESCs in the same pH range. Another argument for the formation of Co in the presence of CHL will be given later.
Figure 4c-e show the pH-resolved in situ contour plots of [G-C18:1 + PLL] PESCs at various lipid:PLL ratio and with CHL. They are recorded between pH 10 and 3 and focus on the high-q region of the SAXS pattern, sensitive to the structural Co-to-MLWV phase transition. All pH-resolved in situ contour plots in Figure 4 show three common features: 1) the
Co-to-MLWV transition between pH 8 and 7, where q1 and q2 refer to the first and second order peaks
of the lamellar wall; 2) a low-q shift of q1 and q2 when pH decreases to about 4.5, indicating a
swelling of the lamellar period, and 3) a loss of the signal between about pH 4.5 and pH 3.5, below which a constant peak at higher q-values (generally around q= 0.2 Å-1) appears. These phenomena were quantitatively described in more detail in Ref. 41 and will only be summarized hereafter.
When fully deprotonated at basic pH, G-C18:1 is in a high curvature, micellar, environment (Co phase). This state, represented by the drawing superimposed on Figure 4d, is proven by both cryo-TEM and the broad correlation peak at about q0= 0.17 Å-1. After crossing
the transition pH range between 8 and 7, the number of negative charges decreases and G-C18:1 is entrapped in a low-curvature, interdigitated layer, environment. The continuity between q0
and q1 strongly suggests an isostructural and isodimensional transition between the micelle and
membrane configurations, without any loss of the interaction with the polyelectrolyte. This is also sketched on Figure 4d. When the pH is decreased further, the COOH content increases and thus the membrane charge density decreases. The interlamellar distance consequently increases due to the repulsive pressure exerted by the charged polyelectrolyte, which undergoes hydration and increase internal electrostatic repulsion.2,60,61 When hydrogenation of carboxylate groups reach a certain extent, attractive interaction with PLL can no longer hold the membranes together and MLWV then lose their long-range lamellar order, which results in their complete disruption and the concomitant expulsion of PLL. Below pH 3, this mechanism leads to the precipitation of a polyelectrolyte-free lamellar, L, phase, which is also observed for PEC-free G-C18:1 solutions.41
A closer look at the experiments in Figure 4 indicates two additional features. The pH stability domain of the MLWV phase seems to vary with the lipid:PLL ratio. Comparison of
12
Figure 4c and Figure 4d, respectively recorded at lipid:PLL= 1:1 and 1:2 reveal that the q1 peak
of the MLWV phase is observed between pH 8 and 7. At the 1:2 ratio the MLWV phase starts at about pH 8 while at the 1:1 ratio the MLWV phase is only visible at pH below 7. At higher concentrations (C= 10 mg.mL-1), but still for a 1:1 ratio, the stability frontier seems to be shifted at pH of about 7.5.41 Although we do not have enough data to draw a general trend, it is well-known that the lipid:polyelectrolyte ratio reflects the negative:positive charge ratio and for this reason it has a direct impact on the electroneutrality, thus affecting a number of structural features of PESCs: the wall thickness of the multilamellar structure,21,62 the PESC morphology and colloidal stability.19 For instance, order is noticeably improved when the charge ratio approaches 1:1,63 and micelle-polyelectrolyte complex coacervation can be favored or not.64 This ratio is particularly crucial to control the properties of the lipoplexes and thus their applications: lipid/DNA ratio was reported to influence both the formation of lipoplexes and the release of DNA65 and gene transfer activity.66 Many authors have shown that the lipid:polyelectrolyte ratio actually controls the formation of MLWV structures19,29,32–35 over agglutinated single-wall vesicles,36–38 but in fact it is more likely that a general consensus has not been found, yet, and reality often consists in a mixtures of MLWV and agglutinated vesicles,39 although many authors do not specify it. One of the reasons that could explain such discrepancy is the parallel influence of several other parameters like the charge density on both the lipid membrane and in the polyelectrolytes, the rigidity of the latter, the bending energy of the lipid membrane, the ionic strength and so on.14,19 In the present case, it is important to note
that: 1) G-C18:1 forms a stable MLWV phase with all PEC tested in this work and of different origin (biobased vs. synthetic) and rigidity. 2) MLWV are stable in the neutral pH range, which can be a good opportunity for applications in the biomedical field, for instance.
An interesting remark concerns the long-range order inside the vesicular multilamellar walls. The width of the lamellar peak around q ~0.2 Å-1 is more than ten times larger for the CHL (Figure 4e, Δq ~3.10-2 Å-1) than the PLL (Figure 4c,d, Δq ~2.10-3 Å-1) system, either suggesting an average smaller size of the lamellar domains or a poorer lamellar order in the case of the MLWV obtained from CHL. The reason behind such difference could be the bulkiness and stiffness of CHL with respect to PLL,32 but one should recall from Figure 2 and related discussion that [G-C18:1 + CHL] solutions do not form an extensive Co phase. We have already made the hypothesis that the Co phase is necessary to form the MLWV phase,41 and we will reinforce this assumption in the next part of this work.
13
Figure 5 – pH-resolved in situ 2D SAXS contour plots of a) gelatin (C= 2.5 mg.mL-1) and b) [G-C18:1 + gelatin] mixture (CG-C18:1= CGelatin= 2.5 mg.mL-1).
The data collected so far show that G-C18:1 interacts with all polyelectrolytes tested in this work and that its micelle-to-vesicle phase transition drives the Co-to-MLWV transition. As one could reasonably expect, and actually confirmed by ITC,41 strong specific electrostatic interactions, electrostatic n nature, between the positively charged PEC and negatively charged G-C18:1 drive the PESC formation across the entire pH range. To test the solidity of the PESCs synthesis using G-C18:1 and PECs, we employ gelatin, a polyampholyte, as a possible alternative to polyelectrolytes and which could be interesting to prepare biobased PESCs. We use a commercial (Aldrich) source of gelatin type A, a natural protein of isoelectric point between 7.0-9.0, below which the charge becomes positive. Figure 5 shows pH-resolved in situ contour plots of gelatin and [G-C18:1 + gelatin] samples. The control gelatin sample in Figure 5a shows no specific contribution across the entire pH range between 0.1 < q / Å-1 < 0.4. Interestingly, the [G-C18:1 + gelatin] sample presented in Figure 5b does not show any signal either in the same pH and q range, except for the systematic signal of the lamellar, L, phase of G-C18:1 below pH 4.41,42
Despite an expected positive charge density of gelatin, the in situ SAXS experiment shows no sign of the Co phase above pH 7, indicating that the charge density is probably too low to interact with negatively charged G-C18:1 micelles. Although somewhat unexpected because interactions with negatively charged sodium dodecyl sulfate micelles across a wide compositional and pH range were reported in other studies,67 this result is not a surprise. What
14
it is more interesting from a mechanistic point of view is the lack of the MLWV phase below pH 7. Given its isoelectric point, type A gelatin is positively charged below pH 7 and it is then expected to interact with G-C18:1 negative membranes.
In this work we have used a broad set of polyelectrolytes, of which the different chemical nature let us explore various aspects of their interactions with G-C18:1. If the nature of the polyelectrolyte (stiffness, charge density, …) is known to strongly affect the morphology and structure of PESCs,14,32 in this work we show that: 1) when the Co and MLWV phases are formed, the structure of the corresponding colloidal structures is very similar, whichever the polyelectrolyte used, even if local phenomena like swelling or long-range order may vary from one polyelectrolyte to another. 2) The Co and MLWV phases are only obtained with polyelectrolytes with a net positive charge, that is polycations. 3) The MLWV phase is always preceded by the Co phase, which seems to be a necessary condition to drive the isostructural and isodimensional Co-to-MLWV transition. This phenomenon does not occur when gelatin is employed and where the MLWV phase is not observed. On the contrary, the MLWV phase is obtained for the CHL system, despite the fact that we do not have a proof by SAXS of the Co phase. In this regard, we must outline that the SAXS signal for the [G-C18:1 + CHL] system at basic pH is dominated by the precipitated CHL phase, which we think to be in major amount but not the only phase. Cryo-TEM shows the presence of an unknown fraction of complex coacervates, which we believe to be source of the MLWV phase at pH below 7. We also believe that the higher disorder of the MLWV phase in the [G-C18:1 + CHL] system (broader first order diffraction peak compared to the PLL-derived MLWV in Figure 4e) could be attributed to the smaller fraction of the initial Co phase. In other words, the presence of a less ordered MLWV phase in the CHL system could then the indirect proof that probably a small fraction of the Co phase forms in the CHL system.
Quantitativity and size control
If the synthesis of PESCs involving vesicles and polyelectrolytes, and eventually forming MLWV, has long been addressed in the literature,37,68,69 very few studies, if none, address the issue of quantitativity in relationship to the mechanism of formation. In particular, the synthesis of MLWV from a continuous isostructural phase transition from a coacervate phase has not been addressed before, because MLWV are generally obtained by mixing vesicles and polyelectrolytes in solution.19,29,32–35,37 If some authors state that the formation of MLWV is driven by the lipid:polyelectrolyte ratio, other authors show that a mix of agglutinated vesicles and MLWV are actually obtained.38,39 Other procedures could probably be followed to
15
increase this control when working with pre-formed vesicles, such as the insertion of the polymer into the hydrophobic vesicle bilayer, which was reported in the case of polycations bearing pendant hydrophobic groups.37,70 However, it was found that such interaction could be
accompanied by lateral lipid segregation, highly accelerated transmembrane migration of lipid molecules (polycation-induced flip-flop), incorporation of adsorbed polycations into vesicular membrane as well as aggregation and disruption of vesicles.70
To evaluate the amount of MLWV with respect to agglutinated vesicles, we compare the sample obtained by continuous Co-to-MLWV phase transition with a sample obtained by the more classical approach consisting in mixing G-C18:1 single-wall vesicles and polyelectrolyte, the main one employed in the literature of MLWV. If SAXS can prove the presence of a multilamellar structure, it cannot be easily employed to quantify and discriminate between the two structures. For this reason, instead of SAXS, we evaluate the content of MLWV between the two methods of preparation by combining cryo-TEM with optical microscopy using crossed polarizers. If cryo-TEM can differentiate between agglutination and MLWV, its high magnification is poorly compatible with good statistics, unless a large number of images are recorded. On the contrary, optical microscopy using cross polarizers is the ideal technique to differentiate, on the hundreds of micron scale, between MLWV and agglutinated vesicles: multilamellar structures (but not single-wall vesicles) show a characteristic maltese cross pattern71 under crossed polarizers, found both in concentric lamellar emulsions72 and in spherical lamellar structures.73
Cryo-TEM of samples obtained from a Co-to-MLWV phase transition was shown in Figure 4 and, as already commented above, they show a massive presence of vesicular structures having multilamellar walls, as also confirmed by the corresponding SAXS data presented in Figure 4. Figure 6 shows two representative microscopy images of a typical sample prepared with the same approach; images are collected under white (a,d) and polarized light with polarizers at 0°-90° (b,e) and 45°-135° (c,f). The system is characterized by a large number of vesicles highly heterogeneous in size but all below ~10 μm. Under polarized light and crossed polarizers, the entire material displays a typical maltese cross colocalized with each vesicle. Despite the aggregation of the vesicles, also observed with cryo-TEM, maltese crosses are well-defined and nicely separated and each identifying single multilamellar wall vesicles. The entire material displays such a characteristic birefringency, strongly suggesting a quantitative presence of MLWV.
16
Figure 6 – Optical microscopy images recorded on a [G-C18:1 + PLL] solution (CG-C18:1= CPLL= 2.5 mg.mL -1) at pH 3.9 obtained from a Co-to-MLWV phase transition. a,d) white light and polarized light with cross polarizers set at b,e) 0-90° and c,f) 45-135°.
The experiment consisting in mixing acidic solutions (pH 3.8) of pre-formed G-C18:1 single-wall vesicles and PLL is shown in Figure 7. A preliminary investigation by optical microscopy results in a different behavior and distribution of signal with respect to the sample obtained through the Co-to-MLWV phase transition. Figure 7a shows representative images of a sample being constituted of aggregated objects, each of size below 1 μm, expected for G-C18:1 vesicles.43 The corresponding images recorded using crossed polarizers (Figure 7b,d) show a broad, undefined, birefringency associated to the aggregates with little, if no, content of maltese crosses. The featureless, generalized, birefringency signal suggests that MLWV are either not formed or they form in small amounts, in good agreement with the data presented by others.38,39 This assumption is confirmed by cryo-TEM images recorded on the same system and showing a mixture of structures including agglutinated vesicles but also “cabbage-like” and multilamellar structures (Figure 7e-f).
The massive presence of MLWV structures obtained through the phase transition process compared to the mixture of structure obtained from a direct mixing of pre-formed vesicles-polyelectrolyte solutions confirms the crucial role of the complex coacervates in the formation of MLWV: coacervation seems to be a requirement to the extensive formation of vesicular structures with multilamellar walls.41 This is also in agreement with the data obtained
from the [G-C18:1 + gelatin] system presented in Figure 5 and prepared using the pH variation approach. Also in that case, the absence of a complex coacervate phase had as a consequence
17
the absence of the MLWV phase. An additional piece of evidence comes from the CHL system, in which the limited amount of the Co phase generates a more disordered MLWV phase. Combination of the data obtained with gelatin and employing the in situ pH variation with the data obtained by mixing vesicle and polyelectrolyte solutions at a given pH demonstrates the importance of the precursor Co phase during the phase change method in order to obtain a massive presence of MLWV structures.
Figure 7 – a-d) Optical microscopy images recorded on a mixture of [G-C18:1] single-wall vesicles and [PLL] solutions (CG-C18:1= CPLL= 2.5 mg.mL-1) both prepared at pH= 3.8. a,c) white light and b,d) polarized light with cross polarizers set at 0-90°. Images in e,f) are recorded on the same sample by mean of cryo-TEM.
If the Co-to-MLWV phase transition is able to quantitatively produce MLWV, its main drawback is the poor control over their size distribution, as shown both by TEM and optical microscopy. To improve this point, we employed filtration (Figure 8a-c) and sonication (Figure 8d-f), these methods being known to efficiently control vesicles size distribution,74 but unclear
18
whether or not they have any deleterious impact on the MLWV structure. According to the cryo-TEM data in Figure 8a-c, filtration (pore size, φ= 450 nm) promotes the stabilization of colloidally-stable spherical MLWV, of which the diameter seems to be contained between 50 nm and about 300 nm, in agreement with the filter pore size. Concerning the effect of sonication, Figure 8d-f also shows a large number of spherical, un-aggregated, MLWV colloids, although the diameter appears to be bigger of several hundred nanometers if compared to the filtered sample. The cryo-TEM results are confirmed by intensity-filtered DLS experiments, presented in Figure 8g. The as-prepared sample (black curve) shows a MLWV distribution centered at 716 nm, while the filtered sample shows a distribution centered at 460 nm. To better evaluate the impact of sonication, we tested the influence of sonication time and according to DLS data (Figure 8g) we find that at t= 30’ the size distribution is centered at higher diameter values and it is even broader than the as-prepared sample. Applying the same sonication conditions, but over a longer period of time (t= 1’ or t= 1’30’’), it is possible to reduce the MLWV diameter even if the size distribution is broader than the filtration approach, in agreement with the cryo-TEM data.
These experiments show that control of the size distribution of MLWV is possible using standard methods employed in liposome science without perturbing the multilamellar wall structure.
19
Figure 8 - Cryo-TEM images of a [G-C18:1 + PLL] solution (pH=5, CG-C18:1= CPLL= 2.5 mg.mL-1) prepared using the Co-to-MLWV approach and a-c) filtered through a φ= 450 nm pores membrane or d-f) sonicated (ultrasound, US, technical data: t= 1’, P= 40 W, Ampl.= 40%, freq.= 100%). g) profiles of the as prepared (black curve), filtered (φ= 450 nm pores membranes, red curve) and sonicated (US, technical data: P= 40 W, Ampl.= 40%, freq.= 100%, time is given on graph) MLWV samples
Conclusion
a)
b)
c)
d)
e)
f)
g)
102 103 0 10 20 30 40 50 Inten sity / % dh / nm As Prepared Filtered (= 450 nm) US t= 30'' US t= 1' US t= 1'30''20
This work addresses the synthesis of multilamellar wall vesicles (MLWV) using a recently developed method involving a pH-stimulated transition from a complex coacervate phase (Co) instead of a polyelectrolyte-driven vesicle agglutination, classically-employed in the preparation of MLWV polyelectrolyte surfactant complexes (PESCs). We use a combination of a stimuli-responsive microbial glycolipid biosurfactant and a polyelectrolyte, mainly polyamines (either synthetic or natural). The deacetylated acidic C18:1 glucolipid, G-C18:1, undergoes a micelle-to-vesicle phase transition from alkaline to acidic pH. In the alkaline pH domain, its phase behavior is mainly characterized by negatively-charged micelles. In the presence of a positively charged polyelectrolyte, G-C18:1 forms a Co phase. Upon lowering pH below the micelle-vesicle boundary, in situ SAXS experiments show a continuous isostructural and isodimensional transition between the Co and MLWV phase. The acidification process reducing the negative charge density, the micellar aggregates embedded in the Co phase undergo a decrease in the local curvature, which drives the transition from spheres to membranes, made of interdigitated G-C18:1 molecules. The membrane has a residual negative charge density, responsible for the strong electrostatic interaction with the polyelectrolyte, crucial to maintain the membranes together. At lower pH, the membrane charge density becomes low and interactions with the polyelectrolyte decrease. This phenomenon promotes intra-chain electrostatic repulsion interactions and eventually encourage the lamellar region to swell. Finally, when the membrane reaches neutrality, polymeric repulsion becomes strong enough to disassemble the lamellae. The polyelectrolyte will most likely be entirely solvated and at sufficiently low pH (< 3) the G-C18:1 precipitates in the form of a lamellar phase, possibly free of the polyelectrolyte, a behavior characteristic of the control lipid solution at the same pH.
We employ four polyelectrolytes, synthetic and natural and with different characteristics of rigidity and charge density (chitosan, poly-L-Lysine, polyethylene imine, polyallylamine); however, the nature of the polyelectrolyte does not seem to be a relevant parameter concerning the fate of the transition, as otherwise found for most PESCs. This may be explained by the strong proximity between the lipid and the polyelectrolyte throughout the isostructural
Co-to-MLWV transition. If the method described in this work does not allow a tight control over the
size distribution of MLWV, we also find that the multilamellar wall structure is stable against filtration and sonication, two common methods employed to control the size of vesicles. Last but not least, we show that if we employ the classical approach consisting in mixing pre-formed vesicles with a cationic polyelectrolyte solution at a given pH, we find a much broader structural
21
diversity, including agglutinated single-wall vesicles, multilamellar but also cabbage-like structures, in agreement with previous literature studies.
All in all, this work establishes the ground for the preparation of a new generation of fully biobased, stimuli-responsive, PESCs, of which the potential fields of applications could span from cosmetics to home-care products.
Acknowledgements
Diamond synchrotron radiation facility (U. K.) is acknowledged for accessing to the B21 beamline and financial support (proposal N° 23247), as well as Soleil Synchrotron facility for accessing the Swing beamline and financial support (proposal N° 20190961). Ghazi Ben Messaoud (DWI-Leibniz Institute for Interactive Materials, Aachen, Germany) is kindly acknowledged for helpful discussions. We thank Dr. S. Roelants, Prof. W. Soetaert and Prof. C. V. Stevens at Gent University for providing us the glycolipid. Sorbonne Université (contract N°3083/2018) is acknowledged for financial support of CS. Authors kindly acknowledge the French ANR, Project N° SELFAMPHI - 19-CE43-0012-01.
Authors’ contributions
CS performed the experiments, analyzed the data and wrote the manuscript. PG performed the cryo-TEM experiments. NC and JP assisted the SAXS experiments. NB conceived and supervised the work and wrote the manuscript.
Supporting Information: Figure S1
References
(1) Morán, M. C.; Miguel, M. G.; Lindman, B. Surfactant−DNA Gel Particles: Formation and Release Characteristics. Biomacromolecules 2007, 8, 3886–3892.
(2) Dobrynin, A. V.; Rubinstein, M. Theory of Polyelectrolytes in Solutions and at Surfaces. Prog. Polym. Sci. 2005, 30, 1049–1118.
(3) Wong, G. C. L. Electrostatics of Rigid Polyelectrolytes. Curr. Opin. Colloid Interface
Sci. 2006, 11, 310–315.
22
and Dynamics of Strongly Charged Soft Matter. Phys. Rep. 2005, 416, 129–199. (5) White, S. R.; Moore, J. S.; Sottos, N. R.; Krull, B. P.; Santa Cruz, W. A.; Gergely, R.
C. R. Restoration of Large Damage Volumes in Polymers. Science (80-. ). 2014, 344, 620–623.
(6) Prausnitz, M. R.; Langer, R. Transdermal Drug Delivery. Nat. Biotechnol. 2008, 26, 1261–1268.
(7) Drummond, C. J.; Fong, C. Surfactant Self-Assembly Objects as Novel Drug Delivery Vehicles. Curr. Opin. Colloid Interface Sci. 1999, 4, 449–456.
(8) Singh, M.; Briones, M.; Ott, G.; Hagan, D. O. Cationic Microparticles: A Potent Delivery System for DNA Vaccines. PNAS 2000, 97, 811–816.
(9) Takahashi, A.; Kawaguchi, M. The Structure of Macromolecules Adsorbed on Interfaces. Adv. Polym. Sci. 1982, 46, 1–65.
(10) Müller, M. Polyelectrolyte Complexes in the Dispersed and Solid State II Application
Aspects; 2013.
(11) Petzold, G.; Schwarz, S. Polyelectrolyte Complexes in Flocculation Applications. Adv.
Polym. Sci. 2014, 256, 25–65.
(12) Kötz, J.; Kosmella, S.; Beitz, T. Self-Assembled Polyelectrolyte Systems. Prog. Polym.
Sci. 2001, 26, 1199–1232.
(13) Langevin, D. Complexation of Oppositely Charged Polyelectrolytes and Surfactants in Aqueous Solutions. A Review. Adv. Colloid Interface Sci. 2009, 147–148, 170–177. (14) Chiappisi, L.; Hoffmann, I.; Gradzielski, M. Complexes of Oppositely Charged
Polyelectrolytes and Surfactants - Recent Developments in the Field of Biologically Derived Polyelectrolytes. Soft Matter 2013, 9, 3896–3909.
(15) Piculell, L.; Norrman, J.; Svensson, A. V.; Lynch, I.; Bernardes, J. S.; Loh, W. Ionic Surfactants with Polymeric Counterions. Adv. Colloid Interface Sci. 2009, 147–148, 228–236.
(16) Piculell, L. Understanding and Exploiting the Phase Behavior of Mixtures of
Oppositely Charged Polymers and Surfactants in Water. Langmuir 2013, 29, 10313– 10329.
(17) Lindman, B.; Antunes, F.; Aidarova, S.; Miguel, M.; Nylander, T. Polyelectrolyte-Surfactant Association—from Fundamentals to Applications. Colloid J. 2014, 76, 585– 594.
(18) Schillén, K.; Galantini, L.; Du, G.; Del Giudice, A.; Alfredsson, V.; Carnerup, A. M.; Pavel, N. V.; Masci, G.; Nyström, B. Block Copolymers as Bile Salt Sequestrants:
23
Intriguing Structures Formed in a Mixture of an Oppositely Charged Amphiphilic Block Copolymer and Bile Salt. Phys. Chem. Chem. Phys. 2019, 21, 12518–12529. (19) Gradzielski, M.; Hoffmann, I. Polyelectrolyte-Surfactant Complexes (PESCs)
Composed of Oppositely Charged Components. Curr. Opin. Colloid Interface Sci.
2018, 35, 124–141.
(20) Kronberg, B.; Holmberg, K.; Lindman, B. Surfactant–Polymer Systems. In Surface
Chemistry of Surfactants and Polymers; Kronberg, B., Holmberg, K., Lindman, B.,
Eds.; John Wiley & Sons, Ltd., 2014; pp 271–294.
(21) Chiappisi, L.; Prévost, S.; Grillo, I.; Gradzielski, M. From Crab Shells to Smart Systems: Chitosan-Alkylethoxy Carboxylate Complexes. Langmuir 2014, 30, 10615– 10616.
(22) Bilalov, A.; Olsson, U.; Lindman, B. Complexation between DNA and Surfactants and Lipids: Phase Behavior and Molecular Organization. Soft Matter 2012, 8, 11022– 11033.
(23) Ferreira, G. A.; Loh, W. Liquid Crystalline Nanoparticles Formed by Oppositely Charged Surfactant-Polyelectrolyte Complexes. Curr. Opin. Colloid Interface Sci.
2017, 32, 11–22.
(24) Kizilay, E.; Dinsmore, A. D.; Hoagland, D. A.; Sun, L.; Dubin, P. L. Evolution of Hierarchical Structures in Polyelectrolyte-Micelle Coacervates. Soft Matter 2013, 9, 7320–7332.
(25) Kizilay, E.; Kayitmazer, A. B.; Dubin, P. L. Complexation and Coacervation of Polyelectrolytes with Oppositely Charged Colloids. Adv. Colloid Interface Sci. 2011,
167, 24–37.
(26) Duarte, S.; Faneca, H.; Pedroso De Lima, M. C. Non-Covalent Association of Folate to Lipoplexes: A Promising Strategy to Improve Gene Delivery in the Presence of Serum.
J. Control. Release 2011, 149, 264–272.
(27) Dias, R. S.; Dawson, K.; Miguel, M. G. Interaction of DNA with Surfactants in Solution. In DNA Interactions with Polymers and Surfactants; Dias, R., Lindman, B., Eds.; Hoboken, New Jersey, 2008; pp 89–117.
(28) Chen, Y.; Zhu, Q.; Tian, Y.; Tang, W.; Pana, F.; Rulin Xiong, Y.; Yuan, Y.; Hu, A.; 5. Supramolecular Aggregates from Polyacrylates and Gd(III)-Containing Cationic Surfactant as High-Relaxivity MRI Contrast Agents. Polym. Chem. 2015, 6, 1521– 1526.
24
Single DNA Molecules: Compaction and Decompaction. In DNA Interactions with
Polymers and Surfactants; Dias, R., Lindman, B., Eds.; John Wiley & Sons, Inc.:
Hoboken, New Jersey, 2008; pp 59–88.
(30) Rafael, D.; Andrade, F.; Arranja, A.; Luís, S.; Videira, M. Lipoplexes and Polyplexes: Gene Therapy. Encycl. Biomed. Polym. Polym. Biomater. 2015, No. August 2016, 4335–4347.
(31) Golan, S.; Talmon, Y. Nanostructure of Complexes between Cationic Lipids and an Oppositely Charged Polyelectrolyte. Langmuir 2012, 28, 1668–1672.
(32) Ram-On, M.; Cohen, Y.; Talmon, Y. Effect of Polyelectrolyte Stiffness and Solution PH on the Nanostructure of Complexes Formed by Cationic Amphiphiles and
Negatively Charged Polyelectrolytes. J. Phys. Chem. B 2016, 120, 5907–5915.
(33) Weisman, S.; Hirsch-Lerner, D.; Barenholz, Y.; Talmon, Y. Nanostructure of Cationic Lipid-Oligonucleotide Complexes. Biophys. J. 2004, 87, 609–614.
(34) Huebner, S.; Battersby, B. J.; Grimm, R.; Cevc, G. Lipid-DNA Complex Formation: Reorganization and Rupture of Lipid Vesicles in the Presence of DNA as Observed by Cryoelectron Microscopy. Biophys. J. 1999, 76, 3158–3166.
(35) Chiappisi, L.; Gradzielski, M. Co-Assembly in Chitosan-Surfactant Mixtures: Thermodynamics, Structures, Interfacial Properties and Applications. Adv. Colloid
Interface Sci. 2015, 220, 92–107.
(36) Marques, E. F.; Regev, O.; Khan, A.; Miguel, M. D. G.; Lindman, B. Interactions between Catanionic Vesicles and Oppositely Charged Polyelectrolytes - Phase Behavior and Phase Structure. Macromolecules 1999, 32, 6626–6637.
(37) Antunes, F. E.; Marques, E. F.; Miguel, M. G.; Lindman, B. Polymer-Vesicle Association. Adv. Colloid Interface Sci. 2009, 147–148, 18–35.
(38) De Souza, T. P.; Bossa, G. V.; Stano, P.; Steiniger, F.; May, S.; Luisi, P. L.; Fahr, A. Vesicle Aggregates as a Model for Primitive Cellular Assemblies. Phys. Chem. Chem.
Phys. 2017, 19, 20082–20092.
(39) Gasperini, A. A. M.; Puentes-Martinez, X. E.; Balbino, T. A.; De Paula Rigoletto, T.; De Sá Cavalcanti Corrêa, G.; Cassago, A.; Portugal, R. V.; De La Torre, L. G.;
Cavalcanti, L. P. Association between Cationic Liposomes and Low Molecular Weight Hyaluronic Acid. Langmuir 2015, 31, 3308–3317.
(40) Chiappisi, L.; David Leach, S.; Gradzielski, M. Precipitating Polyelectrolyte-Surfactant Systems by Admixing a Nonionic Surfactant-a Case of Cononsurfactancy. Soft Matter
25
(41) Seyrig, C.; Griel, P. Le; Cowieson, N.; Perez, J.; Baccile, N. Stimuli-Induced Non-Equilibrium Phase Transitions in Polyelectrolyte-Surfactant Complex Coacervates.
Langmuir 2020, 10.1021/acs.langmuir.0c01177.
(42) Baccile, N.; Cuvier, A.-S.; Prévost, S.; Stevens, C. V.; Delbeke, E.; Berton, J.; Soetaert, W.; Van Bogaert, I. N. A.; Roelants, S. Self-Assembly Mechanism of PH-Responsive Glycolipids: Micelles, Fibers, Vesicles, and Bilayers. Langmuir 2016, 32, 10881– 10894.
(43) Baccile, N.; Selmane, M.; Le Griel, P.; Prévost, S.; Perez, J.; Stevens, C. V.; Delbeke, E.; Zibek, S.; Guenther, M.; Soetaert, W.; et al. PH-Driven Self-Assembly of Acidic Microbial Glycolipids. Langmuir 2016.
(44) Cuvier, A. S.; Berton, J.; Stevens, C. V.; Fadda, G. C.; Babonneau, F.; Van Bogaert, I. N. A.; Soetaert, W.; Pehau-Arnaudet, G.; Baccile, N. PH-Triggered Formation of Nanoribbons from Yeast-Derived Glycolipid Biosurfactants. Soft Matter 2014, 10, 3950–3959.
(45) Liu, W.; Sun, S.; Cao, Z.; Zhang, X.; Yao, K.; Lu, W. W.; Luk, K. D. K. An Investigation on the Physicochemical Properties of Chitosan/DNA Polyelectrolyte Complexes. Biomaterials 2005, 26, 2705–2711.
(46) Lewis, S. R.; Datta, S.; Gui, M.; Coker, E. L.; Huggins, F. E.; Daunert, S.; Bachas, L.; Bhattacharyya, D. Reactive Nanostructured Membranes for Water Purification. Proc.
Natl. Acad. Sci. U. S. A. 2011, 108, 8577–8582.
(47) Mady, M. M.; Mohammed, W. A.; El-Guendy, N. M.; Elsayed, A. A. Effect of
Polymer Molecular Weight on the Dna/Pei Polyplexes Properties. J. Biophys 2011, 21, 151–165.
(48) Ben Messaoud, G.; Le Griel, P.; Hermida-Merino, D.; Roelants, S. L. K. W.; Soetaert, W.; Stevens, C. V.; Baccile, N. PH-Controlled Self-Assembled Fibrillar Network (SAFiN) Hydrogels: Evidence of a Kinetic Control of the Mechanical Properties.
Chem. Mater. 2019, 31, 4817–4830.
(49) Hayward, D. W.; Chiappisi, L.; Teo, J. H.; Prévost, S.; Schweins, R.; Gradzielski, M. Neutralisation Rate Controls the Self-Assembly of PH-Sensitive Surfactants. Soft
Matter 2019, 15, 8611–8620.
(50) Schindelin, J.; Arganda-Carreras, I.; Frise, E.; Kaynig, V.; Longair, M.; Pietzsch, T.; Preibisch, S.; Rueden, C.; Saalfeld, S.; Schmid, B.; et al. Fiji: An Open-Source Platform for Biological-Image Analysis. Nat. Methods 2012, 9, 676–682.
26
Baccile, N. Complex Coacervation of Natural Sophorolipid Bolaamphiphile Micelles with Cationic Polyelectrolytes. Green Chem. 2018, 20, 3371–3385.
(52) Lieckfeldt, R.; Villalaín, J.; Gómez-Fernández, J.-C.; Lee, G. Apparent Pka of the Fatty Acids Within Ordered Mixtures of Model Human Stratum Corneum Lipids. Pharm.
Res. 1995, 12, 1614–1617.
(53) Swanson-Vethamuthu, M.; Dubin, P. L.; Almgren, M.; Yingjie, L. Cryo-TEM of Polyelectrolyte – Micelle Complexes. J. Colloid Interface Sci. 1997, 186, 414–419. (54) Koga, S.; Williams, D. S.; Perriman, A. W.; Mann, S. Peptide-Nucleotide
Microdroplets as a Step towards a Membrane-Free Protocell Model. Nat. Chem. 2011,
3, 720–724.
(55) Kayitmazer, A. B.; Strand, S. P.; Tribet, C.; Jaeger, W.; Dubin, P. L. Effect of Polyelectrolyte Structure on Protein - Polyelectrolyte Coacervates: Coacervates of Bovine Serum Albumin with Poly(Diallyldimethylammonium Chloride) versus Chitosan. Biomacromolecules 2007, 8, 3568–3577.
(56) Tanford, C. The Hydrophobic Effect: Formation of Micelles and Biological
Membranes; Wiley-Interscience, 1973.
(57) Cuvier, A. S.; Babonneau, F.; Berton, J.; Stevens, C. V.; Fadda, G. C.; Péhau-Arnaudet, G.; Le Griel, P.; Prévost, S.; Perez, J.; Baccile, N. Nanoscale Platelet Formation by Monounsaturated and Saturated Sophorolipids under Basic PH Conditions. Chem. - A Eur. J. 2015, 21, 19265–19277.
(58) Teixeira, J. Small-Angle Scattering by Fractal Systems. J. Appl. Crystallogr. 1988, 21, 781–785.
(59) Rinaudo, M. Chitin and Chitosan: Properties and Applications. Prog. Polym. Sci. 2006,
31, 603–632.
(60) Sjöström, L.; Åkesson, T.; Jönsson, B. Interaction and Conformation of Polyelectrolyte Chains Adsorbed on Neutral Surfaces. J. Chem. Phys. 1993, 99, 4739–4747.
(61) Fleer, G. J.; Stuart, M. A. C.; Scheutjens, J. M. H. M.; Cosgrove, T.; Vincent, B.
Polymers at Interfaces, 1998th ed.; Springer-Science, 1998.
(62) Gerelli, Y.; Di Bari, M. T.; Deriu, A.; Clemens, D.; Almásy, L. Lipid Multilayered Particles: The Role of Chitosan on Structure and Morphology. Soft Matter 2010, 6, 2533–2538.
(63) Kogej, K.; Evmenenko, G.; Theunissen, E.; Berghmans, H.; Reynaers, H. Investigation of Structures in Polyelectrolyte/Surfactant Complexes by X-Ray Scattering. Langmuir
27
(64) Wang, Y.; Kimura, K.; Dubin, P. L.; Jaeger, W. Polyelectrolyte-Micelle Coacervation: Effects of Micelle Surface Charge Density, Polymer Molecular Weight, and
Polymer/Surfactant Ratio. Macromolecules 2000, 33, 3324–3331.
(65) Tarahovsky, Y. S.; Koynova, R.; MacDonald, R. C. DNA Release from Lipoplexes by Anionic Lipids: Correlation with Lipid Mesomorphism, Interfacial Curvature, and Membrane Fusion. Biophys. J. 2004, 87, 1054–1064.
(66) Zhou, S.; Chu, B. Assembled Materials: Polyelectrolyte-Surfactant Complexes. Adv.
Mater. 2000, 12, 545–556.
(67) Greener, J.; Contestable, B. A.; Bale, M. D. Interaction of Anionic Surfactants with Gelatin: Viscosity Effects. Macromolecules 1987, 20, 2490–2498.
(68) Bordi, F.; Cametti, C.; Diociaiuti, M.; Gaudino, D.; Gili, T.; Sennato, S. Complexation of Anionic Polyelectrolytes with Cationic Liposomes: Evidence of Reentrant
Condensation and Lipoplex Formation. Langmuir 2004, 20, 5214–5222.
(69) Rozenfeld, J. H. K.; Duarte, E. L.; Barbosa, L. R. S.; Lamy, M. T. The Effect of an Oligonucleotide on the Structure of Cationic DODAB Vesicles. Phys. Chem. Chem.
Phys. 2015, 17, 7498–7506.
(70) Yaroslavov, A.; Kabanov, V. What Happens to Negatively Charged Vesicles upon Interacting with Polycation Species? Am. Chem. Soc. Polym. Prepr. Div. Polym. Chem.
2000, 41, 1613.
(71) Regev, O. Various Bilayer Organizations in a Single-Tail Nonionic Surfactant: Unilamellar Vesicles, Multilamellar Vesicles, and Flat-Stacked Lamellae. Langmuir
1999, 15, 4357–4364.
(72) Park, B. D.; Youm, J. K.; Jeong, S. K.; Choi, E. H.; Ahn, S. K.; Lee, S. H. The Characterization of Molecular Organization of Multilamellar Emulsions Containing Pseudoceramide and Type III Synthetic Ceramide. J. Invest. Dermatol. 2003, 121, 794– 801.
(73) Harris, J. K.; Rose, G. D.; Bruening, M. L. Spontaneous Generation of Multilamellar Vesicles from Ethylene Oxide/Butylene Oxide Diblock Copolymers. Langmuir 2002,
18, 5337–5342.
(74) Pereira-Lachataignerais, J.; Pons, R.; Panizza, P.; Courbin, L.; Rouch, J.; López, O. Study and Formation of Vesicle Systems with Low Polydispersity Index by Ultrasound Method. Chem. Phys. Lipids 2006, 140, 88–97.
1
Supplementary information
Synthesis of multilamellar walls vesicles polyelectrolyte-surfactant
complexes from pH-stimulated phase transition using microbial
biosurfactants
Chloé Seyriga, Patrick Le Griela, Nathan Cowieson,b Javier Perez,c Niki Baccilea
a Sorbonne Université, Centre National de la Recherche Scientifique, Laboratoire de Chimie de
la Matière Condensée de Paris , LCMCP, F-75005 Paris, France
b Diamond Light Source Ltd, Diamond House, Harwell Science & Innovation Campus,
Didcot, Oxfordshire, OX11 0DE
c Synchrotron SOLEIL, L'Orme des Merisiers Saint-Aubin, BP 48 91192 Gif-sur-Yvette
Cedex
2 a)
3 c)
d)
Figure S 1 - Additional cryo-TEM images and zooms on layers of MLWV made of G-C18:1 (2.5 mg.mL-1) + a) CHL (1 mg.mL-1 , pH 4.87) , b) PAH (0.25 mg.mL-1, pH 4.25), c) PEI (2.5 mg.mL-1, pH 5.33) and d) PLL (2.5 mg.mL-1, pH 4.70)
4
Figure S 2 - SAXS profiles of [G-C18:1] (black) and [CHL] (red) control and [G-C18:1 + CHL] (blue) solutions (CG-C18:1= 2.5 mg.mL-1, CCHL= 1 mg.mL-1) at a) pH= 4.73 and b) pH= 8.81. The green [G-C18:1] + [CHL] profiles correspond to the arithmetic sum of [G-C18:1] + [CHL] individual SAXS profiles.
0.01 0.1 10-4 10-3 10-2 10-1 100 101 102


![Figure 7 – a-d) Optical microscopy images recorded on a mixture of [G-C18:1] single-wall vesicles and [PLL] solutions (C G-C18:1 = C PLL = 2.5 mg.mL -1 ) both prepared at pH= 3.8](https://thumb-eu.123doks.com/thumbv2/123doknet/14392606.508445/18.892.208.690.283.900/figure-optical-microscopy-recorded-mixture-vesicles-solutions-prepared.webp)