HAL Id: hal-01579073
https://hal.inria.fr/hal-01579073
Submitted on 30 Aug 2017HAL is a multi-disciplinary open access archive for the deposit and dissemination of sci-entific research documents, whether they are pub-lished or not. The documents may come from teaching and research institutions in France or abroad, or from public or private research centers.
L’archive ouverte pluridisciplinaire HAL, est destinée au dépôt et à la diffusion de documents scientifiques de niveau recherche, publiés ou non, émanant des établissements d’enseignement et de recherche français ou étrangers, des laboratoires publics ou privés.
Review of recent Methodological Developments in
group-randomized trials: Part 1 - Design
Mélanie Prague, Elizabeth Turner, Li Fan, Gallis John, Murray David
To cite this version:
Mélanie Prague, Elizabeth Turner, Li Fan, Gallis John, Murray David. Review of recent Methodolog-ical Developments in group-randomized trials: Part 1 - Design. American Journal of Public Health, American Public Health Association, 2017. �hal-01579073�
REVIEW OF RECENT METHODOLOGICAL DEVELOPMENTS IN
1GROUP-RANDOMIZED TRIALS: PART 1 - DESIGN
23 4
Manuscript Click here to download Manuscript 20170128 GRT Review -Design FINAL.docx
ABSTRACT
5In 2004, Murray et al. published a review of methodological developments in both the design
6
and analysis of GRTs. In the thirteen years since, there have been many developments in both
7
areas. The goal of the current paper is to focus on developments in design with a companion
8
paper to focus on developments in analysis. As a pair, these papers update the 2004 review. This
9
design paper includes developments in topics included in the earlier review (e.g. clustering,
10
matching, and individually randomized group treatment trials) and new topics including
11
constrained randomization and a range of randomized designs that are alternatives to the
12
standard parallel-arm GRT. These include the stepped wedge GRT, the pseudo-cluster
13
randomized trial and the network-randomized GRT, which, like the parallel-arm GRT, require
14
clustering to be accounted for in both their design and analysis.
15
INTRODUCTION
16A group-randomized trial (GRT) is a randomized controlled trial in which the unit of
17
randomization is a group and outcome measurements are obtained on members of those groups.1
18
Also called a cluster randomized trial or community trial,2-5 a GRT is the best comparative
19
design available if the intervention operates at a group level, manipulates the physical or social
20
environment, cannot be delivered to individual members of the group without substantial risk of
21
contamination across study arms, or if there are other circumstances which warrant the design
22
such as a desire for herd immunity or a need to estimate both the direct and indirect intervention
23
effects in studies of infectious diseases.1-5
24
In GRTs, outcomes on members of the same group are likely to be more similar to each other
design of GRTs to avoid under-powering the study and accounted for in the analysis to avoid
27
under-estimated standard errors and inflated type I error for the intervention effect.1-5
28
In 2004, Murray et al.6 published a review of methodological developments in both the design
29
and analysis of GRTs. In the 13 years since, there have been many developments in both areas.
30
The goal of the current paper is to focus on developments in design with a companion paper to
31
focus on developments in analysis.7 As a pair, these papers update the 2004 review. With both
32
papers, we seek to provide a broad and comprehensive review to guide the reader to seek out
33
appropriate materials for their own circumstances.
34
DEVELOPMENTS IN FUNDAMENTALS OF DESIGN
35Clustering 36
In its most basic form, a GRT has a hierarchical structure with groups nested within study arm
37
and members nested within groups. Additional levels of nesting may arise through repeated
38
measures over time or from more complex group structures (e.g., children nested in classrooms
39
nested in schools). When designing and analyzing a GRT, it is necessary to account for the
40
clustering associated with the nested design.1-5
41
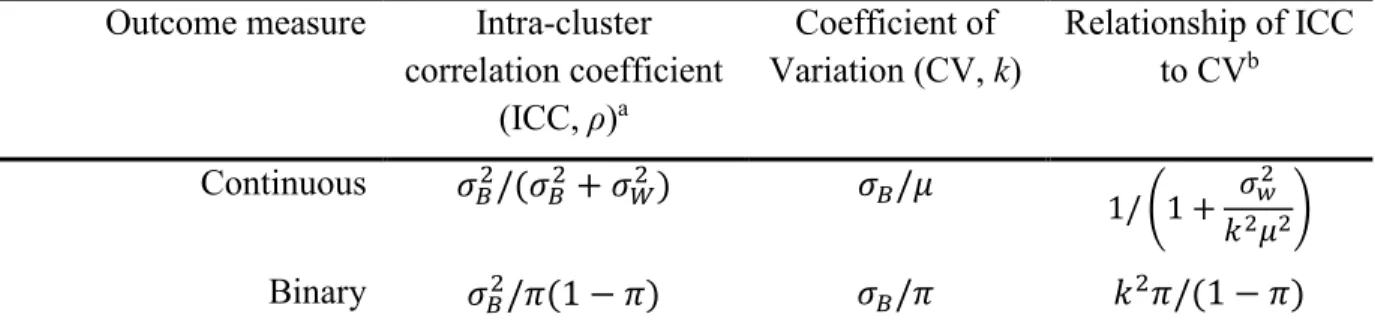
The intraclass correlation coefficient (ICC) is the clustering measure most commonly used in
42
power calculations and reported in published studies.8 Eldridge et al.9 provide a comprehensive
43
review of ICC definitions and measures in general clustered data for both continuous and binary
44
outcomes, the most commonly reported outcomes in GRTs.10,11 Whereas the ICC for continuous
45
outcome measures is well-defined and generally well understood,1-4 Eldridge et al.9 highlight
46
some of the challenges for binary outcomes and provide several definitions (see Table 1 for the
47
form most commonly presented in GRT texts).2,4,5,9 Others compare methods to estimate the ICC
of a binary outcome.12-17 The ICC is not easily defined for rates based on person-time data.2,4
49
Recent publications have defined ICC for time-to-event data.18,19
50
The coefficient of variation (CV) is a measure of clustering that is defined for general clustered
51
data when the distributional parameter of interest is a mean, proportion, or rate.3,17 The CV and
52
ICC for continuous and binary outcomes are related by a mathematical relationship as a function
53
of the distributional parameter of interest (i.e. mean or proportion) and, for continuous outcomes,
54
of the within-group variance, 𝜎𝑤2 (Table 1).2,4 Hayes and Moulton2 advocate for the CV generally
55
in power calculations; Donner and Klar agree for event data analyzed as rates.3
56
[TABLE 1 ABOUT HERE]
57
Given the central role of clustering in planning GRTs, imprecision in the estimated level of
58
clustering can lead to an under-powered trial. Multiple authors address imprecision, and all focus
59
on the ICC.20-26 Simultaneously, there has been an increasing number of publications that report
60
ICCs (for example, Moerbeek and Teerenstra27 provide a comprehensive list of such papers) to
61
aid the planning of future studies, consistent with the CONSORT statement on GRTs.28
62
Cohort vs. Cross-Sectional GRT Designs 63
The choice between a cohort and cross-sectional GRT design (or a combination) is driven by the
64
nature of the research question.1 The cross-sectional design is preferred when the question is
65
about change in a population1 or when the time to the outcome is so short as to make a cohort
66
study impractical (e.g., studies involving acute conditions).2 For example, in order to observe
67
enough participants with malaria at 6-monthly follow-up time points and to be able to draw
68
conclusions about population-level behavior related to malaria treatment choices, Laktabai et
follow-up time point. In contrast, when interested in change in specific individuals, or in
71
mediation, the most natural choice is the cohort design in which a cohort of individuals is
72
enrolled and followed up over time.1 For example, Turner et al.30 chose such a design to study
73
child outcomes in mothers with prenatal depression. Similarly, the cohort design is usually
74
required to generate event data in individuals.2 A combination design could be used whereby the
75
cross-sectional design is augmented by subsampling a cohort of individuals who are followed
76
over time, such as in the COMMIT study.31 A recent review32 indicated that the cohort design is
77
the most common GRT design (67% of 75 GRTs).
78
DEVELOPMENTS IN THE DESIGN OF PARALLEL-ARM
GROUP-79RANDOMIZED TRIALS
80Baseline Imbalance of Group Sample Size 81
Imbalance of group sample size means that group sizes are different across the groups
82
randomized in the study, with implications for statistical efficiency. Donner discussed variation
83
in group size for GRTs for a design stratified by group size.33 Guittet et al.34 and Carter35 studied
84
the impact on power using simulations, which showed the greatest reduction in power with few
85
groups and/or high ICC. Several authors have offered adjustments to the standard sample size
86
formula for a GRT to correct for variability in group size based on the mean and variance of the
87
group size, or the actual size of each group.36-39 Others have offered adjustments based on
88
relative efficiency.40-43 Candel et al.40,41 reported that relative efficiency ranged from 1.0-0.8
89
across a variety of distributions for group size with lower values for higher ICCs and greater
90
variability in group size; the minimum relative efficiency was usually no worse than 0.9 for
91
continuous outcomes. They recommended dividing the result from standard formulae for
balanced designs by the relative efficiency for the expected group-size distribution, which was a
93
function of the ICC and the mean and variance of the group size.40 For binary outcomes, they
94
suggested an additional correction factor based on the estimation method planned for the
95
analysis.41 You et al.42 defined relative efficiency in terms of non-centrality parameters; their
96
measure of relative efficiency was a function of the ICC, the mean and variance of the group
97
size, and the number of groups per study arm. Candel and Van Breukelen43 considered variability
98
not only in group size but also between arms in error variance and the number of groups per arm.
99
They recommended increasing the number of groups in each arm by the inverse of the relative
100
efficiency minus one. Their estimate of the relative efficiency was a function of the number of
101
groups per study arm, the ICC in each study arm, the ratio of the variances in the two study arms,
102
and the mean and variance of the group size.
103
Consistent across these papers was the recommendation that expectations for variation in group
104
sample size be considered during both the planning stages and the analysis stage. Failure in
105
planning can result in an underpowered study40-43 while failure in analysis can result in type I
106
error rate inflation.44
107
Baseline Imbalance of Covariates 108
Imbalance of covariates at baseline threatens the internal validity of the trial. Yet GRTs often
109
randomize a limited number of groups that are heterogeneous in baseline covariates and in
110
baseline outcome measurements. As a result, there is a good chance of baseline covariate
111
imbalance.6,45 Restricted randomization strategies such as stratification, matching or constrained
112
randomization can be implemented in the design phase to address this issue. However,
113
stratification may have limited use in GRTs if there are more than a handful of covariates to
balance, due to the small number of groups in most trials.46 Pair-matching also comes with
115
several disadvantages46 as it affects the proper calculation of ICC47 and complicates the
116
significance testing of individual-level risk factors.48 More recently, Imai et al. presented a
117
design-based estimator,49 which led them to advocate for the use of pair-matching based on the
118
unbiasedness and efficiency of their estimator. Several others highlighted features of this work,
50-119
52 including the authors’ power calculation that does not depend on the ICC, thus avoiding the
120
known ICC problem.53 Despite efficiency gains of pair-matching over stratification, a simulation
121
study conducted by Imbens led him to conclude that stratified randomization would generally be
122
preferred to pair-matching.54 We note that strata of size four provide virtually all the advantages
123
of pair-matching while avoiding the disadvantages, and may be preferred over pair-matching for
124
that reason.
125
To overcome challenges when trying to balance on multiple, possibly continuous, covariates,
126
Raab and Butcher55 proposed constrained randomization. It is based on a balancing criterion
127
calculated by a weighted sum of squared differences between the study arm means on any
group-128
level or individual-level covariate and seeks to offer better internal validity than both
pair-129
matching and stratification. The approach randomly selects one allocation scheme from a subset
130
of schemes that achieve acceptable balance, identified based on having the smallest values of the
131
balancing criterion. Carter and Hood56 extended this work to randomize multiple blocks of
132
groups and provided an efficient computer program for public use. The “best balance” score was
133
proposed to measure imbalance of group-level factors under constrained randomization.57 In
134
simulations with 4 to 20 groups, constrained randomization with the “best balance” score was
135
shown to optimally reduce quadratic imbalances compared with simple randomization, matching
136
and minimization.
Li et al.58 systematically studied the design parameters of constrained randomization for
138
continuous outcomes, including choice of balancing criterion, candidate set size, and number of
139
covariates to balance. With extensive simulations, they demonstrated that constrained
140
randomization with a balanced candidate subset could improve study power while maintaining
141
the nominal type I error rate, both for a model-based analysis and for a permutation test, as long
142
as the analysis adjusted for potential confounding. Moulton59 proposed to check for overly
143
constrained designs by counting the number of times each pair of groups received the same study
144
arm allocation. He revealed the risk of inflated type I error in overly constrained designs using a
145
simulation example with 10 groups per study arm. Li et al. further noticed the limitation of
146
overly constrained designs in that they may fail to support a permutation test with a fixed size.58
147
In practice, if covariate imbalance is present even after using one of the design strategies
148
described, such imbalance can be accounted for using adjusted analysis that is either pre-planned
149
in the protocol or through post-hoc sensitivity analysis.7 In summary, constrained randomization
150
seeks to provide both internal validity and efficiency.
151
Methods and Software for Power and Sample Size 152
If the ICC is positive, not accounting for it in the analysis will inflate the type I error rate, and the
153
power of the trial will be unknown. If the ICC is estimated as negative, as it can be when the
154
true value is close to zero and sampling error leads to a negative estimate or when there is
155
competition within groups,1-4,9,60 not accounting for it will reduce the type I error rate so that the
156
test is more conservative, and the power of the trial will be lower than planned.61 Thus, a good
157
estimate of the ICC is essential for sample size calculation for all GRTs.
One of the simplest power analysis methods often offered for a standard parallel-arm GRT with a
159
single follow-up measurement is to compute the power for an individually randomized trial using
160
the standard formula, and to then inflate this by the design effect,62 given by 1 + (𝑚 − 1)𝜌. In
161
this formula, 𝑚 is the number of subjects per group and ρ is the ICC. Unfortunately, this
162
approach only addresses the first of the two penalties associated with group-randomization that
163
were identified by Cornfield almost 40 years ago:63 extra variation and limited degrees of
164
freedom for the test of the intervention effect. In order to accurately estimate sample size and
165
power for a GRT, it is necessary to also account for the limited degrees of freedom that can arise
166
due to having few groups to randomize. This can be achieved by using appropriate methods
167
detailed in one the GRT texts rather than using the naïve approach of simply inflating the
168
individually randomized trial sample size by the design effect .1-5,61 In general, appropriate
169
methods calculate sample size using a variance estimate inflated based on the expected ICC and
170
use a t-test rather than a z-test to reflect the desired power and type I error rate, with degrees of
171
freedom based on the number of groups to be randomized.
172
In practice, both cross-sectional and cohort GRTs are commonly powered based on a comparison
173
between study arms at a single point in time. Then, for GRTs with cohort designs, the analysis
174
section of the study protocol may state that power will be gained by accounting for the repeated
175
measures design in the analysis. However, methods exist for directly computing power in the
176
case of repeated measures in the context of both cross-sectional and cohort designs.1,27 Authors
177
have noted that regression adjustment for covariates often reduces both the ICC and the residual
178
variance, thereby improving power.1,64 Heo et al.65 and Murray et al.66 provide methods that
179
utilize data from across the entire course of the study, rather than just comparing two means at
180
the end of the study. In practice, the user would require estimates of the variance reduction
expected from repeated measures or from regression adjustment for covariates, which could be
182
obtained from prior studies or pilot data.
183
Methods exist to power GRTs with additional layers of clustering, whether from additional
184
structural hierarchies1,67-69 or from the repeated measures in the cohort design.1,27,64,66,70-73
185
Konstantopoulos describes how to incorporate cost into the power calculation for three-level
186
GRTs.74 Hemming et al. discuss approaches to take when the number of groups is fixed ahead of
187
time.75 Two recent papers focus specifically on binary outcome variables.13,76 Candel et al.
188
examine the effects of varying group sizes in the context of a two-arm GRT.77 Durán Pacheco et
189
al. focus on power methods for overdispersed counts.78
190
Rutterford et al. and Gao et al. summarize a wide array of methods for sample size calculations
191
in GRTs,79,80 including for GRT designs involving 1-2 measurements per member or per group
192
and for designs involving 3 or more measurements per member or per group. A new textbook on
193
power analysis for studies with multilevel data also provides a thorough treatment.27 Previous
194
textbooks on the design and analysis of GRTs devoted at least a chapter to methods for power
195
and sample size.1-5
196
[TABLE 2 ABOUT HERE] 197
DEVELOPMENTS IN THE DESIGN OF ALTERNATIVES TO THE
198PARALLEL-ARM GRT
199We discuss four alternatives that can be used in place of a traditional parallel-arm GRT (Figure
200
1A, Table 3). All of these four designs involve randomization and some form of clustering that 201
must be appropriately accounted for in both the design and analysis. As such, they share key
features of the standard parallel-arm GRT yet all have distinct and different features that are
203
important to understand. In practice, some of these designs are still poorly understood.
204
[TABLE 3 ABOUT HERE] 205
[FIGURE 1 ABOUT HERE] 206
Stepped Wedge GRT 207
The stepped wedge GRT (SW-GRT) is a one-directional crossover GRT in which time is divided
208
into intervals and in which all groups eventually receive the intervention (Figure 1B).81
209
Systematic reviews indicate increasing popularity.82-84 Both Trials (2015) and the Journal of
210
Clinical Epidemiology (2013) recently published special issues focused on the design and
211
analysis of SW-GRTs.
212
The rationale for this alternative is primarily logistical, i.e., it may not be possible to roll out the
213
intervention in all groups simultaneously,85-88 although a staggered parallel-arm GRT design
214
could alternatively be used in which blocks of groups were randomized to intervention or control
215
instead of all groups eventually receiving the intervention as in the SW-GRT.89-91 Others propose
216
a SW-GRT for ethical and acceptability reasons because all groups eventually receive the
217
intervention.82 This second argument has been discounted as the intervention could be delivered
218
to all control groups at the end of a parallel-arm GRT design,88,92 often earlier than would be the
219
case in a SW-GRT.93 When SW-GRTs are conducted in low incidence settings, Hayes et al.
220
emphasized that the order and period of intervention allocation is crucial.94
221
As for the parallel-arm GRT, design choices include cross-sectional82 vs. cohort95 with most
SW-222
GRT methodological literature focused on cross-sectional designs whereas most published
GRTs are cohort designs.96 An additional variation is that of complete vs. incomplete SW-GRTs
224
defined according to whether each group is measured at every time point.90 Regardless of the
225
specifics of the SW-GRT design, it is important to consider the possible confounding and
226
moderating effects of time in the analysis.85,90,97-99 Failure to account for both, if they exist, will
227
threaten the internal validity of the study.
228
Cross-sectional SW-GRT sample size formulae are available for complete and incomplete
229
designs.90,100-103 Hemming et al. provide a unified approach for the design of both parallel-arm
230
and SW-GRTs and allow for multiple layers of clustering.90 Cohort SW-GRT sample size
231
calculation relies on simulation.97,104 Recent work on optimal designs shows that, for large
232
studies, the optimal design is a mixture of a stepped wedge trial embedded in a parallel-arm
233
trial.105,106 Moerbeek & Teerenstra devote a chapter to sample size methods for SW-GRTs.27
234
Network-Randomized GRT 235
GRTs have historically been used to minimize the contamination between study arms; such
236
contamination is also called interference.107 This contamination may give rise to a network of
237
connections between individuals both within- and between-study arms. The latter is of particular
238
relevance to GRT design because it leads to reduced power, although sample size methods exist
239
to preserve power and efficiency.108
240
The network-randomized GRT is a novel design that uses network information to address the
241
challenge of potential contamination in GRTs of infectious diseases.109-111 In such a design,
242
groups are defined as the network contacts of a disease (index) case and those groups are
243
randomized to study arms. Examples include the snowball trial and the ring trial, each with a
244
distinct way in which the intervention is delivered. In the snowball trial, only the index case
directly receives the intervention, which he is encouraged to share with his contacts (e.g. see
246
Latkin et al.109 for such a trial of HIV prevention in injection drug users). In the ring trial, ‘rings’
247
of contacts of the index case are randomized to receive the intervention (Figure 1C). This design
248
has been used to study foot-and-mouth,112 smallpox,113 and Ebola.114 For the same sample size,
249
ring trials are more powerful than classical GRTs when the incidence of the infection is low.115
250
Pseudo-Cluster Randomized Trial 251
In GRTs where all members of the selected groups are recruited to the study, study participants
252
are expected to be representative of the underlying population and, as a result, selection bias is
253
expected to be minimal. In contrast, GRTs with unblinded recruitment after randomization are at
254
risk of selection bias. For example, consider a GRT used to evaluate the effect of a behavioral
255
intervention delivered by providers in the primary care setting. If a provider is first randomized
256
to study arm and then prospectively recruits participants, he may differentially select participants
257
depending on whether he is randomized to the intervention or control arm.116
258
To reduce the risk of such selection bias, Borm et al. introduced the pseudo-cluster randomized
259
trial (PCRT) to allocate intervention to participants in a two-stage process.117 In the first stage,
260
providers are randomized to a patient allocation-mix (e.g., patients predominantly randomized to
261
intervention vs. patients predominantly randomized to control). In the second stage, patients
262
recruited to the PCRT are individually randomized to intervention or control according to the
263
allocation probability of their provider (e.g., 80% to intervention vs. 20% to intervention)
264
(Figure 1D).
265
An obvious threat to a PCRT design is that the same providers are asked to implement both the
266
intervention and the control arms, depending on which patient they are seeing. Concerns about
contamination are a common reason to randomize providers (i.e. group randomization) so that
268
they deliver either the intervention or the control but not both. The PCRT design would not be
269
appropriate if there are concerns about contamination, and if they exceed concerns about
270
selection bias.
271
In two published cases, providers were blinded to the two-stage form of randomization and
272
instead assumed that patients were individually randomized to the intervention arm with equal
273
probability.118,119 Later publications indicate that the PCRT design did well at balancing
274
contamination and selection bias in both studies.120-122
275
Borm et al. provide sample size calculations for continuous outcomes.117 The clustering by
276
provider (or unit of first stage randomization) must be accounted for in both the design and
277
analysis. No explicit sample size methods are known to be available for non-continuous
278
outcomes. Moerbeek & Teerenstra devote a chapter to sample size methods for PCRTs.27
279
Individually Randomized Group Treatment Trial 280
Pals et al.123 identified studies that randomize individuals to study arms but deliver interventions
281
in small groups or through a common change agent as individually randomized group-treatment
282
(IRGT) trials, also called partially clustered or partially nested designs(Figure 1E).72,124
283
Examples include studies of psychotherapy,125 weight loss,126 reduction in sun exposure,127 and
284
many other outcomes. Clustering associated with these small groups or change agents must be
285
accounted for in the analysis to avoid type I error rate inflation.72,123,124,128,129 Even so, this
286
accounting appears to be rare in practice.123,130-133
287
Recent papers have reported sample size formulae for IRGT trials with clustering in only one
devote a chapter to sample size methods for IRGT trials focused on methods with clustering in
290
either one or both arms.27 Roberts addresses sample size methods for IRGT trials in which
291
members belong to more than one small group at the same time or change small groups over the
292
course of the study.135 Both features have been shown to increase the type I error rate if ignored
293
in the analysis.135,136
294
DISCUSSION
295We have summarized many of the most important advances in the design of GRTs during the 13
296
years since the publication of the earlier review by Murray et al.6 Many of these developments
297
have focused on alternatives to the standard parallel-arm GRT design, as well as those related to
298
the nature of clustering and its features in all of the designs presented. Space limitations have
299
prevented us from including recent developments involving pilot and feasibility GRTs and group
300
designs such as cutoff designs and regression discontinuity applied to groups. Interested readers
301
are directed to the recently launched Pilot and Feasibility Studies peer-reviewed journal and
302
related references 4,137 and to cutoff design references by Pennell et al.138 and by Schochet.139
303
Through this review, we have sought to ensure that the reader is reminded of the value of good
304
design and gains knowledge in the fundamental principles of a range of recent and potentially
305
beneficial design strategies. Pairing this knowledge with our companion review of developments
306
in the analysis of GRTs,7 we hope that our work leads to continued improvements in the design
307
and analysis of GRTs.
308
APPENDIX: GLOSSARY 309
Balanced candidate subset: In constrained randomization, where a subset of randomization 310
schemes is chosen that has “sufficient balance across potentially confounding covariates”
311
according to “some pre-specified balance metric.”58
312
Baseline covariate balance: The group-level and individual-level covariate distributions are 313
similar in all study arms.55
314
Candidate set size: “The number of possible randomization schemes in a specific 315
implementation.”58 “Simple randomization draws from the complete set of candidate schemes,
316
while constrained randomization considers a subset of schemes.”58
317
Choice of balancing criterion: Li et al. describe several balancing criteria to assess how well a 318
GRT is balanced across covariates. These include the “best balance” (BB) metric of de Hoop et
319
al.,57 the balance criterion (B) of Raab and Butcher,55 and the total balance score introduced by
320
Li et al.58
321
Coefficient of variation: A measure of between-group variation, defined in Table 1. 322
Cohort GRT design: A cohort of individuals is enrolled at baseline and those same individuals 323
are followed up over time.
324
Constrained randomization: Refers “to those designs that go beyond the basic design 325
constraints to specify classes of randomization outcomes that satisfy certain balancing criteria,
326
while retaining validity of the design.”59
327
Cross-sectional GRT design: A different set of individuals is obtained at each time point. 328
Designed balance at the group level: When there are equal numbers of groups randomized to 329
Equivalence: Assessing whether the new intervention is equivalent to the comparison 331
intervention.
332
Individually Randomized Group Treatment Trials: Studies that randomize individuals to 333
study arms but deliver treatments in small groups or through a common change agent.123
334
Intraclass correlation: A measure of between-group variation, defined in Table 1. 335
Minimization in GRTs: When the researchers allocate groups to intervention arms based on 336
groups-specific characteristics in order to achieve a high degree of balance by minimizing the
337
differences between intervention arms.57 May be performed sequentially or all at once when
338
group characteristics are known at the beginning of the study.
339
Network-Randomized GRT: The network-randomized GRT is a novel design that uses 340
network information to address the challenge of potential contamination in GRTs of infectious
341
diseases.109-111
342
Non-inferiority: When a trial is designed to show that the new intervention is not worse than 343
the comparison intervention.
344
Pair-matching: At randomization, when groups are matched based on factors thought to be 345
related to the outcome. Then within each pair of groups, one is allocated at random to one study
346
arm and the other to the comparison study arm.140
347
Pseudo-cluster randomized trial: Intervention is allocated to individuals in a two-stage 348
process. In the first stage, providers are randomized to a patient allocation-mix. In the second
349
stage, patients recruited to the PCRT are individually randomized to intervention or control
350
according to the allocation probability of their provider.
Selection bias: In some GRTs, groups are randomized before participant recruitment. This can 352
lead to selection bias if researchers (either consciously or unconsciously) recruit specific
353
participants for inclusion in treatment and exclude others based on certain participant
354
characteristics, even when the aforementioned participants are all eligible for participation in the
355
trial (see Farrin et al.116).
356
Stepped Wedge GRT: A one-directional crossover GRT in which time is divided into intervals 357
and in which all groups eventually receive the intervention (Figure 1B).81
358
Stratification: At randomization, when groups are placed into strata based on factors thought to 359
be related to the outcome.141 Then groups are separately randomized within each strata.
360
Superiority: When a trial is designed to establish whether a new intervention is superior to the 361
comparison intervention (e.g., another drug, a placebo, enhanced usual care). However, the
362
statistical test is still two-sided, allowing for the possibility that the new intervention is actually
363
worse than the comparison.
364
ACKNOWLEDGEMENTS
365To be added later to avoid unblinding during the review process.
366
CONTRIBUTORS
367To be added later to avoid unblinding during the review process.
368
HUMAN PARTICIPANT PROTECTION
369No human subjects participated in this research therefore no IRB approval was sought.
Figure 1 The Parallel-Arm GRT and Alternative Group Designs 371
Abbreviation: GRT – Group-randomized trial.
372
Each pictorial representation is an example of the specific design in which baseline
373
measurements are taken. Other versions of each design exist. All examples show 5 individuals
374
per group.
375
*The stepped wedge group-randomized trial is a one-directional crossover GRT in which time is
376
divided into intervals and in which all groups eventually receive the intervention, indicated by
377
the shading of the boxes in the figure. The design shown in this figure is known as a “complete
378
design”—that is, every group is measured at every time point. Like parallel-arm GRTs,
SW-379
GRTs can either be cross-sectional or cohort.
380
†In the PCRT, a group randomized to “intervention” contains a larger proportion of group
381
members receiving the intervention than a group randomized to control.
382
383 384
REFERENCES
3851. Murray DM. Design and Analysis of Group-Randomized Trials. New York, NY: Oxford University 386
Press; 1998. 387
2. Hayes RJ, Moulton LH. Cluster Randomised Trials. Boca Raton: CRC Press; 2009. 388
3. Donner A, Klar N. Design and Analysis of Cluster Randomization Trials in Health Research. 389
London: Arnold; 2000. 390
4. Eldridge S, Kerry S. A Practical Guide to Cluster Randomised Trials in Health Services Research. 391
Vol 120: John Wiley & Sons; 2012. 392
5. Campbell MJ, Walters SJ. How to Design, Analyse and Report Cluster Randomised Trials in 393
Medicine and Health Related Research. Chichester, West Sussex: John Wiley & Sons; 2014.
394
6. Murray DM, Varnell SP, Blitstein JL. Design and analysis of group-randomized trials: a review of 395
recent methodological developments. Am J Public Health. 2004;94(3):423-432. 396
7. Turner EL, Prague M, Gallis JA, Li F, Murray DM. Review of Recent Methodological 397
Developments in Group-Randomized Trials: Part 2 - Analysis. Am J Public Health. Submitted. 398
8. Campbell MK, Fayers PM, Grimshaw JM. Determinants of the intracluster correlation coefficient 399
in cluster randomized trials: the case of implementation research. Clin Trials. 2005;2(2):99-107. 400
9. Eldridge SM, Ukoumunne OC, Carlin JB. The intra-cluster correlation coefficient in cluster 401
randomized trials: a review of definitions. Int Stat Rev. 2009;77(3):378-394. 402
10. Fiero MH, Huang S, Oren E, Bell ML. Statistical analysis and handling of missing data in cluster 403
randomized trials: a systematic review. Trials. 2016;17(1):72. 404
11. Rutterford C, Taljaard M, Dixon S, Copas A, Eldridge S. Reporting and methodological quality of 405
sample size calculations in cluster randomized trials could be improved: a review. J Clin 406
Epidemiol. 2015;68(6):716-723.
407
12. Ridout MS, Demetrio CG, Firth D. Estimating intraclass correlation for binary data. Biometrics. 408
1999;55(1):137-148. 409
13. Chakraborty H, Moore J, Hartwell TD. Intracluster correlation adjustments to maintain power in 410
cluster trials for binary outcomes. Contemp Clin Trials. 2009;30(5):473-480. 411
14. Thomson A, Hayes R, Cousens S. Measures of between‐cluster variability in cluster randomized 412
trials with binary outcomes. Stat Med. 2009;28(12):1739-1751. 413
15. Yelland LN, Salter AB, Ryan P. Performance of the modified Poisson regression approach for 414
estimating relative risks from clustered prospective data. Am J Epidemiol. 2011;174(8):984-992. 415
16. Crespi CM, Wong WK, Wu S. A new dependence parameter approach to improve the design of 416
cluster randomized trials with binary outcomes. Clin Trials. 2011;8(6):687-698. 417
17. Wu S, Crespi CM, Wong WK. Comparison of methods for estimating the intraclass correlation 418
coefficient for binary responses in cancer prevention cluster randomized trials. Contemp Clin 419
Trials. 2012;33(5):869-880.
420
18. Jahn‐Eimermacher A, Ingel K, Schneider A. Sample size in cluster‐randomized trials with time to 421
event as the primary endpoint. Stat Med. 2013;32(5):739-751. 422
19. Oliveira IR, Molenberghs G, Demétrio CG, Dias CT, Giolo SR, Andrade MC. Quantifying intraclass 423
correlations for count and time‐to‐event data. Biom J. 2016;58(4):852-867. 424
20. Ukoumunne OC, Davison AC, Gulliford MC, Chinn S. Non-parametric bootstrap confidence 425
intervals for the intraclass correlation coefficient. Stat Med. 2003;22(24):3805-3821. 426
21. Zou G, Donner A. Confidence interval estimation of the intraclass correlation coefficient for 427
binary outcome data. Biometrics. 2004;60(3):807-811. 428
22. Turner RM, Toby Prevost A, Thompson SG. Allowing for imprecision of the intracluster 429
correlation coefficient in the design of cluster randomized trials. Stat Med. 2004;23(8):1195-430
23. Turner RM, Thompson SG, Spiegelhalter DJ. Prior distributions for the intracluster correlation 432
coefficient, based on multiple previous estimates, and their application in cluster randomized 433
trials. Clin Trials. 2005;2(2):108-118. 434
24. Turner RM, Omar RZ, Thompson SG. Constructing intervals for the intracluster correlation 435
coefficient using Bayesian modelling, and application in cluster randomized trials. Stat Med. 436
2006;25(9):1443-1456. 437
25. Braschel MC, Svec I, Darlington GA, Donner A. A comparison of confidence interval methods for 438
the intraclass correlation coefficient in community-based cluster randomization trials with a 439
binary outcome. Clin Trials. 2016;13(2):180-187. 440
26. Shoukri MM, Donner A, El-Dali A. Covariate-adjusted confidence interval for the intraclass 441
correlation coefficient. Contemp Clin Trials. 2013;36(1):244-253. 442
27. Moerbeek M, Teerenstra S. Power Analysis of Trials with Multilevel Data. Boca Raton: CRC Press; 443
2016. 444
28. Campbell MK, Elbourne DR, Altman DG. CONSORT statement: extension to cluster randomised 445
trials. Br Med J. 2004;328(7441):702-708. 446
29. Laktabai J, Lesser A, Platt A, et al. An innovative public-private partnership to target subsidized 447
antimalarials: a study protocol for a cluster randomized controlled trial to evaluate a community 448
intervention in Western Kenya. In press at BMJ Open. 449
30. Turner EL, Sikander S, Bangash O, et al. The effectiveness of the peer delivered Thinking Healthy 450
Plus (THPP+) Programme for maternal depression and child socio-emotional development in 451
Pakistan: study protocol for a three-year cluster randomized controlled trial. Trials. 452
2016;17(1):442. 453
31. Community Intervention Trial for Smoking Cessation (COMMIT): summary of design and 454
intervention. J Natl Cancer Inst. 1991;83(22):1620-1628. 455
32. Murray DM, Pals SP, Blitstein JL, Alfano CM, Lehman J. Design and analysis of group-randomized 456
trials in cancer: a review of current practices. J Natl Cancer Inst. 2008;100(7):483-491. 457
33. Donner A. Sample size requirements for stratified cluster randomization designs. Stat Med. 458
1992;11(6):743-750. 459
34. Guittet L, Ravaud P, Giraudeau B. Planning a cluster randomized trial with unequal cluster sizes: 460
practical issues involving continuous outcomes. BMC Med Res Methodol. 2006;6:17. 461
35. Carter B. Cluster size variability and imbalance in cluster randomized controlled trials. Stat Med. 462
2010;29(29):2984-2993. 463
36. Lake S, Kaumann E, Klar N, Betensky R. Sample size re-estimation in cluster randomization trials. 464
Stat Med. 2002;21(10):1337-1350.
465
37. Manatunga AK, Hudgens MG, Chen SD. Sample size estimation in cluster randomized studies 466
with varying cluster size. Biom J. 2001;43(1):75-86. 467
38. Kerry SM, Bland JM. Unequal cluster sizes for trials in English and Welsh general practice: 468
implications for sample size calculations. Stat Med. 2001;20(3):377-390. 469
39. Eldridge SM, Ashby D, Kerry S. Sample size for cluster randomized trials: effect of coefficient of 470
variation of cluster size and analysis method. Int J Epidemiol. 2006;35(5):1292-1300. 471
40. van Breukelen G, Candel M, Berger M. Relative efficiency of unequal versus equal cluster sizes in 472
cluster randomized and multicentre trials. Stat Med. 2007;26(13):2589-2603. 473
41. Candel MJ, Van Breukelen GJ. Sample size adjustments for varying cluster sizes in cluster 474
randomized trials with binary outcomes analyzed with second‐order PQL mixed logistic 475
regression. Stat Med. 2010;29(14):1488-1501. 476
42. You Z, Williams OD, Aban I, Kabagambe EK, Tiwari HK, Cutter G. Relative efficiency and sample 477
size for cluster randomized trials with variable cluster sizes. Clin Trials. 2011;8(1):27-36. 478
43. Candel MJ, Van Breukelen GJ. Repairing the efficiency loss due to varying cluster sizes in two‐ 479
level two‐armed randomized trials with heterogeneous clustering. Stat Med. 2016;35(12):2000-480
2015. 481
44. Johnson JL, Kreidler SM, Catellier DJ, Murray DM, Muller KE, Glueck DH. Recommendations for 482
choosing an analysis method that controls Type I error for unbalanced cluster sample designs 483
with Gaussian outcomes. Stat Med. 2015;34(27):3531-3545. 484
45. Wright N, Ivers N, Eldridge S, Taljaard M, Bremner S. A review of the use of covariates in cluster 485
randomized trials uncovers marked discrepancies between guidance and practice. J Clin 486
Epidemiol. 2015;68(6):603-609.
487
46. Ivers NM, Halperin IJ, Barnsley J, et al. Allocation techniques for balance at baseline in cluster 488
randomized trials: a methodological review. Trials. 2012;13:120. 489
47. Donner A, Klar N. Pitfalls of and controversies in cluster randomized trials. Am J Public Health. 490
2004;26(1):2-19. 491
48. Donner A, Taljaard M, Klar N. The merits of breaking the matches: a cautionary tale. Stat Med. 492
2007;26(9):2036-2051. 493
49. Imai K, King G, Nall C. The essential role of pair matching in cluster-randomized experiments, 494
with application to the Mexican universal health insurance evaluation. Stat Sci. 2009;24(1):29-495
53. 496
50. Hill J, Scott M. Comment: The Essential Role of Pair Matching. Stat Sci. 2009;24(1):54-58. 497
51. Zhang K, Small DS. Comment: The Essential Role of Pair Matching in Cluster-Randomized 498
Experiments, with Application to the Mexican Universal Health Insurance Evaluation. Stat Sci. 499
2009;24(1):59-64. 500
52. Imai K, King G, Nall C. Rejoinder: Matched Pairs and the Future of Cluster-Randomized 501
Experiments. Stat Sci. 2009;24(1):65-72. 502
53. Klar N, Donner A. The merits of matching in community intervention trials: a cautionary tale. 503
Stat Med. 1997;16(15):1753-1764.
504
54. Imbens GW. Experimental design for unit and cluster randomized trials. Paper presented at: 505
Initiative for Impact Evaluation 2011; Cuernavaca, Mexico. 506
55. Raab GM, Butcher I. Balance in cluster randomized trials. Stat Med. 2001;20(3):351-365. 507
56. Carter BR, Hood K. Balance algorithm for cluster randomized trials. BMC Med Res Methodol. 508
2008;8:65. 509
57. de Hoop E, Teerenstra S, van Gaal BG, Moerbeek M, Borm GF. The "best balance" allocation led 510
to optimal balance in cluster-controlled trials. J Clin Epidemiol. 2012;65(2):132-137. 511
58. Li F, Lokhnygina Y, Murray DM, Heagerty PJ, DeLong ER. An evaluation of constrained 512
randomization for the design and analysis of group-randomized trials. Stat Med. 513
2015;35(10):1565-1579. 514
59. Moulton LH. Covariate-based constrained randomization of group-randomized trials. Clin Trials. 515
2004;1(3):297-305. 516
60. Snedecor GW, Cochran WG. Statistical methods. 8th ed. Ames: Iowa State University Press; 517
1989. 518
61. Murray DM, Hannan PJ, Baker WL. A Monte Carlo Study of Alternative Responses To Intraclass 519
Correlation in Community Trials Is It Ever Possible to Avoid Cornfield's Penalties? Eval Rev. 520
1996;20(3):313-337. 521
62. Donner A, Birkett N, Buck C. Randomization by cluster sample size requirements and analysis. 522
Am J Epidemiol. 1981;114(6):906-914.
523
63. Cornfield J. Randomization by group: a formal analysis. Am J Epidemiol. 1978;108(2):100-102. 524
64. Teerenstra S, Eldridge S, Graff M, Hoop E, Borm GF. A simple sample size formula for analysis of 525
65. Heo M, Kim Y, Xue X, Kim MY. Sample size requirement to detect an intervention effect at the 527
end of follow-up in a longitudinal cluster randomized trial. Stat Med. 2010;29(3):382-390. 528
66. Murray DM, Blitstein JL, Hannan PJ, Baker WL, Lytle LA. Sizing a trial to alter the trajectory of 529
health behaviours: methods, parameter estimates, and their application. Stat Med. 530
2007;26(11):2297-2316. 531
67. Teerenstra S, Lu B, Preisser JS, van Achterberg T, Borm GF. Sample size considerations for GEE 532
analyses of three-level cluster randomized trials. Biometrics. 2010;66(4):1230-1237. 533
68. Heo M, Leon AC. Statistical power and sample size requirements for three level hierarchical 534
cluster randomized trials. Biometrics. 2008;64(4):1256-1262. 535
69. Teerenstra S, Moerbeek M, van Achterberg T, Pelzer BJ, Borm GF. Sample size calculations for 3-536
level cluster randomized trials. Clin Trials. 2008;5(5):486-495. 537
70. Heo M. Impact of subject attrition on sample size determinations for longitudinal cluster 538
randomized clinical trials. J Biopharm Stat. 2014;24(3):507-522. 539
71. Heo M, Leon AC. Sample size requirements to detect an intervention by time interaction in 540
longitudinal cluster randomized clinical trials. Stat Med. 2009;28(6):1017-1027. 541
72. Heo M, Litwin AH, Blackstock O, Kim N, Arnsten JH. Sample size determinations for group-based 542
randomized clinical trials with different levels of data hierarchy between experimental and 543
control arms. Stat Methods Med Res. 2014;26(1):399-413. 544
73. Heo M, Xue X, Kim MY. Sample size requirements to detect an intervention by time interaction 545
in longitudinal cluster randomized clinical trials with random slopes. Comput Stat Data Anal. 546
2013;60:169-178. 547
74. Konstantopoulos S. Incorporating cost in power analysis for three-level cluster-randomized 548
designs. Eval Rev. 2009;33(4):335-357. 549
75. Hemming K, Girling AJ, Sitch AJ, Marsh J, Lilford RJ. Sample size calculations for cluster 550
randomised controlled trials with a fixed number of clusters. BMC Med Res Methodol. 551
2011;11:102. 552
76. Ahn C, Hu F, Skinner CS, Ahn D. Effect of imbalance and intracluster correlation coefficient in 553
cluster randomization trials with binary outcomes when the available number of clusters is fixed 554
in advance. Contemp Clin Trials. 2009;30(4):317-320. 555
77. Candel MJ, Van Breukelen GJ. Varying cluster sizes in trials with clusters in one treatment arm: 556
Sample size adjustments when testing treatment effects with linear mixed models. Stat Med. 557
2009;28(18):2307-2324. 558
78. Durán Pacheco G, Hattendorf J, Colford JM, Mäusezahl D, Smith T. Performance of analytical 559
methods for overdispersed counts in cluster randomized trials: Sample size, degree of clustering 560
and imbalance. Stat Med. 2009;28(24):2989-3011. 561
79. Rutterford C, Copas A, Eldridge S. Methods for sample size determination in cluster randomized 562
trials. Int J Epidemiol. 2015;44(3):1051-1067. 563
80. Gao F, Earnest A, Matchar DB, Campbell MJ, Machin D. Sample size calculations for the design of 564
cluster randomized trials: A summary of methodology. Contemp Clin Trials. 2015;42:41-50. 565
81. Spiegelman D. Evaluating public health interventions: 2. Stepping up to routine public health 566
evaluation with the stepped wedge design. Am J Public Health. 2016;106(3):453-457. 567
82. Brown CA, Lilford RJ. The stepped wedge trial design: a systematic review. BMC Med Res 568
Methodol. 2006;6(1):1.
569
83. Mdege ND, Man M-S, Taylor CA, Torgerson DJ. Systematic review of stepped wedge cluster 570
randomized trials shows that design is particularly used to evaluate interventions during routine 571
implementation. J Clin Epidemiol. 2011;64(9):936-948. 572
84. Beard E, Lewis JJ, Copas A, et al. Stepped wedge randomised controlled trials: systematic review 573
of studies published between 2010 and 2014. Trials. 2015;16(1):1-14. 574
85. Hussey MA, Hughes JP. Design and analysis of stepped wedge cluster randomized trials. 575
Contemp Clin Trials. 2007;28(2):182-191.
576
86. Hargreaves JR, Copas AJ, Beard E, et al. Five questions to consider before conducting a stepped 577
wedge trial. Trials. 2015;16(1):350. 578
87. Moulton LH, Golub JE, Durovni B, et al. Statistical design of THRio: a phased implementation 579
clinic-randomized study of a tuberculosis preventive therapy intervention. Clin Trials. 580
2007;4(2):190-199. 581
88. Prost A, Binik A, Abubakar I, et al. Logistic, ethical, and political dimensions of stepped wedge 582
trials: critical review and case studies. Trials. 2015;16(1):351. 583
89. Shah More N, Das S, Bapat U, et al. Community resource centres to improve the health of 584
women and children in Mumbai slums: study protocol for a cluster randomized controlled trial. 585
Trials. 2013;14:132.
586
90. Hemming K, Lilford R, Girling AJ. Stepped‐wedge cluster randomised controlled trials: a generic 587
framework including parallel and multiple‐level designs. Stat Med. 2015;34(2):181-196. 588
91. Kotz D, Spigt M, Arts ICW, Crutzen R, Viechtbauer W. Use of the stepped wedge design cannot 589
be recommended: A critical appraisal and comparison with the classic cluster randomized 590
controlled trial design. J Clin Epidemiol. 2012;65(12):1249-1252. 591
92. Kotz D, Spigt M, Arts IC, Crutzen R, Viechtbauer W. Researchers should convince policy makers 592
to perform a classic cluster randomized controlled trial instead of a stepped wedge design when 593
an intervention is rolled out. J Clin Epidemiol. 2012;65(12):1255. 594
93. Murray DM, Pennell M, Rhoda D, Hade EM, Paskett ED. Designing studies that would address 595
the multilayered nature of health care. J Natl Cancer Inst Monogr. 2010(40):90-96. 596
94. Hayes RJ, Alexander ND, Bennett S, Cousens SN. Design and analysis issues in cluster-597
randomized trials of interventions against infectious diseases. Stat Methods Med Res. 598
2000;9(2):95-116. 599
95. Copas AJ, Lewis JJ, Thompson JA, Davey C, Baio G, Hargreaves JR. Designing a stepped wedge 600
trial: three main designs, carry-over effects and randomisation approaches. Trials. 601
2015;16(1):352. 602
96. Hemming K, Haines TP, Chilton PJ, Girling AJ, Lilford RJ. The stepped wedge cluster randomised 603
trial: rationale, design, analysis, and reporting. BMJ. 2015;350:h391. 604
97. Baio G, Copas A, Ambler G, Hargreaves J, Beard E, Omar RZ. Sample size calculation for a 605
stepped wedge trial. Trials. 2015;16(1):354. 606
98. Handley MA, Schillinger D, Shiboski S. Quasi-experimental designs in practice-based research 607
settings: design and implementation considerations. The Journal of the American Board of 608
Family Medicine. 2011;24(5):589-596.
609
99. Liao X, Zhou X, Spiegelman D. A note on “Design and analysis of stepped wedge cluster 610
randomized trials”. Contemp Clin Trials. 2015;45(Pt B):338-339. 611
100. Hemming K, Taljaard M. Sample size calculations for stepped wedge and cluster randomised 612
trials: a unified approach. J Clin Epidemiol. 2016;69:137-146. 613
101. Hemming K, Girling A. A menu-driven facility for power and detectable-difference calculations in 614
stepped-wedge cluster-randomized trials. Stata J. 2014;14(2):363-380. 615
102. Hughes J. Calculation of power for stepped wedge design. http://tinyurl.com/hwp5dgr. 616
Accessed January 12, 2017. 617
103. Hughes J. Calculation of power for stepped wedge design (means). http://tinyurl.com/jvcr5bu. 618
Accessed January 12, 2017. 619
104. Baio G. SWSamp: Simulation-based sample size calculations for a Stepped Wedge Trial (and 620
more). 2016; https://sites.google.com/a/statistica.it/gianluca/swsamp. 621
105. Lawrie J, Carlin JB, Forbes AB. Optimal stepped wedge designs. Stat Probab Lett. 2015;99:210-622
214. 623
106. Girling AJ, Hemming K. Statistical efficiency and optimal design for stepped cluster studies under 624
linear mixed effects models. Stat Med. 2016;35(13):2149-2166. 625
107. Hudgens MG, Halloran ME. Toward causal inference with interference. J Am Stat Assoc. 626
2008;103(482):832-842. 627
108. Wang R, Goyal R, Lei Q, Essex M, De Gruttola V. Sample size considerations in the design of 628
cluster randomized trials of combination HIV prevention. Clin Trials. 2014;11(3):309-318. 629
109. Latkin C, Donnell D, Liu TY, Davey‐Rothwell M, Celentano D, Metzger D. The dynamic 630
relationship between social norms and behaviors: the results of an HIV prevention network 631
intervention for injection drug users. Addiction. 2013;108(5):934-943. 632
110. Staples PC, Ogburn EL, Onnela J-P. Incorporating Contact Network Structure in Cluster 633
Randomized Trials. Sci Rep. 2015;5:17581. 634
111. Harling G, Wang R, Onnela J, De Gruttola V. Leveraging contact network structure in the design 635
of cluster randomized trials. Clin Trials. 2016 [Epub ahead of print]. 636
112. Keeling M, Woolhouse M, May R, Davies G, Grenfell B. Modelling vaccination strategies against 637
foot-and-mouth disease. Nature. 2003;421(6919):136-142. 638
113. Kretzschmar M, Van den Hof S, Wallinga J, Van Wijngaarden J. Ring vaccination and smallpox 639
control. Emerg Infect Dis. 2004;10(5):832-841. 640
114. Enserink M. High hopes for Guinean vaccine trial. Science. 2015;347(6219):219-220. 641
115. Henao-Restrepo AM. The ring vaccination trial: a novel cluster randomised controlled trial 642
design to evaluate vaccine efficacy and effectiveness during outbreaks, with special reference to 643
Ebola. BMJ. 2015;351. 644
116. Farrin A, Russell I, Torgerson D, Underwood M. Differential recruitment in a cluster randomized 645
trial in primary care: the experience of the UK back pain, exercise, active management and 646
manipulation (UK BEAM) feasibility study. Clin Trials. 2005;2(2):119-124. 647
117. Borm GF, Melis RJ, Teerenstra S, Peer PG. Pseudo cluster randomization: a treatment allocation 648
method to minimize contamination and selection bias. Stat Med. 2005;24(23):3535-3547. 649
118. Melis RJ, van Eijken MI, Borm GF, et al. The design of the Dutch EASYcare study: a randomised 650
controlled trial on the effectiveness of a problem-based community intervention model for frail 651
elderly people. BMC Health Serv Res. 2005;5:65. 652
119. Pence BW, Gaynes BN, Thielman NM, et al. Balancing contamination and referral bias in a 653
randomized clinical trial: An application of pseudo-cluster randomization. Am J Epidemiol. 654
2015;182(12):1039-1046. 655
120. Melis RJ, Teerenstra S, Rikkert MG, Borm GF. Pseudo cluster randomization performed well 656
when used in practice. J Clin Epidemiol. 2008;61(11):1169-1175. 657
121. Pence BW, Gaynes BN, Adams JL, et al. The effect of antidepressant treatment on HIV and 658
depression outcomes: results from a randomized trial. AIDS. 2015;29(15):1975-1986. 659
122. Teerenstra S, Melis R, Peer P, Borm G. Pseudo cluster randomization dealt with selection bias 660
and contamination in clinical trials. J Clin Epidemiol. 2006;59(4):381-386. 661
123. Pals SP, Murray DM, Alfano CM, Shadish WR, Hannan PJ, Baker WL. Individually randomized 662
group treatment trials: a critical appraisal of frequently used design and analytic approaches. 663
Am J Public Health. 2008;98(8):1418-1424.
664
124. Baldwin SA, Bauer DJ, Stice E, Rohde P. Evaluating models for partially clustered designs. Psychol 665
Methods. 2011;16(2):149-165.
666
125. Carlbring P, Bohman S, Brunt S, et al. Remote treatment of panic disorder: a randomized trial of 667
internet-based cognitive behavior therapy supplemented with telephone calls. Am J Psychiatry. 668
2006;163(12):2119-2125. 669
126. Jeffery RW, Linde JA, Finch EA, Rothman AJ, King CM. A Satisfaction Enhancement Intervention 670
for Long‐Term Weight Loss. Obesity. 2006;14(5):863-869. 671
127. Jackson KM, Aiken LS. Evaluation of a multicomponent appearance-based sun-protective 672
intervention for young women: uncovering the mechanisms of program efficacy. Health Psychol. 673
2006;25(1):34. 674
128. Roberts C, Roberts SA. Design and analysis of clinical trials with clustering effects due to 675
treatment. Clin Trials. 2005;2(2):152-162. 676
129. Kahan BC, Morris TP. Assessing potential sources of clustering in individually randomised trials. 677
BMC Med Res Methodol. 2013;13:58.
678
130. Pals SL, Wiegand RE, Murray DM. Ignoring the group in group-level HIV/AIDS intervention trials: 679
a review of reported design and analytic methods. AIDS. 2011;25(7):989-996. 680
131. Lee KJ, Thompson SG. Clustering by health professional in individually randomised trials. BMJ. 681
2005;330(7483):142-144. 682
132. Biau DJ, Porcher R, Boutron I. The account for provider and center effects in multicenter 683
interventional and surgical randomized controlled trials is in need of improvement: a review. J 684
Clin Epidemiol. 2008;61(5):435-439.
685
133. Oltean H, Gagnier JJ. Use of clustering analysis in randomized controlled trials in orthopaedic 686
surgery. BMC Med Res Methodol. 2015;15:17. 687
134. Moerbeek M, Wong WK. Sample size formulae for trials comparing group and individual 688
treatments in a multilevel model. Stat Med. 2008;27(15):2850-2864. 689
135. Roberts C, Walwyn R. Design and analysis of non-pharmacological treatment trials with multiple 690
therapists per patient. Stat Med. 2013;32(1):81-98. 691
136. Andridge RR, Shoben AB, Muller KE, Murray DM. Analytic methods for individually randomized 692
group treatment trials and group-randomized trials when subjects belong to multiple groups. 693
Stat Med. 2014;33(13):2178-2190.
694
137. Eldridge SM, Costelloe CE, Kahan BC, Lancaster GA, Kerry SM. How big should the pilot study for 695
my cluster randomised trial be? Stat Methods Med Res. 2016;25(3):1039-1056. 696
138. Pennell ML, Hade EM, Murray DM, Rhoda DA. Cutoff designs for community‐based intervention 697
studies. Stat Med. 2011;30(15):1865-1882. 698
139. Schochet PZ. Statistical power for regression discontinuity designs in education evaluations. J 699
Educ Behav Stat. 2009;34(2):238-266.
700
140. Campbell M, Donner A, Klar N. Developments in cluster randomized trials and Statistics in 701
Medicine. Stat Med. 2007;26(1):2-19. 702
141. Kernan WN, Viscoli CM, Makuch RW, Brass LM, Horwitz RI. Stratified randomization for clinical 703
trials. J Clin Epidemiol. 1999;52(1):19-26. 704
Table 1. Two Common Measures of Clustering for General Clustered Data for Two Common Types of Outcome
Outcome measure Intra-cluster correlation coefficient (ICC, ρ)a Coefficient of Variation (CV, k) Relationship of ICC to CVb Continuous 𝜎𝐵2/(𝜎 𝐵2+ 𝜎𝑊2) 𝜎𝐵/𝜇 1/ (1 + 𝜎𝑤2 𝑘2𝜇2) Binary 𝜎𝐵2/𝜋(1 − 𝜋) 𝜎𝐵/𝜋 𝑘2𝜋/(1 − 𝜋)
Note: 𝜇 = overall mean for continuous outcome data; 𝜋 = overall proportion for binary outcome data; 𝜎𝐵2 = between-group variance;
706
𝜎𝑊2 = within-group variance (i.e. residual error variance). As is common practice, the two clustering measures are for general clustered
707
data and do not focus on the GRT design in which the intervention effect is of primary interest (e.g. see Chapter 2 of Hayes and
708
Moulton2 for more details). The intervention parameter of interest in GRT is typically: difference of means for continuous outcomes;
709
difference of proportions, ratio of proportions or odds ratio for binary outcomes; rate difference or rate ratio for event outcomes.
710
a There are multiple definitions of the ICC for binary outcomes (see 12-17). The specific formulation provided here is one of the
711
simplest and most commonly used (see, for example, equation (2.4) of Hayes and Moulton2 and equation (8) of Eldridge et al.9).
712
b Note that, while the relationship for binary outcomes is only a function of k and the distributional parameter of interest (𝜋), the
713
relationship for continuous outcomes is a function of both the distributional parameter of interest (𝜇) and 𝜎𝑊2.
714 715
Table 2. Software for Sample Size Calculations in Parallel-Arm GRTs 716
Software Functionality
PASS Sample size calculations for GRTs comparing two means (non-inferiority, equivalence, or superiority), two proportions (non-inferiority, equivalence, or superiority), two Poisson rates, and for a logrank test. nQuery Comparison of two means, proportions, and rates.
Stata User-provided command clustersampsi. Can compute sample size for continuous, binary, and rate outcomes for two-sided tests in equal-sized arms.
R Package CRTSize for comparing two means or two binary proportions. SAS No built-in functionality at this time.
Calculator For some simple designs, parameter values can be plugged in to formulas provided in textbooks and online.
717 718
Table 3. Characteristics of the Parallel-Arm Group Randomized Trial (GRT) and of Alternative Group Designs 719
720 One-stage randomization Two-stage
randomization
Type of follow-up possible
Design Acronym By Group By Individual Cross-sectional Cohort
Parallel-Arm GRT GRT - - Stepped Wedge GRT SW-GRT - - Network-Randomized GRT NR-GRT - - - 1 Pseudo-Cluster Randomized Trial PCRT - - - 2 Individually Randomized Group Treatment Trial IRGT trial - - - 3
1 In the network-randomized GRT, the index case and its network is usually defined at baseline and therefore the design is expected to use a cohort design and not allow a cross-sectional design
2 In the pseudo-cluster randomized trial, because randomization is undertaken in two stages with individuals randomized to
intervention or control in the second stage, the design requires that a cohort of individuals be enrolled at study baseline in order to be followed over time
3 In the individually randomized group treatment trial, individual randomization is performed and therefore, like the pseudo-cluster randomized trial, a cohort of individuals is enrolled and followed over time.