HAL Id: hal-00300858
https://hal.archives-ouvertes.fr/hal-00300858
Submitted on 10 Jan 2003HAL is a multi-disciplinary open access
archive for the deposit and dissemination of sci-entific research documents, whether they are pub-lished or not. The documents may come from teaching and research institutions in France or abroad, or from public or private research centers.
L’archive ouverte pluridisciplinaire HAL, est destinée au dépôt et à la diffusion de documents scientifiques de niveau recherche, publiés ou non, émanant des établissements d’enseignement et de recherche français ou étrangers, des laboratoires publics ou privés.
Hygroscopic properties of different aerosol types over
the Atlantic and Indian Oceans
A. Maßling, A. Wiedensohler, B. Busch, C. Neusüß, Philip Quinn, T. Bates,
D. Covert
To cite this version:
A. Maßling, A. Wiedensohler, B. Busch, C. Neusüß, Philip Quinn, et al.. Hygroscopic properties of different aerosol types over the Atlantic and Indian Oceans. Atmospheric Chemistry and Physics Discussions, European Geosciences Union, 2003, 3 (1), pp.135-185. �hal-00300858�
ACPD
3, 135–185, 2003 Hygroscopic properties of different aerosol types A. Maßling et al. Title Page Abstract Introduction Conclusions References Tables Figures J I J I Back CloseFull Screen / Esc
Print Version Interactive Discussion
c
EGU 2003 Atmos. Chem. Phys. Discuss., 3, 135–185, 2003
www.atmos-chem-phys.org/acpd/3/135/ c
European Geosciences Union 2003
Atmospheric Chemistry and Physics Discussions
Hygroscopic properties of di
fferent
aerosol types over the Atlantic and Indian
Oceans
A. Maßling1, A. Wiedensohler1, B. Busch1, C. Neus ¨uß1, P. Quinn2, T. Bates2, and
D. Covert3
1
Institute for Tropospheric Research, Permoserstr. 15, 04318 Leipzig, Germany
2
Northern Organization Atlantic Administration/Pacific Marine Environmental Laboratory (NOAA/PMEL), 7600 Sand Point Way NE, Seattle, WA 98115, USA
3
Department of Atmospheric Science, University of Washington, Box 354235, Seattle, WA 98195-4235, USA
Received: 8 October 2002 – Accepted: 4 November 2002 – Published: 10 January 2003 Correspondence to: A. Maßling (massling@tropos.de)
ACPD
3, 135–185, 2003 Hygroscopic properties of different aerosol types A. Maßling et al. Title Page Abstract Introduction Conclusions References Tables Figures J I J I Back CloseFull Screen / Esc
Print Version Interactive Discussion
c
EGU 2003
Abstract
Hygroscopic properties of atmospheric particles were studied in the marine tropo-spheric boundary layer over the Atlantic and Indian Oceans during two consecutive field studies: the Aerosols99 cruise (Atlantic Ocean) from 15 January to 20 Febru-ary 1999, and the INDOEX cruise (Indian Ocean Experiment) from 23 FebruFebru-ary to 5
30 March 1999. The hygroscopic properties were compared to optical and chemical properties, such as absorption, chemical inorganic composition, and mass concentra-tion of organic and elemental carbon, to identify the influence of these parameters on hygroscopicity.
During the two field studies, four types of aerosol-sampling instruments were used 10
on board the NOAA (Northern Organization Atlantic Administration) Research Ves-sel Ronald H. Brown: Hygroscopicity Tandem Differential Mobility Analyzer (HTDMA), seven-stage cascade impactor, two-stage cascade impactor, and Particle Soot Absorp-tion Photometer (PSAP). The HTDMA was used to determine the hygroscopic proper-ties of atmospheric particles at initial dry sizes (Dp) of 50, 150, and 250 nm and at 15
relative humidities (RH) of 30, 55, 75, and 90%. The HTDMA data provide insight into the mixing state of the aerosol in terms of its hygroscopic behavior. Simultaneously, a seven-stage cascade impactor (3 in the sub-µm size range) was used to determine the molar composition of the major inorganic ions such as ammonium and sulfate ions. A two-stage cascade impactor (1 in the sub-µm size range, 1 in the sup-µm size range) 20
was used to determine the mass concentration of organic and elemental carbon. The PSAP was used (at a wavelength of 565 nm) to measure the light absorption coefficient of the aerosol.
During the two field studies, air masses of several different origins passed the ship’s cruise path. The air mass back-trajectory analysis revealed marine air masses as well 25
as air masses with continental influence from Africa, India, or Arabia. The occurrence of different air masses was classified into special time periods signifying the origin of the observed aerosol. All time periods showed a group of particles with high hygroscopic
ACPD
3, 135–185, 2003 Hygroscopic properties of different aerosol types A. Maßling et al. Title Page Abstract Introduction Conclusions References Tables Figures J I J I Back CloseFull Screen / Esc
Print Version Interactive Discussion
c
EGU 2003 growth. The measured average hygroscopic growth factors ranged from 1.6 to 2.0,
depending on the dry particle size and on the type of air mass. Particles with low hygroscopic growth occurred only when continentally influenced air masses arrived at the ship’s position. Distinctions in hygroscopic growth of particles of different air masses were more significant for small relative humidities (30% or 55% RH).
5
High concentrations of elemental carbon corresponded with high light absorption co-efficients and with the occurrence of less-hygroscopic and nearly hydrophobic particle fractions in the hygroscopic growth distributions.
Finally, a solubility model was used to calculate soluble particle volume fractions for air masses of different origin in the Northern and Southern Hemispheres.
10
A key finding is that clean marine air masses that had no land contact for five to six days could clearly be distinguished from polluted air masses that had passed over a continent several days before reaching the ship. This distinction was based on results by taking into account only the hygroscopic characteristics and the solubility of the observed particles.
15
1. Introduction
Aerosol particles influence the radiative budget of the earth directly by scattering and absorbing the incoming sunlight and indirectly by serving as cloud condensation nuclei (CCN), (Charlson et al., 1992; Twomey et al., 1977). Although the greenhouse effect can be estimated fairly well, knowledge about the direct and indirect effect of aerosols 20
has been limited up to now. The influence of aerosols on the radiative budget of the earth is supposedly on the same order of magnitude as the radiative forcing of green-house gases (IPCC, 2001). The determination of physical and chemical properties of aerosol particles is therefore necessary to understand direct and indirect forcing, and thus lead to a reduction in the uncertainties in global climate models.
25
A critical physical characteristic of an aerosol particle is its hygroscopic behavior. Hygroscopic properties of soluble atmospheric particles significantly influence the size
ACPD
3, 135–185, 2003 Hygroscopic properties of different aerosol types A. Maßling et al. Title Page Abstract Introduction Conclusions References Tables Figures J I J I Back CloseFull Screen / Esc
Print Version Interactive Discussion
c
EGU 2003 of the particles at ambient relative humidity, and thus influence the scattering capability
and residence time of these particles in the atmosphere (Ogren et al., 1992). For that reason, hygroscopic data are also required to calculate microphysical aerosol proper-ties such as size distribution or scattering at ambient conditions.
Furthermore, knowledge of hygroscopic aerosol properties is needed because they 5
determine the number of CCN, and thus determine the resulting droplet size distri-bution of a cloud, which in turn affects cloud albedo (Twomey, 1974). The impact of aerosol particles in the marine boundary layer is potentially high, because the oceans cover a large area of the Earth and because clouds in this layer are estimated to control about one-third of the earth’s albedo (Charlson et al., 1987). The radiative properties 10
of marine clouds are known to be susceptible to changes in their aerosol composition due to anthropogenic influence (Taylor and McHaffie, 1993). In addition, aerosol hygro-scopicity measurements provide information about the mixing state and the chemical components of aerosol particles.
Hygroscopic behavior of aerosol particles has been investigated at different loca-15
tions; e.g. Los Angeles by McMurry and Stolzenburg (1989), Po Valley by Svennings-son et al. (1992), Pacific and Southern Oceans by Berg et al. (1998), and eastern Northern Atlantic Ocean by Swietlicki et al. (2000). Comprehensive field studies in the past include the Aerosol Characterization Experiments ACE 1 and ACE 2, which determined the physical, chemical, and optical properties of aerosols in the marine 20
boundary layer over the Pacific and Southern Oceans and over the eastern Northern Atlantic Ocean (Berg et al., 1998; Swietlicki et al., 2000). However, up to now, no such investigations have been done for the Southern Atlantic Ocean or the Indian Ocean.
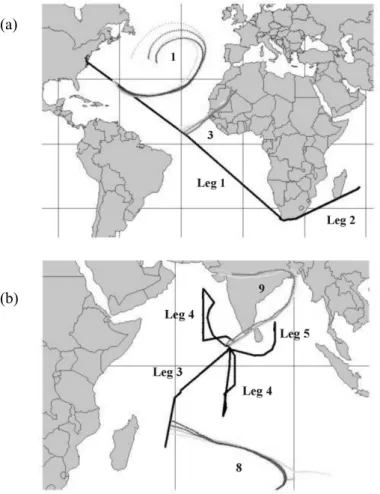
In this study, hygroscopic properties of atmospheric particles were measured dur-ing two consecutive field studies. The first study, Aerosols99 cruise (Fig. 1a: Atlantic 25
Ocean), occurred from 15 January to 20 February 1999, and traveled from Norfolk, USA, via Cape Town, South Africa, to Port Louis, Mauritius. The second study, IN-DOEX (Fig. 1b: Indian Ocean Experiment) cruise, occurred from 23 February to 30 March 1999, and traveled from Port Louis, Mauritius, to Male, Maldives, and in the
re-ACPD
3, 135–185, 2003 Hygroscopic properties of different aerosol types A. Maßling et al. Title Page Abstract Introduction Conclusions References Tables Figures J I J I Back CloseFull Screen / Esc
Print Version Interactive Discussion
c
EGU 2003 gion of the Maldives Islands. The hygroscopic properties were determined for different
air masses encountered during the two field studies. The air masses were classified according to their origin, age, and pollution level. The hygroscopic properties were then compared to measured optical and chemical properties, such as absorption, chemical inorganic composition, and mass concentration of organic and elemental carbon, to 5
identify the implication of these parameters on hygroscopicity.
2. Field studies
Chemical, optical, and physical aerosol properties were measured in the marine bound-ary layer over the Atlantic and Indian Oceans during two field studies onboard the American Research Vessel Ronald H. Brown. The Aerosols99 field study, which stud-10
ied the Atlantic Ocean, was divided into two parts: Leg 1 was from Norfolk, USA (37◦N latitude, 76◦W longitude, 15 day of year, DOY), to Cape Town, South Africa (34◦S lati-tude, 18◦E longitude, DOY 40), and Leg 2 from Cape Town, South Africa (34◦S latitude, 18◦E longitude, DOY 42), to Port Louis, Mauritius, (21◦S latitude, 57◦E longitude, DOY 51), (Bates et al., 2001; Quinn et al., 2002). The INDOEX field study, which studied the 15
Indian Ocean, was divided into three parts: Leg 3 was from Port Louis, Mauritius (DOY 54), to Male, Maledives (20◦S latitude, 57◦E longitude, DOY 60), Leg 4 was from Male (DOY 63) in the region of the Maledives to Male (DOY 82), and Leg 5 was from Male (DOY 85) in the region of the Bay of Bengal to Male (DOY 89). In Figs. 1a and 1b, the cruise tracks of both field studies are pictured identified by the black lines.
20
During the route from Norfolk to Male, aerosols of different age and origin that iden-tified various polluted air masses passed the ship’s cruise path. Clean marine air masses (no land contact for five to six days) from the northern Atlantic Ocean, south-ern Atlantic Ocean, and Indian Ocean, as well as continentally influenced air masses (passed over a continent several days before reaching the ship) from northern and 25
western Africa, Indian Subcontinent, and Middle East were observed. The different air masses were categorized by using air-mass back-trajectory analysis, measured
ACPD
3, 135–185, 2003 Hygroscopic properties of different aerosol types A. Maßling et al. Title Page Abstract Introduction Conclusions References Tables Figures J I J I Back CloseFull Screen / Esc
Print Version Interactive Discussion
c
EGU 2003 aerosol number concentrations and measured size distribution. The trajectories were
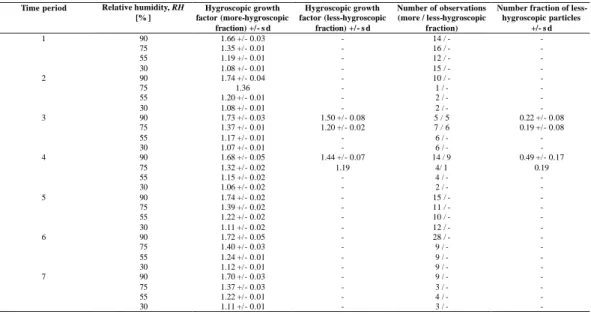
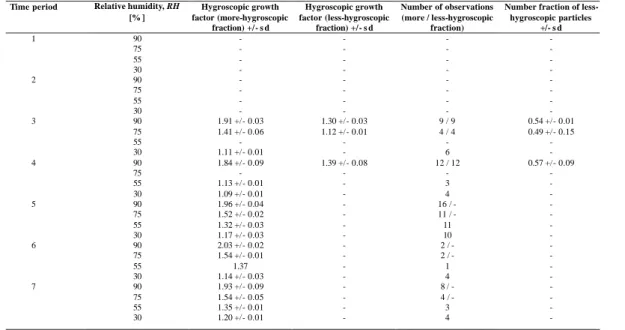
calculated four times daily (06:00, 12:00, 18:00, and 24:00 h local time) for three alti-tudes (950, 750, and 500 mbar), (Bates et al., 2001; Quinn et al., 2002). The two field studies involved a combined total of 13 consecutive time periods, ranging from one to six days each. The classification of the time periods was made on the basis of the 5
origin and type of the observed air masses. Table 1 summarizes the different types of air masses encountered during the two field studies.
For 6 of the 13 time periods, air masses dominated by a clean marine aerosol pre-vailed. These air masses were classified into different subtypes, based on their origin in different regions of the Atlantic and Indian Oceans (Bates et al., 2001; Quinn et al., 10
2002). Air masses dominated by the Sahara Desert and biomass burning of the west African coast were encountered only near the equator and the Inter Tropical Conver-gence Zone (ITCZ). Emissions from the Indian Subcontinent and Middle East were only found in air masses in the Northern Hemisphere portion of the Indian Ocean. In Figs. 1a and 1b, calculated 950 mbar back-trajectories are presented for certain time 15
periods.
The data presented here is divided into five parts: Legs 1 and 2 of Aerosols99 (Atlantic Ocean) and Legs 3 to 5 of INDOEX (Indian Ocean). The x-axis for all figures is day of year (DOY), where 1 January (12:00 noon) is 1.5. The interesting time periods 2, 3, 4 ( continental influence during Aerosols99) and 9 (strong continental influence 20
during INDOEX) will be discussed in detail and thus these time periods are marked in the figures in particular.
3. Chemical and physical measurements
3.1. Chemical inorganic composition
The chemical inorganic ionic composition was obtained from a seven-stage cascade 25
ACPD
3, 135–185, 2003 Hygroscopic properties of different aerosol types A. Maßling et al. Title Page Abstract Introduction Conclusions References Tables Figures J I J I Back CloseFull Screen / Esc
Print Version Interactive Discussion
c
EGU 2003 (Berner et al., 1979). The major ions were analyzed by ion chromatography (Quinn
et al., 1998). The detection limit of each impactor stage was determined from blank samples taken several times during the cruise (Quinn et al., 2001, 2002).
3.2. Total aerosol mass
The total aerosol mass was obtained from a two-stage cascade Berner impactor of 5
which one stage was in the sub-µm size range and one stage in the sup-µm size range (Berner et al., 1979). The total aerosol mass was then determined by gravimetric analysis (Quinn et al., 2001, 2002).
3.3. Carbonaceous aerosol
Samples from a two-stage cascade Berner impactor were used for the carbon analysis 10
(Berner et al., 1979). The mass concentrations of elemental carbon (EC) and organic carbon (OC) in the sub-µm and sup-µm size ranges were determined using a thermo-desorption-method (Neus ¨uß et al., 2002).
The aerosol particles were sampled with a time resolution of 12 h for inorganic com-ponents, and 12 or 24 h (depending on the particle concentration) for EC and OC. The 15
filters were changed daily at 06:00 h and 18:00 h local time. All impactors were placed in a climate box so that the sampling was done under stable conditions at 55% ± 5%
RH (Quinn et al., 2001, 2002; Neus ¨uß et al., 2002).
3.4. Light absorption
Additionally, the light absorption coefficient for particles smaller than 10 µm in diame-20
ter was measured using a Particle Soot Absorption Photometer (PSAP) operated at a wavelength of 565 nm and at 55% ± 5% RH. During the INDOEX field study, the PSAP was operated in combination with a cut-off filter, thus yielding the light absorption coeffi-cient for particles smaller than 1 µm. The PSAP determines the absorption coefficient by monitoring the change in transmission through a filter. The data were corrected 25
ACPD
3, 135–185, 2003 Hygroscopic properties of different aerosol types A. Maßling et al. Title Page Abstract Introduction Conclusions References Tables Figures J I J I Back CloseFull Screen / Esc
Print Version Interactive Discussion
c
EGU 2003 according to the manufacturer’s calibration, scattering artifacts, flow rate through the
PSAP, and deposit diameter (Quinn et al., 2001, 2002). The PSAP sampled the aerosol with a time resolution of 15 min. The detection limit of the PSAP was 0.34 Mm−1. 3.5. Hygroscopicity
The HTDMA system was used for the hygroscopic growth measurements. This system 5
consists of two DMAs (Differential Mobility Analyzer) and a humidifier between the DMAs (Liu et al., 1978). The first DMA selects a monodisperse particle fraction from the atmospheric aerosol. This monodisperse particle fraction is passed through a humidity conditioner operated at an air flow humidified to 90% RH. This technique yields an aerosol flow with RH greater than 85%. The humidity of the sheath air flow of the 10
second DMA is regulated by mixing dry air (< 5% RH) and humid air (∼95% RH), and thus can then be adjusted between 30 to 90% RH.
Because the humidity of the sheath air flow and the aerosol flow can be adjusted separately, deliquescence as well as efflorescence behavior can be studied with the HTDMA. The aerosol humidity as well as the RH of the sheath air were continuously 15
measured by calibrated capacitive sensors and were adjusted after each scan to the desired RH.
The altered size distribution due to a possible uptake of water was then determined by using the second DMA and a Condensation Particle Counter (CPC), resulting in a hygroscopic growth distribution at that particle size and humidity. The hygroscopic 20
growth factor gf (RH) of each particle fraction in the hygroscopic growth distribution was then determined by the ratio of the particle size measured at that specific RH and dry particle size following Eq. (1):
gf (RH)= Dp(RH)
Dp(dry). (1)
The number fraction of each hygroscopic group in the distribution was determined by 25
ACPD
3, 135–185, 2003 Hygroscopic properties of different aerosol types A. Maßling et al. Title Page Abstract Introduction Conclusions References Tables Figures J I J I Back CloseFull Screen / Esc
Print Version Interactive Discussion
c
EGU 2003 of the number fractions of all groups occurring in the hygroscopic growth distribution.
The flow in the HTDMA is extremely reliable and stable; fluctuations in the aerosol flow or sheath air flow were less than 2.5%. The RH within the humidity conditioner as well as in all flow rates within the system were controlled and adjusted during the entire measurement.
5
The HTDMA was size-calibrated with latex spheres under ambient conditions (i.e. no humidification). Differences in size selection by the first and second DMAs were characterized by determining a calibration function, which was then used to correct all data for this effect of size-selection difference. The humidity sensors used in the HT-DMA were calibrated using the deliquescence behavior of three different salts, namely, 10
sodium chloride (NaCl), ammonium sulfate (NH4)2SO4, and potassium chloride (KCl). The measured deliquescence RH of these three salts were within ±0.5% RH of data reported by Seinfeld and Pandis (1998).
A temperature gradient between the humidity regulation sensor and the DMA itself can sometimes not be eliminated. Therefore, the RH inside the second DMA was 15
determined four times each day by a salt calibration to obtain the real RH during the measurement. The growth factors measured at 90% RH were corrected for this temperature-gradient effect. Nevertheless, the error in hygroscopic growth was cal-culated based on estimated uncertainties in RH within the HTDMA. The estimated uncertainty in measurements between 30% and 90% RH was ±1% RH. For measure-20
ment of the hygroscopic growth of an ammonium bisulfate particle determined with the HTDMA, this uncertainty results in a relative uncertainty of less than 5% for growth factors measured between 30% and 90% RH.
When the HTDMA is used without humidity regulation, the monodisperse aerosol distribution after the first DMA broadens due to the width of the transfer function of the 25
second DMA. Therefore, before the data was analyzed, all distributions were inverted using a Tandem Differential Mobility Analyzer inversion algorithm by Voutilainen et al. (2000) to account for this broadening.
ACPD
3, 135–185, 2003 Hygroscopic properties of different aerosol types A. Maßling et al. Title Page Abstract Introduction Conclusions References Tables Figures J I J I Back CloseFull Screen / Esc
Print Version Interactive Discussion
c
EGU 2003 day) when the system was recalibrated. Hygroscopic growth factors were determined
for particles with initial dry sizes (Dp) of 50, 150, and 250 nm. The distributions were obtained at 30, 55, 75, and 90% RH. The aerosol was humidified to RH > 85% for all measurements before coming into contact with the sheath air in the second DMA, so that all particles had exceeded their deliquescence point by the time they reached the 5
second DMA. The acquisition of each distribution took about 20 min because particle concentrations were sometime small (< 250#/cm3).
During both field studies, all instruments were set up in a container placed on deck of the ship. The aerosol was sampled at 18 m above sea level by using an 6-m-high inlet tower (Quinn et al., 2001, 2002). When the measurements were influenced by 10
emissions from the ship itself (evidenced by extremely high particle concentrations), the inlet was then closed. Because of local pollution, all data obtained within 250 km of the harbors of Norfolk, Cape Town, Port Louis, and Male were not included in the data evaluation.
3.6. Solubility 15
The mass ratio between soluble and insoluble material in a particle strongly influences the supersaturation at which the particle can be activated to form a cloud droplet (Kul-mala et al., 1996; Swietlicki et al., 1999). Under atmospheric conditions, sup-µm parti-cles are known to have a high probability of acting as CCN; however, knowledge about the probability of sub-µm particles acting as CCN is limited. The higher the soluble 20
mass, the lower the critical supersaturation required for CCN activation (Kulmala et al., 1996; Swietlicki et al., 1999). Thus, the soluble volume fraction of sub-µm aerosol par-ticles is an important input parameter for cloud models used to calculate cloud radiative properties, which are important for the Earth’s radiative balance.
Using a solubility model, we estimated the soluble volume fractions of the particles. 25
One basic assumption of the model was that particles consisted of a completely insol-uble core coated with solinsol-uble substances, such as ammonium sulfate or ammonium bisulfate. The two input parameters for the model were the observed hygroscopic
ACPD
3, 135–185, 2003 Hygroscopic properties of different aerosol types A. Maßling et al. Title Page Abstract Introduction Conclusions References Tables Figures J I J I Back CloseFull Screen / Esc
Print Version Interactive Discussion
c
EGU 2003 growth factor measured during the two field studies at a defined RH (here 90%) and
the empirical growth factor (at that RH) of the same particle assuming that this particle was completely soluble (i.e. composed only of the chemical inorganic ions determined by chemical analysis). Then, the soluble particle volume fraction that was active in taking up water could be calculated as (Swietlicki et al., 1999)
5
ε=gf
3
observed− 1
gfempirical3 − 1. (2)
Here, gfobservedis the measured growth factor during the two field studies and gfempirical is the growth factor of the theoretically completely soluble particle, which was derived by operation of the HTDMA within a laboratory experiment determining the hygroscopic growth of particles with different ratios of ammonium ions to sulfate ions.
10
4. Results and discussion
4.1. Chemical inorganic composition
Figure 2 shows the molar composition of the major inorganic ions measured for 80 <
Dae < 184 nm (first impactor stage) and for 184 < Dae < 308 nm (second
im-pactor stage). These two stages cover the size range that was also determined by 15
the HTDMA-measurements.
At the beginning of Leg 1 as well as during Leg 3, high concentrations of sodium and chloride ions were sometimes detected in both size ranges. These concentrations can be assigned to sea salt particle production during periods of high wind speeds (>10 m/s2) in the days preceding those measurements. During time periods 3 and 20
4 (Aerosols99, Leg 1: DOY 25–DOY 30), air masses influenced by biomass burning were encountered. For these two time periods, high concentrations of potassium were detected, indicating that the observed air masses were anthropogenically influenced
ACPD
3, 135–185, 2003 Hygroscopic properties of different aerosol types A. Maßling et al. Title Page Abstract Introduction Conclusions References Tables Figures J I J I Back CloseFull Screen / Esc
Print Version Interactive Discussion
c
EGU 2003 by biomass burning (Philip et al., 1999). However, for all other time periods,
ammo-nium and sulfate ions dominated the molar composition for both size ranges, assuming that the major inorganic components of the aerosol were a mixture of ammonium sul-fate, ammonium bisulsul-fate, and sulfuric acid. The residual ions were chlorine, nitrate, methanesulfonate, sodium, potassium, magnesium, and calcium. Especially for Legs 5
4 and 5 during INDOEX, residual ions were only 15% for particles of 80 < Dae < 184
nm (first impactor stage, Fig. 2) and 10% for 184 < Dae < 308 nm (second impactor
stage, Fig. 2).
Figure 3 shows the molar ratio of ammonium ions to sulfate ions calculated for par-ticles in these two size ranges. During Aerosols99 (Atlantic Ocean, Legs 1–2), for 10
all time periods, the ratio for particles of 80 < Dae < 184 nm was smaller than 0.8,
whereas during INDOEX (Indian Ocean, Legs 3–5), it ranged between 0.8 and 1.2. During both field studies, this ratio was higher for particles of 184 < Dae < 308 nm
than for particles of 80 < Dae < 184 nm. One reason for this higher ratio might be
aging processes. Particles with larger diameters might have resided longer in the at-15
mosphere, and thus water soluble material might have condensed on them or they might have been cloud processed and thereby became more neutralized. Here, “cloud processed” means the activation of a particle to a cloud droplet and the condensation of condensable material onto the particle. The results from higher impactor stages support this conclusion.
20
The ratio of ammonium ions to sulfate ions indicates that the inorganic fraction of the aerosol over the Atlantic Ocean (Fig. 3, Aerosols99, Legs 1–2) was mainly composed of sulfuric acid, whereas the aerosol over the Indian Ocean (Fig. 3, INDOEX, Legs 3–5) was composed of a mixture of ammonium sulfate and ammonium bisulfate.
4.2. Total aerosol mass 25
Table 1 lists the total aerosol mass concentration and the mass concentrations of EC (elemental carbon mass) and OC (organic carbon mass) for particles of Dae < 1µm,
ACPD
3, 135–185, 2003 Hygroscopic properties of different aerosol types A. Maßling et al. Title Page Abstract Introduction Conclusions References Tables Figures J I J I Back CloseFull Screen / Esc
Print Version Interactive Discussion
c
EGU 2003 The total aerosol mass concentration was significantly higher for those air masses that
were continentally influenced (e.g. time periods 2, 3, 4, 9, 10, 12, 13).
During Aerosols99, the highest aerosol mass concentration (5.45 µg/m3) occurred in time period 3 (DOY 25–27), when air masses polluted by African dust and biomass burning reached the ship. High aerosol mass concentrations exceeding 4 µg/m3also 5
occurred in time period 2 (DOY 23–25, African dust air mass) and time period 4 (DOY 27–29.8, biomass burning in the ITCZ), whereas concentrations lower than 1.5 µg/m3 were detected when marine air masses were encountered.
During INDOEX in time period 9 (DOY 63.5–66.5), air masses influenced by the Indian Subcontinent arrived at the ship, evidenced by an increase in total aerosol mass 10
concentration up 18.44 µg/m3. In general, the highest concentration of aerosol mass occurred in this time period 9, which was characterized by air masses that had crossed the Indian Subcontinent 12 to 36 h before they reached the ship.
4.3. Carbonaceous aerosol
During Aerosols99, for time period 2 (DOY 23–25), the back-trajectory analysis shows 15
that air masses influenced by African desert dust reached the ship. Time period 3 (DOY 25–27) shows a mixture of air masses from northern and western Africa, as evidenced by the higher mass concentration of EC (Table 1). Time period 4 (DOY 27–29.8) was exclusively influenced by biomass burning (Bates et al., 2001). For the time period influenced by mixed air masses (time period 3, DOY 25–27), the mass concentration 20
of EC reached 0.30 µg/m3 in the sub-µm size range (Table 1). The increase in EC concentration to 0.43 µg/m3 during the subsequent time period 4 (DOY 27–29.8) in-dicates a change in air mass to one that is influenced only by biomass burning. For both time periods, an increase in mass concentration of OC was also detected (0.12
µg/m3and 0.28 µg/m3, respectively). However, lower OC concentrations of 0.1 µg/m3 25
OC were typical in the sub-µm size range for clean marine air masses that had no land contact for five to six days (Table 1). Here, based on the field blank mean values taken several times during the field studies, the detection limits (95% confidence level)
ACPD
3, 135–185, 2003 Hygroscopic properties of different aerosol types A. Maßling et al. Title Page Abstract Introduction Conclusions References Tables Figures J I J I Back CloseFull Screen / Esc
Print Version Interactive Discussion
c
EGU 2003 were 0.16 µg/m3for OC and 0.07 µg/m3for EC for a typical day/night sampling period
(Neus ¨uß et al., 2002). Therefore, all of the OC and EC concentrations for clean marine air masses during Aerosols99 were close to the detection limits.
Furthermore, the highest concentration of EC in the sub-µm size range (1.64 µg/m3) occurred in time period 9, when air masses from the Indian Subcontinent reached the 5
ship (INDOEX, DOY 63.5–66.5, Table 1). Here, individual values of about 2.0 µg/m3 were detected. In contrast to the analysis of the major inorganic ions, the analysis of OC and EC in the collected samples showed significant variations, which can be explained by differently polluted air masses encountered during the field studies. A key result of this EC and OC analysis is that significant mass concentrations of EC 10
were detected only for continentally influenced air masses (Table 1). It is evident, that also air masses that had land contact several days before they reached the ship show increased values of aerosol mass and particularly of elemental carbon mass concentration.
Anthropogenic sources mainly emit particles with maximum diameter of several hun-15
dred nanometers. Several reports show that direct emissions from vehicles have their maximum particle diameter in the size distribution from between 40 nm and 70 nm (Maricq et al., 1999; Ristovski et al., 1998). Emissions from coal-fired heating plants, industrial boilers, and fireplace combustions are known to have their maximum in size distribution in the range between 100 and 500 nm (Hildemann et al., 1991; Wehner et 20
al., 2002). These reports underscore the strong relationship between sub-µm EC and anthropogenic influence.
4.4. Light absorption
In Table 1, the mean values of the light absorption coefficient measured with the PSAP are listed. The measured coefficients correlate well with the data obtained 25
for EC; increasing mass concentrations of EC correspond with increasing absorption coefficients. For time period 3 (Mixed air mass; African dust and biomass burning,
ACPD
3, 135–185, 2003 Hygroscopic properties of different aerosol types A. Maßling et al. Title Page Abstract Introduction Conclusions References Tables Figures J I J I Back CloseFull Screen / Esc
Print Version Interactive Discussion
c
EGU 2003 Aerosols99, DOY 25–27), the light absorption coefficient reached individual values of
8 Mm−1, for time period 4 (biomass burning, Aerosols99, DOY 25–27.8) 13 Mm−1, and for time period 9 (Indian Subcontinent and directly to the ship, INDOEX, DOY 63.5– 66.5) 20 Mm−1. In contrast, the coefficients for clean marine air masses were near or less than the detection limit of 0.34 Mm−1 (Quinn et al., 2001, 2002). Thus, the EC 5
concentration together with the measured light absorption coefficient indicate that time periods 2, 3, 4, 9, 10, 12, and 13 were mainly continentally influenced. This indication is supported by the back-trajectory analysis done by Bates et al. (2001) and Quinn et al. (2002).
4.5. Hygroscopicity 10
In this presentation, all particles were classified into three different groups appearing as three different modes in the hygroscopic growth distributions: nearly hydrophobic, less-hygroscopic, and more-hygroscopic.
The hygroscopic properties as determined by the HTDMA are presented here as two parameters: the hygroscopic growth factor for each of the observed growth groups as 15
a function of RH and the initial dry sizes, and the particle fraction in each group. 4.5.1. Growth factors of different aerosol types measured at 90% RH
More-hygroscopic particles
Figure 5 shows the hygroscopic growth factors measured at 90% RH for particles 20
with initial dry sizes of 50, 150, and 250 nm for each Leg of the field studies. In general, a more-hygroscopic fraction of aerosol particles was detected at 90% RH for all time periods and for all sizes. The average growth factors for this fraction at 90% RH ranged between 1.66 and 1.74 for 50-nm particles, between 1.80 and 1.93 for 150-nm particles, and between 1.84 and 2.03 for 250-nm particles. The mean 25
ACPD
3, 135–185, 2003 Hygroscopic properties of different aerosol types A. Maßling et al. Title Page Abstract Introduction Conclusions References Tables Figures J I J I Back CloseFull Screen / Esc
Print Version Interactive Discussion
c
EGU 2003 These values agree with those for marine aerosols measured during ACE 1 (Aerosol
Characterization Experiment 1) over the Pacific Ocean and Southern Ocean, namely, 1.66 for 50-nm particles and 1.78 for 150-nm particles (Berg et al., 1998).
The smallest average growth factors for the more-hygroscopic particle group at 90%
RH occurred for the air mass influenced by biomass burning in the ITCZ (Aerosols99,
5
Fig. 5, DOY 27–29.8), namely, 1.68 (50-nm particles), 1.8 (150-nm), and 1.84 (250-nm). In contrast, the average growth factors for the clean marine air masses ranged between 1.66 and 1.74 (50-nm), 1.86 and 1.93 (150-nm), and 1.91 and 2.03 (250-nm). The highest average growth factors occurred during time period 6 (Aerosols99, Fig. 5, DOY 43–48.5), when southern Atlantic marine air masses were encountered, namely, 10
1.93 (150-nm) and 2.03 (250-nm). These high growth factors can be explained by the chemical composition of the particles, which show small concentrations of sodium and chloride at this size, implying that sea salt particles were included in the measurements. During INDOEX, the change in air mass from time period 8 (Southern Hemisphere portion of the Marine Indian Ocean, Fig. 5, DOY 54–56.6 and 78.25–79.5) to time 15
period 9 (Indian Subcontinent and directly to the ship, Fig. 5, DOY 63.5–66.5) corre-sponds with the change in hygroscopic growth factors from 1.89 to 1.82 (150-nm) and from 1.98 to 1.89 (250-nm).
Less-hygroscopic particles 20
For both field studies, less-hygroscopic particle fractions were detected only during those time periods when the ship encountered continentally influenced air masses (e.g. time periods 2, 3, 4, 9, 10, 12, 13). This corresponds with increasing EC concentra-tions, which were detected only during those time periods.
25
For Aerosols99, less-hygroscopic particle fractions were detected only during time periods 3 and 4 (Fig. 5, DOY 25–27, 27–29.8), when the air masses were affected by biomass burning. For these two time periods, the average growth factors for the less-hygroscopic particle group were between 1.44 and 1.50 (50-nm), between 1.45
ACPD
3, 135–185, 2003 Hygroscopic properties of different aerosol types A. Maßling et al. Title Page Abstract Introduction Conclusions References Tables Figures J I J I Back CloseFull Screen / Esc
Print Version Interactive Discussion
c
EGU 2003 and 1.47 (150-nm), and between 1.30 and 1.39 (250-nm). During INDOEX, the
small-est growth factors of less-hygroscopic particles (150-nm and 250-nm) were detected during time period 9 (Fig. 5, DOY 63.5–66.5), when Indian Subcontinent air masses with a transport time between 12 and 36 hours were encountered. In this time period, average growth factors reached 1.54 for the 150-nm particles and 1.59 for the 250-nm 5
particles.
In contrast, the growth factor for the less-hygroscopic particles during ACE 1 were between 1.24 and 1.39 (50-nm) and between 1.33 and 1.36 (165-nm) and also oc-curred only for polluted air masses (Berg et al., 1998).
10
Hydrophobic particles
During Aerosols99, particles with growth factors smaller than 1.2, which might be classified as nearly hydrophobic particles, were not detected for any time period. The reason is that only aged aerosols (cloud processing, condensation of soluble material) 15
were encountered.
In contrast, during time period 9 (INDOEX, Fig. 5, DOY 63.5–66.5), when air masses from the Indian Subcontinent arrived at the ship, all three types of particle fractions were detected (less-hygroscopic, more-hygroscopic, and nearly hydrophobic). For this time period, the highest light absorption coefficient as well as the highest EC con-20
centration were measured. The nearly hydrophobic particle group had growth factors between 1.15 and 1.3.
Number fractions 25
The average number fraction of less-hygroscopic particles was about 22% (50-nm) and 46% (150-nm) for time period 3 (Mixed; African dust and biomass burning in the ITZC, Aerosols99, DOY 25–27) and increased to approximately 49% (50-nm) and 66% (150-nm) for time period 4 (biomass burning in the ITZC, Aerosols99, DOY 27–29.8).
ACPD
3, 135–185, 2003 Hygroscopic properties of different aerosol types A. Maßling et al. Title Page Abstract Introduction Conclusions References Tables Figures J I J I Back CloseFull Screen / Esc
Print Version Interactive Discussion
c
EGU 2003 The higher fraction in time period 4 corresponds with a much higher EC concentration
in time period 4 (0.43 µg/m3) than in time period 3 (0.30 µg/m3) for sub-µm particles, although the total aerosol mass decreased. This correspondence indicates that less-hygroscopic particles were mainly composed of EC.
Although the number fraction of less-hygroscopic particles for time period 9 (IN-5
DOEX, DOY 63.5–66.5) averaged between 35 and 41% depending on dry particle size, the number fraction of nearly hydrophobic particles averaged between 5 to 7%. In this time period, these particles were from Indian Subcontinent air masses arriving at the ship. The back-trajectory analysis shows a travel time of 12 to 36 h for these air masses to reach the ship from the continent.
10
Overall, continentally influenced marine air masses could be identified during both field studies by the occurrence of less-hygroscopic and nearly hydrophobic groups of aerosol particles. A strong continental influence was indicated to increased concentra-tions of sub-µm elemental carbon related to high values of number fracconcentra-tions of less-hygroscopic particles.
15
4.5.2. Growth factors of different aerosol types measured at 75% RH
Figure 6 shows the hygroscopic growth factors measured at 75% RH. The trends are similar to those seen for the factors measured at 90% RH (Fig. 5). Average growth factors of more-hygroscopic particles were smaller than those for 90%, and were be-tween 1.32 and 1.40 (50-nm), bebe-tween 1.25 and 1.51 (150-nm), and bebe-tween 1.39 and 20
1.54 (250-nm). In contrast, less-hygroscopic particles measured at 75% RH ranged between 1.17 and 1.20 (50-nm), 1.17 and 1.20 (150-nm), and 1.12 and 1.29 (250-nm) depending on the type of air mass (Fig. 6). Nearly hydrophobic particles and less-hygroscopic particles could not be distinguished at 75% RH. The growth factors of the more-hygroscopic particle fraction correspond to the high growth factors measured at 25
90% RH for this particle fraction. This correspondence implies that these particles were composed of high amounts of hygroscopically active material, as discussed earlier for the chemical inorganic composition that showed ammonium and sulfate dominating
ACPD
3, 135–185, 2003 Hygroscopic properties of different aerosol types A. Maßling et al. Title Page Abstract Introduction Conclusions References Tables Figures J I J I Back CloseFull Screen / Esc
Print Version Interactive Discussion
c
EGU 2003 the molar distribution. The less-hygroscopic particles measured at 75% RH occurred
only when continentally influenced air masses were encountered, corresponding to increased mass concentrations of EC (Table 1).
4.5.3. Growth factors of different aerosol types measured at 55% RH
For the hygroscopicity measurements done at 30 and 55% RH, the hygroscopic growth 5
distribution appeared in one mode, hence less-hygroscopic and more-hygroscopic par-ticles could not be distinguished. Figure 7 shows the hygroscopic growth factors mea-sured at 55% RH.
During Aerosols99, a remarkable decrease in hygroscopic growth at 55% RH oc-curred for continentally influenced air masses and for all three particle sizes (time pe-10
riods 2–4, Figs. 7a, b and c, DOY 23–29.8). For Aitken mode particles (Dp= 50 nm, Fig. 7a), the average growth factor for the marine air masses ranged from 1.19 to 1.24, whereas that for the continentally influenced air masses ranged from 1.15 to 1.20. For accumulation mode particles (Dp = 150 and 250 nm), this decrease in hygroscopic growth was greater (Fig. 7).
15
During INDOEX, a decrease in hygroscopic growth at 55% RH occurred between time period 8 (Southern Hemisphere portion of the Marine Indian Ocean, Fig. 7, DOY 54–56.6) to time period 9 (Indian Subcontinent and directly to the ship, Fig. 7, DOY 63.5–66.5). This decrease was particularly evident for the accumulation mode parti-cles.
20
4.5.4. Growth factors of different aerosol types measured at 30% RH
Figure 8 shows that a reduction in hygroscopic growth for continentally influenced air masses also occurred at 30% RH. Although particles generally absorb only small amounts of water at this low RH, the difference in hygroscopic growth was evident between clean marine air masses and continentally influenced air masses (Fig. 8). 25
be-ACPD
3, 135–185, 2003 Hygroscopic properties of different aerosol types A. Maßling et al. Title Page Abstract Introduction Conclusions References Tables Figures J I J I Back CloseFull Screen / Esc
Print Version Interactive Discussion
c
EGU 2003 tween different air masses were small, and were only noticeable for the change in
air mass between time period 8 (Southern Hemisphere portion of the Marine Indian Ocean, Fig. 8, DOY 54–56.6, 78.25–79.5) and time period 9 (Indian Subcontinent and directly to the ship, Fig. 8, DOY 63.5–66.5) and for particles with initial dry sizes of 150 and 250 nm.
5
4.5.5. Parameterization of hygroscopic growth of more-hygroscopic particles
Information on hygroscopic growth of aerosol particles is critical in determining the influence of such particles on the earth’s radiative budget. The increase in particle size due to the uptake of water is an important parameter for characterizing aerosol particles at ambient conditions. Models dealing with the impact of aerosol particles on 10
the radiative balance need this information to calculate size distributions at ambient RH in the highly varying humidity field of the troposphere. Based on a parameterization by Swietlicki et al. (1999), we derived a parameterization of hygroscopic growth from the hygroscopic growth data measured at 90, 75, 55, and 30% RH for all measured particle sizes. Therefore, a simple function with two fit parameters (Eq. 3) has been adapted to 15
the data obtained during Aerosols99 and INDOEX:
gf (RH)= A × (1 − RH)γ. (3)
This parameterization is only valid for 30% ≤ RH ≤ 90%. In this equation, RH is not a percentage but rather a number between 0 and 1, defined as the ratio between the actual water vapor pressure and the saturation water vapor pressure. The fit param-20
eters, A and γ, were derived for the averaged growth factors of the more-hygroscopic particle fractions at 90% and at 75% RH and for the single hygroscopic growth mode found at 55% and at 30% RH. Figure 9 shows the parametric fits for dry particle sizes of 50, 150, and 250 nm for the Southern Indian Ocean marine air mass encountered in time period 7 during Aerosols99.
25
Generally, the calculated and measured hygroscopic growth factors increased with increasing dry particle size. The similarity in the shape of these curves shows that
ACPD
3, 135–185, 2003 Hygroscopic properties of different aerosol types A. Maßling et al. Title Page Abstract Introduction Conclusions References Tables Figures J I J I Back CloseFull Screen / Esc
Print Version Interactive Discussion
c
EGU 2003 particles exhibited similar behavior in hygroscopic growth, although the growth itself
differed and this difference was greater between the 50-nm and 150-nm particles than between the 150-nm and 250-nm particles. A simple reason for this difference is the Kelvin effect, which mainly affects particles smaller than 100 nm in diameter. Thus, the difference in hygroscopic growth between 150-nm and 250-nm particles is small 5
considering only one type of air mass (time period 7, Southern Indian Ocean marine air mass, Aerosols99). Another reason might be that during this time period the accu-mulation mode particles also included sea salt. This sea salt might lead to an increase in hygroscopic growth, especially at high RH.
Figure 10 shows a comparison of parametric fits for 50-nm particles (more-hygroscopic) 10
for clean marine air masses in time period 6 (South Atlantic marine air mass, Aerosols99) and time period 8 (Marine Indian Ocean air mass, INDOEX), and for continentally pol-luted air masses in time period 4 (biomass burning in the ITCZ, Aerosols99) and in time period 9 (Indian Subcontinent and directly to the ship, INDOEX). At low RH (≤ 75%), the difference in hygroscopic growth between the two types of air masses was signif-15
icant, whereas at high RH (≥ 75%), the difference was small. These trends shown in Fig. 10 were independent of particle size. Differences in hygroscopic growth of aerosol particles of diverse aerosol types (e.g. clean marine and continentally influ-enced air masses) are much more significant for low RH. However, these differences disappear with increasing RH. One reason for this effect of RH might be that less-20
and more-hygroscopic particle fractions of the continental influenced aerosol could be distinguished at high RH, whereas at low RH these fractions were mixed, resulting in smaller growth factors. The parametric fits explain well the hygroscopic behavior for the clean marine air masses, but only somewhat explain that for the polluted air masses. The parameterization using Eq. (3) is a good tool for describing hygroscopic growth of 25
aerosol particles in unpolluted air masses at various RH. The fit results using A and γ as fit parameters for all time periods are listed in the Appendix (Tables 5 and 9).
ACPD
3, 135–185, 2003 Hygroscopic properties of different aerosol types A. Maßling et al. Title Page Abstract Introduction Conclusions References Tables Figures J I J I Back CloseFull Screen / Esc
Print Version Interactive Discussion
c
EGU 2003 4.5.6. Hygroscopic growth of less-hygroscopic particles
Figure 11 shows the hygroscopic growth factors for the less-hygroscopic particles ( 50-nm and 150-50-nm) measured at 90% and at 75% RH together with the single hygroscopic growth mode determined at 55% and at 30% RH during time period 4 (biomass burning in the ITCZ, Aerosols99) and 9 (Indian Subcontinent and directly to the ship, INDOEX). 5
Less- and more-hygroscopic particles could not be distinguished at low RH of 30 and 55%, and thus only one growth factor was measured, leading to an overestimation of the hygroscopic growth of these less-hygroscopic particles.
The hygroscopic growth for less-hygroscopic particles sharply increased from 75% to 90% RH (Fig. 11). This implies that the soluble fraction of the particles were not 10
only inorganic salts. One reason for the sharp increase in hygroscopic growth from 75 to 90% RH of less-hygroscopic particles might be the complex chemical composition during time periods that were influenced by continental air masses. Beside having a high EC concentration mixed with soluble material, these particles might also contain organic material, which might influence the growth process. The OC concentration was 15
0.28 (Aerosols99) and 0.81 µg/m3(INDOEX) for sub-µm particles during the time peri-ods 4 and 9 (Table 1). Saxena et al. (1995) found that for aged, nonurban air masses, organics contribute to the water uptake by inorganics, although the mechanism is not well understood.
4.6. Solubility 20
All calculations of soluble particle volume fractions were done using the hygroscopicity data at 90% RH and only for those time periods when the molar fraction of ammonium ions and sulfate ions was higher than 75% (Fig. 2), because chemical components except ammonium and sulfate were not considered in the model. Therefore, calcu-lations for 250-nm particles during Aerosols99 are not presented here, because the 25
molar fraction of ammonium ions and sulfate ions often was smaller than 75% for 184
ob-ACPD
3, 135–185, 2003 Hygroscopic properties of different aerosol types A. Maßling et al. Title Page Abstract Introduction Conclusions References Tables Figures J I J I Back CloseFull Screen / Esc
Print Version Interactive Discussion
c
EGU 2003 served and empirical growth factors of the particles. Therefore, the estimated relative
uncertainty in the soluble particle volume fractions was smaller than 20%.
Figure 12 shows the calculated soluble volume fractions for 50-, 150-, and 250-nm particles for the three different particle fractions (more-hygroscopic, less-hygroscopic, nearly hydrophobic). In general, the Aitken mode particles (Dp = 50 nm) had the 5
smallest soluble volume fractions. The accumulation mode particles (Dp= 150 and 250 nm) probably resided longer in the atmosphere as Aitken mode particles, and therefore might have accumulated soluble material by condensation and/or cloud pro-cessing, thus increasing the soluble/insoluble mass ratio (Svenningsson et al., 1997). The average calculated soluble particle volume fractions of the different time periods 10
and particle groups are listed in the Appendix (Table 10).
For accumulation mode particles (150-nm and 250-nm particles), the smallest solu-ble volume fractions of more-hygroscopic particles and less-hygroscopic particles were detected during time period 9 (Indian Subcontinent air mass and directly to the ship, INDOEX, Fig. 12, DOY 63.5–66.5). The average soluble volume fraction for the more-15
hygroscopic particle group was 72% (150-nm) and 95% (250-nm), whereas that for less-hygroscopic particles was 37% (150-nm) and 50% (250-nm). Based on the chem-ical data, time period 9 was marked by extremely high mass concentrations of EC in the sub-µm size range, agreeing with the solubility calculations for this Indian Subcontinent aerosol type.
20
These solubility results reflect the general findings from the First Aerosol Character-ization Experiment (ACE 1). Berg et al. (1998) reported an increase in solubility with increasing particle diameter. They also reported estimated soluble volume fractions of 89% for 35-nm particles, 92% for 50-nm particles, and 107% for 150-nm particles in clean marine air masses over the Southern Ocean, and a slight decrease in solubility 25
for polluted air masses.
Nearly hydrophobic particles for all particle sizes were detected only in time period 9 (Indian Subcontinent and directly to the ship, INDOEX, Fig. 12, DOY 63.5–66.5) with one exception. Two observations of nearly hydrophobic particles were made
dur-ACPD
3, 135–185, 2003 Hygroscopic properties of different aerosol types A. Maßling et al. Title Page Abstract Introduction Conclusions References Tables Figures J I J I Back CloseFull Screen / Esc
Print Version Interactive Discussion
c
EGU 2003 ing time period 10 (mixed: Indian Subcontinent and Middle East, INDOEX, Fig. 12,
DOY 67–68, 70.6–76) for 150-nm particles. Soluble particle volume fractions of nearly hydrophobic particles averaged less than 25%, indicating that these particles were composed of high amounts of insoluble material, assuming the EC concentration de-termined in the chemical analysis. Because these particles are known to be emitted 5
over the Indian Subcontinent, they had only resided for one or two days in the at-mosphere before reaching the ship (based on back-trajectory analysis), resulting in a lower probability for condensational growth processes or cloud processing.
5. Conclusions
Hygroscopic properties of aerosol particles were determined during two field studies, 10
Aerosols99 (Atlantic Ocean) and INDOEX (Indian Ocean), on the U.S. Research Ves-sel Ronald H. Brown and were compared to concurrently measured chemical and op-tical properties of the particles. The Aerosols99 field study covered the Northern and Southern Hemisphere portions of the Atlantic Ocean, whereas the INDOEX field study covered both hemispheres of the Indian Ocean. During Aerosols99, marine air masses 15
originating from the northern and southern Atlantic Ocean and air masses continentally influenced by the Sahara Desert or biomass burning from western Africa were encoun-tered. During INDOEX, clean marine air masses that had no land contact for five to six days originating in the Indian Ocean as well as polluted air masses having crossed the Indian Subcontinent or Arabia were encountered. The field studies involved a total of 20
13 consecutive time periods, ranging from one to six days each.
Hygroscopic properties were measured using an HTDMA system for particles with initial dry sizes (Dp) of 50, 150, and 250 nm and at relative humidities (RH) of 30, 55, 75, and 90%. Three different types of hygroscopic growth (more-hygroscopic, less-hygroscopic, nearly hydrophobic) could be distinguished at 90% RH, whereas just two 25
groups could be distinguished at 75% RH and one type of hygroscopic growth at 30 and 55% RH. The aerosol chemistry together with measured 90% RH hygroscopicity data
ACPD
3, 135–185, 2003 Hygroscopic properties of different aerosol types A. Maßling et al. Title Page Abstract Introduction Conclusions References Tables Figures J I J I Back CloseFull Screen / Esc
Print Version Interactive Discussion
c
EGU 2003 observed during Aerosols99 and INDOEX was used as input parameters to a solubility
model. To estimate soluble volume fractions of the particles, the model assumed that the particles consisted of an inner insoluble core coated with soluble material.
A key finding is that clean marine air masses could clearly be distinguished from strongly polluted air masses by taking into account only the hygroscopic character-5
istics that identify the occurrence of different hygroscopicity modes, the hygroscopic growth factors of these modes, their number fractions and their solubility. Another find-ing is that marine air masses that had passed over a continent several days before reaching the ship, showed significant differences in these parameters, compared with clean marine air masses.
10
In general, relatively high growth factors of more-hygroscopic particle fractions corre-spond well with the measured chemical inorganic composition. For most time periods, ammonium ions and sulfate ions dominated the molar distribution, signifying that the major inorganic compounds were hygroscopically active material, such as ammonium sulfate, ammonium bisulfate, and sulfuric acid.
15
The growth factors for the more-hygroscopic particle mode decreased slightly for ac-cumulation mode particles (150-nm and 250-nm particles) during time periods when highly anthropogenically influenced air masses were encountered. However, this de-crease was much more significant for growth factors measured at lower RH (30 and 55%), rather than at higher RH (75 and 90%). The hygroscopicity data obtained at 30, 20
55, 75 and 90% RH were used to parameterize the growth factors of more-hygroscopic particles as a function of RH. This parameterization reflects the general relationship that differences in growth factors due to changes in air mass are more pronounced at lower RH (≤ 55%).
Continentally influenced air masses showed a strong increase in aerosol mass, 25
which also corresponded with rather high amounts of carbonaceous material. In gen-eral, this occurrence of carbonaceous material was correlated with the increase in light absorption coefficient and with the occurrence of less-hygroscopic and nearly hy-drophobic particle fractions in the hygroscopic growth distributions.
ACPD
3, 135–185, 2003 Hygroscopic properties of different aerosol types A. Maßling et al. Title Page Abstract Introduction Conclusions References Tables Figures J I J I Back CloseFull Screen / Esc
Print Version Interactive Discussion
c
EGU 2003 Although more-hygroscopic particles with relatively high growth factors were always
detected (regardless of air mass), less-hygroscopic particle groups were only detected during those time periods when continentally influenced air masses prevailed. Further-more, growth factors of this particle group were generally greater for INDOEX (Indian Ocean) than for Aerosols99 (Atlantic Ocean), which can be explained by different aging 5
times during transport of the particles. Continentally influenced air masses were en-countered more frequently during INDOEX than during Aerosols99, resulting in more frequent observations of less-hygroscopic particles.
A nearly hydrophobic particle group appeared with growth factors between 1.16 and 1.36, depending on the particle size. The occurrence of these nearly hydrophobic 10
particles indicates a high anthropogenic influence. Air-mass back-trajectories showed a transport time between 12 and 36 h between the continent and the ship for this time period. Furthermore, the maximum concentration of elemental carbon during both cruises occurred during this time period.
The number fractions of less-hygroscopic particles ranged from few percent up val-15
ues higher than 60% depending on dry particle size and air mass type. In general, the highest number fractions were found for the biomass burning air mass and for the continentally influenced Subcontinent air mass indicating high anthropogenic influence. Less-hygroscopic particles showed a sharp increase in hygroscopic growth factor from 75% to 90% RH. One reason for this increase might be the presence of organic 20
material, which supposedly shows different hygroscopic growth than that of inorganic salts (Saxena et al., 1995).
The calculation of soluble volume fractions of aerosol particles (by using the model) shows that the solubility increased with increasing particle diameter. The reason might be that particles with larger diameters resided longer in the atmosphere, resulting in 25
particles being modified by condensation and cloud processing, which in turn increases the soluble/insoluble mass ratio. However, less-hygroscopic particles show soluble vol-ume fractions that indicate that these particles were composed of both soluble and insoluble material. This mixture suggests that these particles were emitted by
anthro-ACPD
3, 135–185, 2003 Hygroscopic properties of different aerosol types A. Maßling et al. Title Page Abstract Introduction Conclusions References Tables Figures J I J I Back CloseFull Screen / Esc
Print Version Interactive Discussion
c
EGU 2003 pogenic sources and altered during their transport between the continent and the ship.
Furthermore, this result indicates that aging processes play a major role in hygroscopic properties of aerosol particles and their effect on climate. Nearly hydrophobic particles with soluble volume fractions up to 25% were detected only during one time period, when the transport time was the shortest between the sources and the ship.
5
Acknowledgement. We are grateful for the support and cooperation of the NOAA PMEL group,
who gave us the opportunity to participate in these two field studies. We also thank the par-ticipants of the cruise from the University of Washington and PMEL for the brilliant teamwork during and after the cruise.
This work was supported by the “Bundesministerium f ¨ur Bildung, Wissenschaft, Forschung und
10
Technik” (BMBF), under the project title “Schließungs- und Charakterisierungs-Experiment am anthropogen beeinflußten Aerosol ¨uber dem Indischen Ozean”, and project-number 01 LA-9830/0.
References
Bates, T. S., Quinn, P. K., Coffman, D. J., Johnson, J. E., Miller, T. L., Covert, D. S.,
Wieden-15
sohler, A., Leinert, S., Nowak, A., and Neus ¨uß, C.: Regional physical and chemical proper-ties of the marine boundary layer aerosol across the Atlantic during Aerosols99: An overview, J. Geophys. Res., 106, 20767–20782, 2001.
Berg, H. O., Swietlicki, E., and Krejci, R.: Hygroscopic growth of aerosol particles in the marine boundary layer over the Pacific and Southern Oceans during the First Aerosol
Characteriza-20
tion Experiment (ACE 1), J. Geophys. Res., 103, 16535–16545, 1998.
Berner, A., Lurzer, C., Pohl, F., Preining, O., and Wagner, P.: The size distribution of the urban aerosol in Vienna, Sci. Total Environ., 13, 245–261, 1979.
Charlson, R. J., Lovelock, J. E., Andreae, M. O., and Warren, S. G.: Oceanic phytoplankton, atmospheric sulphur, cloud albedo and climate, Nature, 326, 655–661, 1987.
25
Charlson, R. J., Schwartz, S. E., Hales, J. M., Cess, R. D., Coakley jr., J. A., Hansen, J. E., and Hofmann, D. J.: Climate forcing by anthropogenic aerosols, Science, 255, 423–430, 1992. Hildemann, L. M., Markowski, G. R., Jones, M. C., and Cass, J. R.: Submicrometer aerosol
ACPD
3, 135–185, 2003 Hygroscopic properties of different aerosol types A. Maßling et al. Title Page Abstract Introduction Conclusions References Tables Figures J I J I Back CloseFull Screen / Esc
Print Version Interactive Discussion
c
EGU 2003 size distributions of emissions from boilers, fireplaces, automobiles, diesel trucks, and
meat-cooking operations, Aerosol Sci. Technol., 14, 138–152, 1991.
Houghton, J. T., Ding, Y., Griggs, D. J., Noguer, M., van der Linden, P. J., and Xiaosu, D.: IPCC: Climate change 2001: The Scientific Basis, Cambridge University Press, 2001.
Kulmala, M., Korhonen, P., Vesala, T., Hansson, H. C., Noone, K., and Svenningsson, B.: The
5
effect of hygroscopicity on cloud droplet formation, Tellus, 48B, 347–360, 1996.
Liu, B. Y. H., Pui, D. Y. H., Whitby, K. T., Kittelson, D. B., Kousaka, Y., and McKenzie, R. L.: The aerosol mobility chromatograph: a new detector for sulfuric acid aerosols, Atmos. Environ., 12, 99–104, 1978.
Maricq, M. M., Podsiadlik, D. H., and Chase, R. E.: Gasoline vehicle particle size distributions:
10
comparison of steady state, FTP and US06 measurements, Environ. Sci. Technol., 33, 2007– 2015, 1999.
McMurry, P. H. and Stolzenburg, M. R.: On the sensitivity of particle size to relative humidity for Los Angeles aerosols, Atmos. Environ., 23, 497–507, 1989.
Neus ¨uß, C., Gnauk, T., Plewka, A., Herrmann, H., and Quinn, P. K.: Carbonaceous aerosol
15
over the Indian Ocean: OC/EC fractions and selected specifications from size-segregated samplels, J. Geophys. Res., 107, D19, 2002.
Ogren, J. A. and Charlson, R. J.: Implications for models and measurements of chemical inho-mogeneities among cloud droplets, Tellus, 44B, 489–504, 1992.
Philip, J. S., Liu, D. Y., Noble, C. A., and Prather, K. A.: Size and chemical characterization
20
of individual particles resulting from biomass burning of local Southern California species, Environ. Sci. Technol., 33, 18, 3068–3076, 1999.
Quinn, P. K., Coffman, D. J., Kapustin, V. N., Bates, T. S., and Covert, D. S.: Aerosol optical properties in the marine boundary layer during ACE 1 and the underlying chemical and physical aerosol properties, J. Geophys. Res., 103, 16547–16563, 1998.
25
Quinn, P. K., Coffman, D. J., Bates, T. S., Miller, T. L., Johnson, J. E., Voss, K., Welton, E. J., and Neus ¨uß, C.: Dominant aerosol chemical components and their contribution to extinc-tion during the Aerosols99 cruise across the Atlantic, J. Geophys. Res., 106, 20783–20810, 2001.
Quinn, P. K., Coffman, D. J., Bates, T. S., Miller, T. L., Johnson, J. E., Welton, E. J., Neus¨uß,
30
C., Miller, M., and Sheridan, P. J.: Aerosol optical properties during INDOEX 1999: Means, Variability, and controlling factors, J. Geophys. Res., 107, D19, 2002.
supermi-ACPD
3, 135–185, 2003 Hygroscopic properties of different aerosol types A. Maßling et al. Title Page Abstract Introduction Conclusions References Tables Figures J I J I Back CloseFull Screen / Esc
Print Version Interactive Discussion
c
EGU 2003 crometer particulate emissions from spark ignition vehicles, Environ. Sci. Technol., 32, 24,
3845–3852, 1998.
Saxena, P., Hildemann, L. M., McMurry, P. H., and Seinfeld, J. H.: Organics alter hygroscopic behavior of atmospheric particles, J. Geophys. Res., 100, D9, 18755–18770, 1995.
Seinfeld, J. H. and Pandis, S. N.: Atmospheric chemistry and physics: From air pollution to
5
climate change, Wiley & Sons Inc., New York, 508, 1998.
Svenningsson, B., Hansson, H. C., Wiedensohler, A., Ogren, J. A., Noone, K. J., and Hallberg, A.: Hygroscopic growth of aerosol particles in the Po Valley, Tellus, 44B, 556–569, 1992. Svenningsson, B., Hansson, H. C., Martinsson, B., Wiedensohler, A., Swietlicki, E., Cederfelt,
S.-I., Wendisch, M., Bower, K. N., Choularton, T. W., and Colvile, R. N.: Cloud droplet
10
nucleation scavenging in relation to the size and hygroscopic behavior of aerosol particles, Atmos. Environ., 31, 6, 2463–2475, 1997.
Swietlicki, E., Zhou, J., Berg, O. H., Martinsson, B. G., Frank, G., Cederfelt, S. I., Dusek, U., Berner, A., Birmili, W., Wiedensohler, A., Yuskiewicz, B., and Bower, K. N.: A closure study of sub-micrometer aerosol particle hygroscopic behavior, Atmos. Research, 50, 205–240,
15
1999.
Swietlicki, E., Zhou, J. et al.: Hygroscopic properties of aerosol particles in the eastern Northern Atlantic during ACE-2, Tellus, 52B, 201–227, 2000.
Taylor, J. P. and McHaffie, A.: Measurements of Cloud Susceptibility, J. Atmos. Sci., 51, 10, 1298–1306, 1993.
20
Twomey, S.: Pollution and planetary albedo, Atmos. Environ., 8, 1251–1256, 1974. Twomey, S.: Atmospheric aerosols, Elsevier, New York, 279–287, 1977.
Voutilainen, A., Stratmann, F., and Kaipio, J. P.: A non-homogenous regularization method for the estimation of narrow aerosol size distribution, J. Aerosol Sci., 31, 12, 1433–1445, 2000. Wehner, B., Bond, T. C., Birmili, W., Heintzenberg, J., Wiedensohler, A., and Charlson, R. J.:
25
Climate-relevant particulate emission characteristics of a coal fired heating plant, Environ. Sci. Technol., 33, 3881–3886, 1999.