HAL Id: hal-01068129
https://hal.archives-ouvertes.fr/hal-01068129
Submitted on 25 Sep 2014
HAL is a multi-disciplinary open access
archive for the deposit and dissemination of
sci-entific research documents, whether they are
pub-lished or not. The documents may come from
teaching and research institutions in France or
abroad, or from public or private research centers.
L’archive ouverte pluridisciplinaire HAL, est
destinée au dépôt et à la diffusion de documents
scientifiques de niveau recherche, publiés ou non,
émanant des établissements d’enseignement et de
recherche français ou étrangers, des laboratoires
publics ou privés.
The detection of counterfeit integrated circuit by the use
of electromagnetic fingerprint
He Huang, Alexandre Boyer, Sonia Ben Dhia
To cite this version:
He Huang, Alexandre Boyer, Sonia Ben Dhia. The detection of counterfeit integrated circuit by
the use of electromagnetic fingerprint. EMC Europe 2014, Sep 2014, Gothenburg, Sweden. pp.1-5.
�hal-01068129�
The detection of counterfeit integrated circuit by the
use of electromagnetic fingerprint
H. Huang
1,2, A. Boyer
1,2, S. Ben Dhia
1,21CNRS, LAAS, 7 avenue du colonel Roche, F-31400 Toulouse, France
2
Univ. de Toulouse, INSA, LAAS, F-31400 Toulouse, France [email protected]
Abstract—This paper proposes a preliminary demonstration
of an alternative method of detection of counterfeit integrated devices, based on the « electromagnetic fingerprint » obtained by electromagnetic emission measurements. The principles of the methodology are explained. Two case studies are presented and two data analysis methods are discussed.
Index Terms—integrated circuit, counterfeit detection, electromagnetic emission
I. INTRODUCTION
A counterfeit electronic is a device whose material, performance, or characteristics are knowingly misrepresented by the vendor, supplier, distributor, or manufacturer [1]. This use of electronic counterfeits can cause reduced performance of circuits, such as instability of clock frequency, operating life decrease, a lower storage memory space, or failure of the whole system. In recent years, there is a growing number of reported incidents related to counterfeit integrated circuits (ICs) [2]. The most commonly counterfeited semiconductor types are analog ICs, microprocessors and memories [2]. The Alliance for Gray Market and Counterfeit Abatement estimates that nearly 10 percent of technological products sold in the global market are counterfeit, which represents about 100 billion dollars loss for the electronic companies every year [3].
Three major techniques exist to produce counterfeit circuits: re-marking components as a higher grade and more expensive chip, re-packaging old devices up to non-qualified components, and duplicating counterfeits through inferior parts or materials [4]. The struggle against this problem relies in a better management of the supply chain and the market [5], the development of advanced authentication methods (e.g. watermarking [6]) and serialization technologies (e.g. 2-D bar code [4]). Besides, industry always looks for non-destructive, rapid and cheap tests. A large number of detection techniques exist and are already used by industry and detection laboratories: visual inspection of the appearance of component (texture, mold mark, pitch form…) in order to detect raw counterfeit devices, decapsulation to verify the die layout, material analysis methods, like fluorescent X-ray or C-mode scanning acoustic microscope for package analysis, and different levels of electrical testing (V/I characteristics, ESD
test, operation life test…) [7]. The electrical tests are adapted to detect elaborated counterfeit devices. They consist in obtaining electrical signals of IC pads such as voltage/current/impedance profile and comparing the results to expected figures given by datasheets, or verifying the response to given vectors. However, this type of methods has some drawbacks. Firstly, the characterization of IC pads provides only information about the status of interfaces. Secondly, a large number of vectors and a good knowledge of circuit operation are required to perform electrical test.
Although there are lots of methods to detect counterfeit devices, most of them are destructive, and none can cover 100% of counterfeit types. Moreover, the detection methods have to evolve because the counterfeiting techniques may adapt to them. Furthermore, we need a large numbers of detection techniques to deal with the large number of counterfeiting possibilities.
The electromagnetic emission (EME), also called “electromagnetic fingerprint” in this article, is a contactless side channel related to the IC transient activity. It depends on numerous circuit parameters such as technology, placement and routing, embedded code, internal filtering, packaging, temperature, aging [8] [9]... Any modification of one of these parameters can lead to a significant change of the electromagnetic emission. This principle emerges as a new idea to detect counterfeit ICs [10] [11]. However, no demonstration of the feasibility of the method has been shown in literature. This paper aims at presenting a first study about the feasibility to distinguish authentic and different devices through electromagnetic emission measurements.
II. DESCRIPTION OF THE DETECTION METHODOLOGY
A. Principles of the method
A counterfeit component or circuit exhibits a different or degraded operation compared to the nominal behavior of the original device. The electromagnetic (EM) fingerprint is a parasitic electromagnetic signal produced by IC internal activity, measured in conducted and/or radiated mode, in given experimental conditions. The device under test could be a small active component, a complicated electronic system or whatever
electronic active device which can generate the electromagnetic emission.
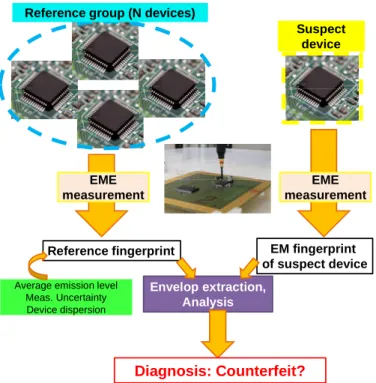
The detection test consists in comparing the EM fingerprint measured from a suspect test device and a reference fingerprint from good devices. The devices under test must be powered and set in a given configuration which induces at least a transient activity or current consumption. If all the measurements are done in similar conditions, any significant difference of the electromagnetic emission will indicate a difference between the devices. However, only one known good device is not enough to extract a reference fingerprint due to measurement errors and process dispersion. It is better that the reference fingerprint could include statistical information about the EM fingerprint of authentic devices, which can be extracted by the measurements of a number of known good devices. Fig. 1 details the different steps of the proposed method.
Reference group (N devices)
Suspect device EME measurement EME measurement
Reference fingerprint EM fingerprint
of suspect device
Envelop extraction, Analysis
Diagnosis: Counterfeit?
Average emission level Meas. Uncertainty Device dispersion
Figure 1. Description of the detection methodology
B. Electromagnetic measurements
The electromagnetic noise produced by the circuit activity can be coupled according to three modes: conducted mode, far-field radiated mode or near-far-field mode. The two last modes ensure contactless measurement. In addition, the near-field mode allows localization of the source of electromagnetic [12]. Proven methods for characterizing electromagnetic emissions from ICs between 150 KHz to 1 GHz are proposed by IEC 61967 standard [13], which is extensively used by IC manufacturers for electromagnetic compatibility qualification. The concepts, requirements and advices given by this standard can be followed. Besides, all the EME measurements do not damage the device under test, and the type of measurement could be chosen according to the device and the requirement of detecting application.
The measurement can be done in time domain with oscilloscopes or frequency domain with narrowband receivers such as spectrum analyzer (e.g. in this study a MS2667C portable spectrum analyzer of Anritsu is used). The measurement in the frequency domain outweighs the one in time domain by having a lower noise floor. Moreover, as transient current induced by circuit activity has an impulse nature, its spectrum covers a large frequency range. Therefore, in our two case studies more differences can be detected in frequency domain than in time domain. No matter which measurement method is chosen, the same measurement conditions for the different devices should be guaranteed.
C. Analysis method
The analysis of the emission spectrum measured in frequency domain is discussed in this paper. The amplitude measured at a finite number of frequencies M are stored in a vector E(k), k = [1;M]. If the circuit activity is periodic, the amplitude can be extracted at harmonic frequencies. The
reference fingerprint is noted EREF(k) and the fingerprint of the
suspect device under test (DUT) is noted EDUT(k). The
reference fingerprint EREF(k) contains the average emission
level measured at frequency k over the N reference samples. Only the points whose amplitude is larger than the noise floor are taken into account to minimize measurement errors. According to the work of [14], the distribution of their emission level around this average level is supposed to be
normal. The dispersion around the average level of EREF(k) in
frequency k linked to measurement uncertainties and process
differences is given in term of standard deviation
σ
REF(k),which can be obtained by the measurements of N reference samples of certain times (e.g. 5 times per reference sample).
Two basic statistical criteria are proposed for the analysis of the EM fingerprint between the reference and suspect devices. These two statistical methodologies are very simple and common for estimating the relationships among variables. The first criterion is called z-score (also called standard score) (1). For the different frequencies, this estimator gives the difference between the suspect device and reference fingerprints, divided
by the standard deviation of the reference fingerprint
σ
REF.For each frequency k, this figure provides an indication about the probability of differences between the suspect device and reference emission levels, so a z-core in frequency k close to 0 means that the emission levels of the two devices are similar in this frequency.
( )
( )
( )
( )
k
k
E
k
E
k
z
REF REF DUTσ
−
=
(1)The second and alternative criterion is the determination coefficient R² (2). In regression analysis, this topic relates to goodness of fit. It is computed over a group of frequencies (from frequency i to frequency j). This coefficient determines whether a linear relation exists between suspect device and
reference device fingerprints. The interval of the value of R2 is
[0, 1], a determination coefficient close to 1 indicates a strong linear relation between suspect device and reference fingerprints, and vice versa.
( )
(
( )
( )
)
( ) ( ) 2 : : 2 : , : : ⋅ = j i E j i E DUT REF REF REF j i E j i E Cov j i Rσ
σ
(2)Where, Cov is the covariance of the reference vector and
the DUT vector, and
σ
is the standard deviation of these twovectors respectively.
Like all the other statistical methodologies, these two criteria that we choose in this study cannot represent all the relationships between the DUT and the reference, but as the preliminary analysis, they are effectual to identifier the differences related to the counterfeits.
III. CASY STUDY I:DISTINCTION BETWEEN COMPONENTS WITH TECHNOLOGICAL DIFFERENCES
A. Case study presentation
As buying certified counterfeit circuits is uncertain, the proposed study is done on "simulated counterfeit devices", i.e. with known small technological differences or stressed devices representing two large kinds of counterfeits in the electronic product market.
A digital circuit has been designed in CMOS 0.25 µm process. As resumed in Table I, the reference electromagnetic fingerprint is obtained from a group of 9 authentic circuits designed in the same technology. The reference devices are called Core0(ref). Nine other components are set to be the suspect components under test. One component called Auth0 is designed with the same technology as the device of the reference group and is randomly chosen to verify whether its EM fingerprint can be identified as similar to the reference fingerprint. Eight other components under test used a similar technology which differs from the amount of distributed capacitor and substrate isolation. They are called Core1 (from Core1-1 to Core1-8). Their electromagnetic emissions are measured and compared to the reference fingerprint in order to verify whether they can be separated from the reference devices.
TABLE I. IDENTIFICATION OF DEVICES OF CASY STUDY I
Group name Reference group Suspect group
Identity Core0 (ref) Auth0 Core1-1 ~ Core1-8 Number 9 1 8 Technology Technology Core0 Technology Core1
B. Comparison of emission level
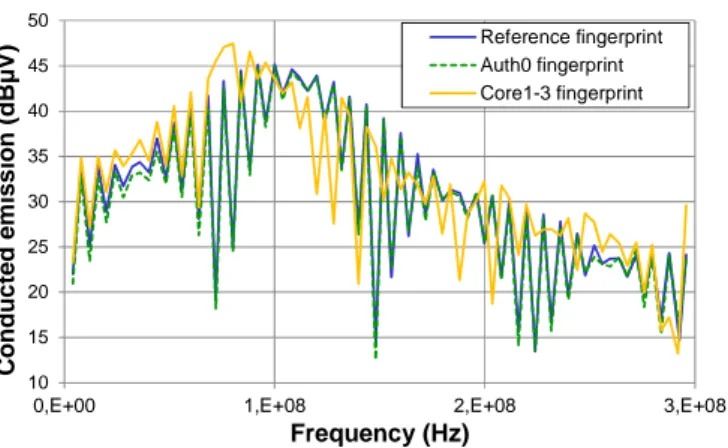
Conducted emission test have been chosen in this case study. The transient current that returns to the ground is measured by the use of a 1 Ω resistor probe, as the 1 Ω direct coupling method detailed in the standard 61967-4 [13]. Since the emission becomes negligible above 300 MHz, the measurements are performed from 150 KHz up to 300 MHz. The fundamental frequency of emission is 4 MHz, Fig. 2 compares the reference fingerprint with the EM emission of one Core1 and Auth0 devices. The general shapes of the three spectra are similar and, in spite of small differences between
these different devices, it is difficult to conclude about the differences between the three samples. Only statistical analysis can provide a more precise conclusion by revealing differences or correlations between EM fingerprints.
10 15 20 25 30 35 40 45 50
0,E+00 1,E+08 2,E+08 3,E+08
C o n d u c te d e m is s io n ( d B µ V ) Frequency (Hz) Reference fingerprint Auth0 fingerprint Core1-3 fingerprint
Figure 2. Comparison between reference (Core0), Auth0 and Core1-3 fingerprints
C. Analysis of the differences
The two statistical criteria (1) and (2) are applied on the different suspect samples with the reference devices. Fig. 3 compares the z-score of one Core1 sample and Auth0. The result reveals that a huge difference exists between the fingerprint of Core1-3 and Core0 over all the considered frequency range. The highest z-score reaches more than 60
times the standard deviation of the reference fingerprint SREF,
and the average difference is 8.75 times SREF. The probability
for this Core1 device to have a similar EM fingerprint as the reference devices is very small. In contrast, the difference between Auth0 fingerprint and the reference fingerprint does
not exceed 2 times SREF and its average value is about one
standard deviation. It is unlikely that Auth0 and reference devices have different EM fingerprints.
0 10 20 30 40 50 60 70
0,E+00 1,E+08 2,E+08 3,E+08
Z -s c o re ( × σ ) Frequency (Hz) Auth0 (z-score_avg = 1.01) Core1-3 (z-score_avg=8.75)
Figure 3. Comparison of z-score between Auth0 and Core1-3 fingerprint
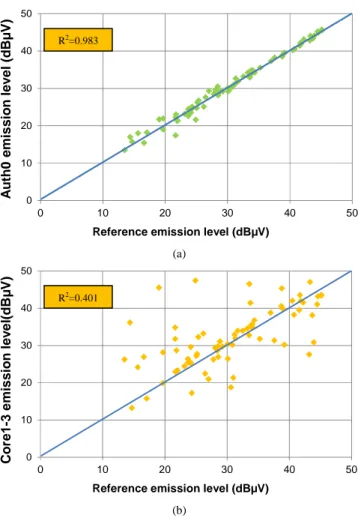
Fig. 4 presents a scatterplot between the emission levels of the reference and the tested devices (Auth0 and Core1-3). A clear linear relation exists between Auth0 and reference group emission levels. This is underlined by a determination coefficient very close to 1. The small differences are due to measurement errors and process dispersion. In contrast, the linear relation between Core1 and reference levels is not so obvious, as demonstrated by the lower value of R².
0 10 20 30 40 50 0 10 20 30 40 50 A u th 0 e m is s io n l e v e l (d B µ V )
Reference emission level (dBµV)
(a) 0 10 20 30 40 50 0 10 20 30 40 50 C o re 1 -3 e m is s io n l e v e l( d B µ V )
Reference emission level (dBµV)
(b)
Figure 4. Scatterplot of Auth0 (a) and Core1-3 (b) emission levels vs. reference emission level
Analyses on the other devices provide similar results, as shown in Fig. 5. The average z-scores and determination coefficients measured with each Core1 devices show large differences with reference devices, which indicate that their EM fingerprints are not correlated to the reference fingerprint due to their internal differences. Auth0 EM fingerprint presents similar statistical properties to the reference fingerprint. This result reveals that design differences such as those brought in Core1 induces significant changes in the EM fingerprint. These differences can be detected from electromagnetic measurements between circuits.
0 2 4 6 8 10 12 C o re 0 ( re f) C o re 0 ( re f) C o re 0 ( re f) A u th 0 C o re 1 1 C o re 1 2 C o re 1 3 C o re 1 4 C o re 1 5 C o re 1 6 C o re 1 7 C o re 1 8 A v e ra g e Z -s c o re ( × σ ) (a) 0,2 0,3 0,4 0,5 0,6 0,7 0,8 0,9 1 C o re 0 ( re f) C o re 0 ( re f) C o re 0 ( re f) A u th 0 C o re 1 1 C o re 1 2 C o re 1 3 C o re 1 4 C o re 1 5 C o re 1 6 C o re 1 7 C o re 1 8 D e te rm in a ti o n c o e ff ic ie n t R ² (b)
Figure 5. Comparison of statistical analysis results between reference, Auth0 and Core1 devices: Average Z-score (a), Determination coefficient (b)
IV. CASE STUDY II:DISTINCTION BETWEEN AUTHENTIC AND STRESSED COMPONENTS
A. Case study presentation
Recent publications have shown that IC aging provokes a change of electromagnetic emission profile [9]. Degradation mechanisms accelerated by harsh conditions such as Negative Bias Temperature Instability or Hot Carrier Injection induce a spread of the transient current due to IC activity. One source of counterfeit devices is related to the reuse of non-qualified and recycled old devices. This part aims at demonstrating that the comparison of the EM fingerprints of a group of reference components with a same but aged device can provide a detection method.
In this case study, Core0 components are reused, except that they have been submitted to stress conditions according to High Temperature Operating Life (HTOL) test [15]. During 408 hours, the samples have been powered under high temperature conditions (150°c). Before and after the accelerated-life test, the same conducted electromagnetic emission test of the previous case study is employed. The reference group is constituted by the fresh components. After aging the components are still functional and a little variation of the emission level is observed, as shown in Fig. 6.
10 15 20 25 30 35 40 45 50
0,E+00 1,E+08 2,E+08 3,E+08
C o n d u c te d e m is s io n ( d B µ V ) Frequency (Hz) Reference fingerprint Core0-1(fresh) fingerprint Core0-1(aged) fingerprint
Figure 6. Comparison between reference (Core0), Core0-1 (fresh) and Core0-1 (aged) fingerprints
R2=0.983
B. Analysis of differences
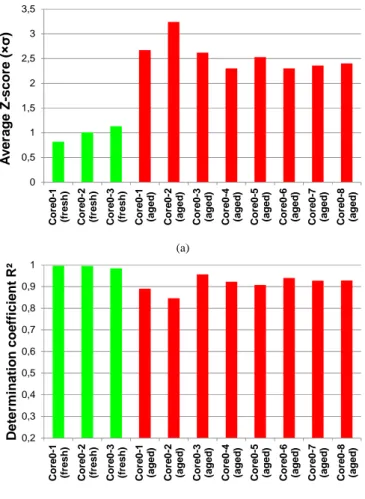
The two statistical criteria defined in II.C have been applied on the measured emission results. Fig. 7 presents the summary of statistical analysis done on the fresh and aged Core0 samples. The average z-score shows that the average emission level differences between aged components and reference group are at least two times larger than the fresh samples. Moreover, the linearity of the relation between the reference fingerprint and the devices fingerprint of tends to degrade after the accelerated aging. Although these differences are less significant than these in the last case study, the result of this study reveals that the aging of circuit can induce detectable changes in the EM fingerprint.
0 0,5 1 1,5 2 2,5 3 3,5 C o re 0 -1 (f re s h ) C o re 0 -2 (f re s h ) C o re 0 -3 (f re s h ) C o re 0 -1 (a g e d ) C o re 0 -2 (a g e d ) C o re 0 -3 (a g e d ) C o re 0 -4 (a g e d ) C o re 0 -5 (a g e d ) C o re 0 -6 (a g e d ) C o re 0 -7 (a g e d ) C o re 0 -8 (a g e d ) A v e ra g e Z -s c o re ( × σ ) (a) 0,2 0,3 0,4 0,5 0,6 0,7 0,8 0,9 1 C o re 0 -1 (f re s h ) C o re 0 -2 (f re s h ) C o re 0 -3 (f re s h ) C o re 0 -1 (a g e d ) C o re 0 -2 (a g e d ) C o re 0 -3 (a g e d ) C o re 0 -4 (a g e d ) C o re 0 -5 (a g e d ) C o re 0 -6 (a g e d ) C o re 0 -7 (a g e d ) C o re 0 -8 (a g e d ) D e te rm in a ti o n c o e ff ic ie n t R ² (b)
Figure 7. Comparison of statistical analysis results between fresh and aged Core0 devices: Average Z-score (a), Determination coefficient (b)
V. CONCLUSION
This paper has proposed a preliminary demonstration of an alternative method dedicated to the analysis of traceability of integrated devices, based on a measurement of the « electromagnetic fingerprint » of a circuit. The presented results have shown that significant changes in the electromagnetic fingerprint of a circuit can be measured when some modifications of the original design are provided or when it is submitted to an accelerated-aging test. Conducted measurements have been leaded to extract the electromagnetic fingerprint in the case studies of this paper, and several parallel
tests applied on other circuits with radiated or near-field measurement methods have provided positive results. More studies are required to evaluate the robustness of the method and to compare the advantages and drawbacks with other detection techniques. Also, improvements have to be made to increase the speed of measurements (parallel tests, rapid analyzer, compromise between measurement accuracy, noise floor and measurement time).
[1] H. Livingston, “Avoiding Counterfeit Electronic Components”, IEEE Transactions on Components and Packaging Technologies, Vol. 30, No. 1, pp. 187-189, March 2007.
[2] U.S. Department of Commerce (Bureau of industry and security, Office of technology evaluation), “Defense Industrial Base Assessment: Counterfeit Electronics”, January 2010.
[3] M. Pecht, S. Tiku, “Bogus: Electronic manufacturing and consumers confront a rising of counterfeit electronics”, IEEE Spectrum, Vol.34, No. 5, pp. 37-46, May 2006.
[4] S. Bastia, “Next Generation Technologies to Combat Counterfeiting of electronic components”, IEEE Transactions on Components and Packaging Technologies, Vol. 25, No. 1, pp. 175-176, Mar 2002 [5] F.E. McFadden, R. D. Arnold, “Supply Chain Risk Mitigation for IT
Electronics”, IEEE International Conference on Technologies for Homeland Security, 2010.
[6] F. Koushanfar and al., “Can EDA combat the rise of electronic counterfeiting?”, 49th Design Automation Conference, June 3-7 2012. [7] H. W. Hewett, “Methods used in the detection of counterfeit electronic
components”, SMTA International Conference, October 2010.
[8] J.P. Muccioli et al., “Characterization of the RF Emissions from a Family of Microprocessors Using a 1 GHz TEM Cell”, IEEE Symposium on EMC, 1998.
[9] S. Ben Dhia, A. Boyer, B. Li, A. C. Noye, “Characterization of the Electromagnetic Modelling drifts of a nanoscale IC after Accelerated Life Tests”, Electronic Letters, Vol. 46, No. 4, pp. 278-279, 18th
February 2010.
[10] K. Gross, R.C. Dhankula, A.J. Lewis, “Detecting counterfeit electronic components using EMI telemetric fingerprints”, US Patent Application US 2009/009830 A1, 2009.
[11] W.J. Keller, S.D. Freeman, “System and method for physically detecting counterfeit electronics”, US Patent Application, 20120226463, September 2012.
[12] K. Slattery, W. Cui, “Measuring the electric and magnetic near fields in VLSI devices”, IEEE Symposium on EMC, August 1999.
[13] IEC 61967, “Integrated circuits - Measurement of electromagnetic emissions, 150 kHz to 1 GHz”, IEC, Geneva, Switzerland, 2006. [14] These de binghong
[15] AEC-Q100-Rev-FAutomotive Electronics Council, Component Technical Committee, Stress test qualification for integrated circuits, 2003.