Publisher’s version / Version de l'éditeur:
Journal of Thermal Insulation, 10, pp. 270-285, 1987-04
READ THESE TERMS AND CONDITIONS CAREFULLY BEFORE USING THIS WEBSITE. https://nrc-publications.canada.ca/eng/copyright
Vous avez des questions? Nous pouvons vous aider. Pour communiquer directement avec un auteur, consultez la première page de la revue dans laquelle son article a été publié afin de trouver ses coordonnées. Si vous n’arrivez pas à les repérer, communiquez avec nous à PublicationsArchive-ArchivesPublications@nrc-cnrc.gc.ca.
Questions? Contact the NRC Publications Archive team at
PublicationsArchive-ArchivesPublications@nrc-cnrc.gc.ca. If you wish to email the authors directly, please see the first page of the publication for their contact information.
NRC Publications Archive
Archives des publications du CNRC
This publication could be one of several versions: author’s original, accepted manuscript or the publisher’s version. / La version de cette publication peut être l’une des suivantes : la version prépublication de l’auteur, la version acceptée du manuscrit ou la version de l’éditeur.
Access and use of this website and the material on it are subject to the Terms and Conditions set forth at
Measured soil thermal conductivities and modified design curves for
predicting frost penetration adjacent to insulated foundations
Figley, D. A.; Snodgrass, L. J.
https://publications-cnrc.canada.ca/fra/droits
L’accès à ce site Web et l’utilisation de son contenu sont assujettis aux conditions présentées dans le site LISEZ CES CONDITIONS ATTENTIVEMENT AVANT D’UTILISER CE SITE WEB.
NRC Publications Record / Notice d'Archives des publications de CNRC:
https://nrc-publications.canada.ca/eng/view/object/?id=ca738841-1af8-4d95-8719-2a4d50ba3d67 https://publications-cnrc.canada.ca/fra/voir/objet/?id=ca738841-1af8-4d95-8719-2a4d50ba3d67Ser
TH1 National Research ConseH national
B a l d
$1
Council Canada de recherche8 Canadano.
1545
c . 2 1 Institute for lnstitut de
BLDG
Research in recherche en,
. Construction construction
Measured Soil Thermal
Conductivities and Modified
Design Curves for Predicting
Frost Penetration Adjacent to
insulated Foundations
by D.A. Figley and C.J. Snodgrass
Reprinted from
Journal of Thermal Insulation Vol. 10, April 1987
p. 270-285
(IRC Paper No. 1545)
NRCC 291 18
NRC C I S n
F
I R C
,I
Pour hriter Its probl&mts dkoulant du souIkvemeat dn sel dii au gel,
il
faut disposer dc &thoties de pevision de la ptntiration du gel Iofsque Ics fondations reposent sur des sols g6lifs.II
existe dcs rnkthodes graphiques permertant de pdvoir la @ndmtion du gel dans Iecas dcs fondations non chaufftes rnais pour ce qui est des fondations ehauffEes. Ies
donnkes de calcul mnt ds limitCcs. Lc degd d'isolation des fondations chauffets infiue suc 13 p n c de chaleur au profit du so1 cnvironnant, et donc sur la pmfondeur dc gtntmtion du gel.
Ce document fait etat de donndes sur la pCnCtration du gel et la conductivite du sol. m e s d s sur une longue p6riode. pour quatre fondations d'habitation chauffees typiques. On y pdsente les rapports graphiques (courbes de calcul modifikes) e n a les profondeurs et les indices de gel et on fait la cornparaison avec les conditions (absence de chauffage) en
Measured Soil Thermal Conductivities
and Modified Design Curves for
Predicting Frost Penetration Adjacent to
Insulated Foundations*
D. A.
FIGLEY AND L.J. SNODGRASS
Prairie Regional Station Institute for Research in Construction National Research Council of Canada Saskatoon, Saskatchewan S 7 N OW9
ABSTRACT
Methods for predicting frost penetrations are necessary when foundations are placed on frost susceptible soils if problems with frost heave are to be avoided. Graphical methods exist for predicting frost penetration for unheated foundations, however, design information for heated foundations is very limited. Insulation levels on heated foundations will affect the heat loss to the surrounding soil and hence the depth of frost penetration.
The paper presents long term measured frost penetration and soil conductivity data for four typical heated residential foundations. Graphical relationships (modified design curves) between frost depths and freezing indices are presented and compared with open field (unheated) conditions.
KEY WORDS
Frost, frost depth, soil, soil conductivity, foundation insulation, design curve.
INTRODUCTION
T
HE PROBLEMS ASSOCIATED with frozen soils around foundations are o f concern to building designers. When soils freeze to structures and then*This paper is a follow-up to a paper published in Volume 7, April 1984 of the Journal of Ther- mal Insulation.
Predicting Frost Penetration Adjacent to Insulated Foundations 273 undergo dimensional changes, substantial structural stresses can be imposed. This situation, known as adfreezing [I], can (in principle) be aggravated
when insulation is added to below grade heated structures. The reduction of the heat flow into the ground will cause a corresponding reduction in the temperature of the surrounding soil. A second situation (frost heave) can also develop if the frost depth increases to the point where freezing occurs under the foundation. If the soil expands upon freezing (frost susceptible soil) large uplifting forces can be applied to the foundation system [2].
If foundation designers are to avoid these problems, they require informa- tion about frost in soils surrounding foundations. When unheated founda- tions are involved, design curves can be used to predict the depth of frost penetration. These curves relate the depth of frost penetration to the air freezing index (cumulative OC days below freezing). The U.S. Corps of En- gineers produced one curve for predicting frost penetration based on soil temperature data from snow cleared airport runways [3] and this curve was
later modified by Brown [4] to incorporate additional data. Louie [5] has also reported design curves which account for various soil types and 0.3 m
of snow cover. These methods do not take into account specific soil proper- ties or site conditions but may represent the "worst case" situation for unheated soils.
Foundations for heated structures pose additional problems for designers since the depth of frost penetration will be further influenced by the amount of heat gained by the soil from the foundation. Heated foundations with various insulation configurations are common components of modern buildings. In particular, basement insulation has been adopted as a method for reducing heating energy requirements for residences. As insulation levels are increased, the surrounding soil temperatures will fall and frost penetra- tion depths will increase. In the case of very high insulation levels, frost penetration will approach the design curve presented by Brown.
The selection of the insulation system for a basement is governed by two basic criteria:
1) Determine the optimal thermal resistance based on comfort and
economic considerations.
2) Ensure that the installation of this insulation will not cause subsequent problems with adfreezing or frost heave. In frost susceptible soils, the most common solution is to prevent the soil from freezing.
The first criterion can be evaluated by comparing the energy cost of the below grade heat loss with the cost of the insulation system. Several simpli- fied methods are available [6,7] for calculating below grade heat losses. To date, the second criterion has been primarily investigated in theoretical stud- ies. Numerical techniques exist for calculating soil temperatures; however,
they require accurate data on foundation design, boundary conditions and material properties and behavior.
Moisture content, soil component conductivities, grain size distribution, density and temperature are all known to have an effect on the thermal con- ductivity of soils. In his comprehensive summary of the methods for calcu- lating soil thermal conductivity, Farouki [8] has shown that there is a wide variation in the predicted values based on these available methods. Further- more, all ofthese methods require detailed information on the moisture con- ditions within the soil (moisture content and distribution). Precipitation, surrounding trees and structures, temperature and surface cover are just some of the many factors that influence the soil moisture conditions around basements.
This report summarizes six years of frost penetration data measured around four residential foundations in Saskatoon, Saskatchewan. These data are compared with Brown's design curve and provide a method for esti- mating frost penetration adjacent to similar insulated foundations. The soil temperature and thermal conductivity data also comprise a data base that may be used by other researchers for comparison with analytical models. The basements had various insulation configurations and structural designs. An earlier paper [9] outlined specific site details and preliminary frost pene- tration data. Field measurements of the soil thermal conductivity were taken (at approximately two week intervals) from November, 1984 to October, 1985.
FOUNDATION DESCRIFTIONS
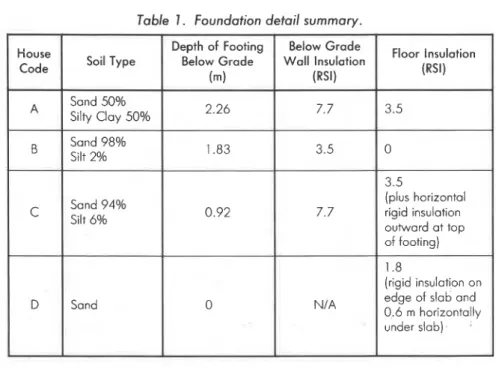
Houses A, B, and C are occupied, single-family residences with full base- ments. Houses A and C have electric resistance forced air heating systems, house B has a natural gas forced air furnace. Building D is a wood-framed single storey garagelworkshop with a natural gas forced air furnace. The foundation is a slab-on-grade, with a thickened edge to provide structural support and to accommodate a forced air duct. Specific house details are given in Table 1 and Figure 1. Detailed house descriptions can be found in Reference 9.
MEASUREMENT SYSTEMS
The soil temperatures at each site were measured on a two dimensional grid perpendicular to the foundation at approximately the mid point of a long straight wall (Figure 1). The temperatures were measured using 24 gauge type T (copper-constantan) thermocouples. The thermocouples were soldered and sealed with lacquer to prevent corrosion [lo]. They were in-
0.6 m horizontally
Predicting Frost Penetration Adjacent to Insulated Foundations 273
Table 1 . Foundation detail summary.
serted down 38 mm diameter augered holes and the holes were backfilled with existing soil. An additional thermocouple was installed at the inside wall surface of houses A and B. The temperatures were obtained using a DORIC model 477 digital thermocouple calibratorlindicator calibrated to within +0.3OC for the temperature range of +25OC to - 20°C. Soil tem- perature and snow cover measurements were taken on a monthly basis until October, 1983. Due to equipment failure, soil temperatures were not mea- suked during the winter of 1982-83. ..
Soil conductivity measurements [Ill were taken with NRC designed and calibrated thermal conductivity probes with accuracies of f 4'%. The probes are 0.5 m long, 3 mm diameter stainless steel rods with an internal heater and temperature measuring thermistor. Probes were installed horizontally, pcr- pendicular to the foundation (Figure 1). Field measurements were taken approximately every two weeks from November, 1984 to October, 198.5.
Grain size analyses were obtained from soil samples taken during thermo- couple installation (Table 1).
Atmospheric Environment Service weather records for the Saskatoon monitoring station [I21 were used to obtain the maximum dcpth of frost penetration in an open field under natural snow accumulation conditions.
The freezing index (FI) is defined as "the cumulative total of dcgrcc days of air temperature below freezing during the entire winter. The FI is calcu-
o
-
600 800 m o m m 0411 FIELD 0 400 000 I P O O r m P- .
S E C T I O N A - A.
.
SECTION A - A 0 2 4 6 1 K )-____.
PLAN V I E WPredicting Frost Penetration Adjacent to Insulated Foundations 275
lated using the mean daily temperatures with subtractions for days above freezing" [2].
The mean daily outdoor air temperatures for Saskatoon were taken from Environment Canada weather summaries [12].
Initially, natural snow cover was allowed to accumulate over the monitor- ing sites. For the winters of 1983-84 and 1984-85, snow was removed from
the sites and the surrounding area.
RESULTS Conductivity
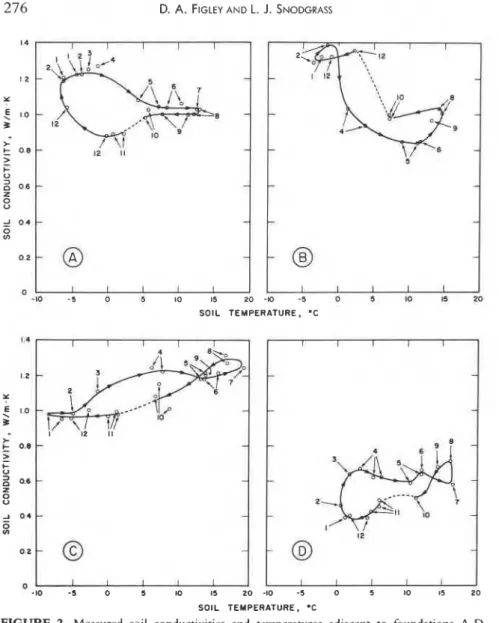
The measurements of the soil thermal conducitivity and surrounding soil temperature for each site are shown in Figure 2. The soil conductivities
show annual cyclic variations consistent with changes in temperature and moisture conditions. These observations are consistent with data from an earlier study by Goodrich [13] where long term measured data from four test sites is presented. Detailed discussions of the data for each site follow.
F O U N D A T I O N A
The thermal conductivity probe was located on the north side of the house; 0.86 m out from the foundation, 0.71 m below grade and 0.6 m west of the thermocouple field. In early November, 1984, the soil was frozen to 50 mm below the surface and may have been at its driest point. As soil water
froze with colder soil temperatures, the conductivity increased.
Measured soil thermal conductivities ranged from 0.9 Wlm
.
K** in earlyDecember when the soil was unfrozen to 1.27 Wlrn
-
K in early April whenthe soil was frozen. The soil was frost free from the conductivity probe depth to the soil surface in early May. In June and July, the soil conductivity remained fairly constant at 1.04 Wlrn
-
K and dropped to 1.0 Wlm.
K fromAugust to October during the drier fall conditions. The constant conductiv- ity readings during the summer and fall are attributed to the moisture hold- ing capacity of the clay portion of the soil. No vegetation, other than grass with limited watering, covers the area involved in the study.
F O U N D A T I O N B
The thermal conductivity probe is located on the north side of the house;
0.86 m out from the basement wall, 0.76 m below grade and 0.6 m east of
the thermocouple field.
**The SI Unit, W l m K, for thermal conductivity is the mathematical reduction of Wlma(Klm).
SOlL TEMPERATURE. 'C 1.4 1.2 x 2 E 1.0
1
-
a-- _.---
0
o 10 P-
- -
L
I'
I --
I 2 I1;
0.8-
2 I- 0 2 0.6-
2 0 U ,2 2 0 4-
s;;--
J0 0 ul I'j
3'PT;
I2 0,2-
@
@
I I I I 1 I I I I I O -10 - 5 0 5 10 15 20 -10 -5 0 5 10 15 20 SOlL TEMPERATURE. *CFIGURE 2. Measured soil conductivities and temperatures adjacent to foundations A-D (numbers I to 12 correspond to months January to December).
As for foundation A the soil was frozen to the 50 mm depth starting in November, but thermal conductivity readings did not start until December 5. Soil at the thermal conductivity probe did not freeze until near the end of December but remained frozen until March. As freezing at the probe oc- curred, the conductivity dropped slightly to 1.29 Wlm . K and then gradu- ally increased until late February to 1.39 Wlm . K. The soil conductivity
Predicting Frost Penetration Adjacent to Insulated Foundations 277 dropped very rapidly after the beginning ofthawing in March to a low of 0.84 Wlm K in late May. The soil conductivity rose steadily until late August (1.03 Wlm . K) and then decreased slowly in the fall to a value of 1.0 Wlrn
.
K in late October. The plotted data shows that in the spring, after surface thawing and the disappearance of melt water, the soil conduc- tivity drops rapidly. The sudden rise in conductivity in the late fall corre-sponds to 59 mm of rainfall in October (35 mrn on October 16).
I
F O U N D A T I O N CThe thermal conductivity probe is located on the south side of the house; 1.36 m out from the foundation wall, 0.63 m below grade and 0.6 m east of the thermocouple field. Beginning on November 7, with the soil surface fro- zen, the soil thermal conductivity remained constant (0.95 Wlm
.
K) until late February. The conductivity then gradually increased to 1.24 Wlm.
K by mid April when the soil had thawed and was at a higher water content than during the winter months. The summer to fall readings show a changefrom 1.2 Wlrn K to 1.3 Wlrn
.
K. Lower June and July readings could bedue to solar drying at this southern exposure. From late August to October, the soil conductivity dropped steadily from 1.3 Wlm
.
K to 1.06 Wlrn.
K when readings ceased. This drop is similar to foundation B which also hasa high percentage of granular soil, the only difference being the magnitude
of the decrease which is probably due to the higher water content of the soil at the northern exposure for foundation B.
I
F O U N D A T I O N DThe thermal conductivity probe is located 1.22 m south of the north east corner of the building and 0.76 m below grade with the probe centre directly below the east edge of the slab. Beginning on November 7, with the soil sur- face frozen, the soil conductivity dropped from 0.49 Wlm e K to 0.39 WI
ni
-
K in early December. It remained constant until the end of December when the freezing plane began to approach the conductivity probe. The soil conductivity then began toincrease^
steadily until March when surface thaw- ing and the recession of the freezing front increased soil water content andthus the soil conductivity to 0.63 Wlm
.
K. By the middle of March the soilwas frost free from the probe depth to the soil surface. This left the soil free to be dried by a small shrub and air evaporation thus lowering the soil con-
ductivity from 0.64 Wlm
.
K on April 2 to 0.59 Wlm.
K on May 17. In lateMay, lawn watering increased the soil water content and increased the soil conductivity to 0.66 Wlm K by mid-June. A decline in conductivity to
0.58 Wlrn . K on July 30 followed. The sudden increase in soil conductivity
by late August (from 0.58 Wlrn
.
K July 30 to 0.71 Wlrn K August 29) could be attributed to 10.5 rnrn of rain near the end of August plus excesslawn and shrub watering near the probe location. From late August to Octo- ber, the soil conductivity decreased in this sandy soil as it did for founda- tions B and C.
Frost Penetration
The modified design curve for each foundation relates the maximum freezing index with the maximum depth of frost penetration. The actual freezing index at the soil surface will be affected by snow cover, wind speed and incident solar radiation, since these factors can cause the soil surface temperature to vary from the ambient air temperature. However, for this report, the original definition of the freezing index was used to calculate the FI values for the modified design curves. The modified design curves are based on measured maximum depth of frost penetration and FI data col- lected for a number of years. Therefore, the effect of annual changes in soil thermal conductivity and moisture content, snow cover and indoor air tem- perature must be accounted for. In this report, it is assumed that the average annual soil conductivity and moisture content did not vary significantly from year to year. The effect of snow cover was minimized by removing the snow from the sites on a regular basis. Since the buildings were privately owned and occupied, the basement air temperatures could not be controlled. The indoor temperatures were measured (or estimated) during each site visit. To account for year to year variations in the indoor air temperature, the measured maximum depth of frost penetration for each year was adjusted to correspond to a common (reference) indoor air temperature. To do this, it was assumed that, for a given FI, the depth of frost penetration is inversely proportional to the annual heat input to the soil from the foundation. The following analysis was then applied:
Mitalas' model [6] assumes that the heat loss from a heated basement ele- ment is proportional to the temperature difference across the element and the over-all conductance. The instantaneous heat flux, [q(t)], is the sum of a steady-state component (q,) and a component which varies with time:
where q, = a constant. Since the annual integral of the variable component of the heat flux will be zero, the annual heat loss from the foundation (or heat gain to the soil), Q,, is approximated by the time integral of the steady- statc component:
Predicting Frost Penetration Adjacent to Insulated Foundations 279 From Mitalas' paper,
where
S = a shape factor (constant) for the steady-state heat loss component (WImz
.
K)BB = yearly average basement air temperature (K)
BG = mean ground temperature (K)
Evaluating Equation (2) for a 12-month period, the following expression is obtained:
Following the initial assumption that, for a given foundation/insulation configuration, the measured maximum depth of frost penetration (FD) is in- versely proportional to Q,, we can write:
where Z = constant of proportionality.
For the adjusted depth of frost penetration (FDM) based on the mean in- door air temperature:
where 8M = mean of the yearly average indoor air temperatures (mean in- door air temperature).
Combining Equations (5) and (6), we obtain:
Equation (7) was used to calculate FDM values from the yearly measured values. Using the method of least squares, a logarithmic relationship (modified design curve) was fitted to the paired values of FDM and FI. These modified design curves are given in Figure 3. For reference, the design curve given by Brown [4] is also shown.
k
'
1 1 1 1 1 1 I I l I l l l Y-
--
;/
-
-
-
FOUNDATION A - I 1 1 1 1 1 1 1 1 I I I I I I U FOUNDATION C FOUNDATION 5 - I I 1 1 1 1 1 1t
FOUNDATION D OPEN FIELD LEGEND DESIGN CURVE-
MODIFIED-
DESIGN CURVEFREEZING INDEX. O C DAYS
Predicting Frost Penetration Adjacent to Insulated Foundations 28 1
F O U N D A T I O N A
The results for foundation A show that the modified design curve has a slope similar to the design curve but is shifted downward. The actual frost penetration was approximately 65% of the design curve prediction. The modified design curve is based on a mean indoor air temperature of 18.9OC,
RSI 7.7 wall insulation, RSI 3.5 insulated suspended wood floor and an aver-
age measured soil thermal conductivity of 1.06 Wlm
.
K. For all years, the site was essentially clear of snow cover.F O U N D A T I O N B
The modified design curve for foundation B has the same slope as the design curve; however, the measured frost penetration was only 26% of the design curve value. The modified design curve is based on a mean indoor air temperature of 19.4OC, RSI 3.5 wall insulation, an uninsulated concrete floor
slab and an average measured soil thermal conductivity of 1.08 Wlm
.
K. The smaller frost penetration value at FI = 1757OC day corresponds to a natural snow accumulation of approximately 0.3 meters. For the remaining years, the site was essentially clear of snow cover.F O U N D A T I O N C
The maximum frost depth for foundation C did not follow a typical de- sign curve relationship due to the interference of the horizontal insulation skirt at the top of the footing. The frost depth reached the bottom of the in- sulation depth (0.90 m) for all years (except FI = 1757) but did not go below the bottom of the footing. The shallower frost depth for FI = 1757 may have resulted from a snow cover of approximately 0.15 m. For the other years, the site was essentially snow cleared. The modified design curve rela- tionship is based on a mean indoor air temperature of 20°C, RSI 7.7 wall in-
sulation, RSI 3.5 insulated suspended wood floor, RSI 2.6 insulation over
the footing and an average measured soil thermal conductivity of 1.11 WI m K.
F O U N D A T I O N D
The modified design curve for foundation D has a slightly steeper slope than the design curve and the measured frost penetration was only 31% of the design curve value. The modified design curve is based on a mean indoor air temperature of 18.0°C, RSI 1.75 insulation on the footing and an average
measured soil thermal conductivity of 0.54 Wlm
.
K. The site was continu- ously snow cleared.O P E N FIELD
The results for the open field frost penetration data show a curve almost parallel to the design curve. The modified design curve is shifted downward,
indicating 62% of the design curve prediction. This offset could be the result of several factors including:
1) Snow cover
The design curve is based o n snow cleared conditions. Measured, natu- rally occurring snow accumulation for the open field site ranged from
2-30 cm.
2) Soil conductivity:
The design curve is based on airport pavements with granular base courses. The soils around all of the foundations and at the open field site were much finer grained. Also, the airport pavement would act as an ef- fective moisture barrier; thus the moisture content for the granular base beneath the runway would be much lower.
DISCUSSION
In addition to being necessary input data for predicting the depth of frost penetration, soil thermal conductivity data are needed for calculating the below grade heat loss from a structure. Since low-energy houses typically have a higher ratio of below grade heat loss to total building heat loss than other buildings, errors in the below grade heat loss calculations can produce significant errors in the overall energy consumption calculations. For most below grade heat loss calculation routines, the user is required to specify a soil thermal conductivity, although this is normally a constant. Only by making successive, iterative calculations can the designer account for sea- sonal variations in soil thermal conductivity. It is recognized that conductiv- ity will vary with depth; however, this characteristic was beyond the scope of this study. For foundation A the average measured soil conductivity was
1.06 Wlrn
-
K with an annual variation of - 17% to+
20%. For founda-tion B, C and D, the values were 1.08 Wlrn
.
K (-22Oh to +29%), 1.11Wlrn
.
K ( - 14% to+
18%) and 0.54 Wlrn.
K (-28% to +31%), respec- tivcly.Whcn intcgrating the instantaneous heat loss of a building over a year to calculatc the annual heating energy consumption, accounting for the varia- tion in the soil thermal conductivity will allow more precise estimates.
Foundations U, C and D arc located in high sand content soils (98%,
94'%1, 100'X1). I'ublishcd [7] soil conductivity data for this soil type suggest
a rangc of values from approximately 1.7 WIIII. K for wet sand to 0.2 Wl nl
.
K for dry sand. The annual avcragc soil conductivity values of 1.08 and 1.1 1 Wlrn.
'K for foundations U and C arc consistent with physical obser- vations of damp, sandy soil. The sand around the heated foundation of building D had a much lower avcragc conductivity (0.54 Wlm - K), indicat-Predicting Frost Pe~etratioti Adjacerit to Ir~strlated Folrridoriarrr 283 ing drier soil conditions than foundations B and C. The perimenter heating system would cause moisture to migrate from the probe area to colder soil. Foundation A had a higher percentage of silt and clay than the other loca- tions; however, the average measured soil conductivity was similar (1.06 Wlm
.
K). These data compare well with a published [7] value for sandy, silty clay of 1.1 Wlm.
K.Although limited, the frost penetration data for these locations is repre- sentative of the in situ perfomlance of a variety of common residential foun- dations. The data in Figure 3 clearly show that increasing the amount of foundation insulation will result in an increased depth of frost penetration. Even the severe prairie climate, however, did not cause frost depths to go below the foundations that were studied in this rcport.
The modified design curve for foundation A shows that the heavily insu- lated basement closely approximates the open field frost penetration case.
With respect to construction style and insulation levels, foundation B represents a typical residential basement. Because of the moderate level of wall insulation and uninsulated floor slab, the frost penetration is relatively shallow when compared to the open field location.
Since building C has a heavily insulated foundation, the frost penetration may follow a modified design curve similar to the open field at low values of FI. The shallow foundation and horizontal insulation allows frost pene- tration to reach the insulation depth even during mild winters (FI =
1249OC day); however, the frost depth did not go below the footings during a severe winter (FI = 2409OC day). This observation highlights the neces- sity of providing frost protection for shallow, well insulated foundations.
Structure D, with wraparound insulation on the slab perimeter and in-slab perimeter heat, is not representative of common slab buildings. Typically slab buildings would have vertical insulation only. This vertical insulation configuration should allow more heat flow to the soil at the perimeter and reduce frost penetration under the slab perimeter.
CONCLUSIONS
The data from this study, while limited, provides some basic, long term information on the depth of frost penetration adjacent to insulated founda- tions.
1) Frost depth adjacent to the highly insulated basement (RSI 7.7 walls and RSI 3.5 floor) approximated the open field conditions.
2) The conventional concrete foundation (RSI 3.5 walls and uninsulated floor slab) had only 42% of the open field frost penetration:
dation (RSI 7.7 wall and RSI 3.5 floor) was necessary t o prevent frost from penetrating under the footings.
4) T h e horizontal insulation under the thickened perimeter o f the slab o n grade foundation resulted i n frost penetration below the slab.
ACKNOWLEDGEMENTS
This paper is a contribution f r o m the Institute for Research i n Construc- tion, National Research Council o f Canada. T h e authors would like t o thank their colleagues i n Ottawa for their assistance, especially T. L. White for his help i n processing the soil conductivity probe data.
REFERENCES
1. Penner, E. and K. N. Burn. "Adfreezing and Frost Heaving of Foundations," C a -
nadian Building Digest, 128, Division of Building Research, National Research
Council of Canada (1970).
2. Penner, E. and C. B. Crawford. "Frost Action and Foundations," Division of Building Research, National Research Council of Canada, NRCC 21089 (1983). 3. U.S. Corps of Engineers, Addendum No. 1, 1945-47, to report on Frost Pene-
tration, 1944-45, Boston (1949).
4. Brown, W. G. "Difficulties Associated with Predicting Depth of Freeze or Thaw," Canadian CeotechnicalJournal, 1 (1964).
5. Louie, T. M. "Freezing Index and Frost Depth," Technical Bulletin No. 88. Con- struction Materials Research and Development, Dow Chemical Canada Inc. (1 979).
6. Mitalas, G. P. "Basement Heat Loss Studies at DBWNRC," Division of Building Research, National Research Council of Canada, NRC 20416 (1982).
7. MacDonald, G. R., D. E. Claridge and P. A. Oatman. "A Comparison of Seven Basement Heat Loss Calculation Methods Suitable for Variable-Base Degree- Day Calculations," ASHRAE Transactions 1985, Vol. 91, Pt, lB, American Society of Heating, Refrigerating and Air-Conditioning Engineers, Inc., Atlanta (1985).
8. Farouki, 0 . "Evaluation of Methods for Calculating Soil Thermal Conductiv- ity," CRREL Report 82-8, U.S. Army Cold Regions Research and Engineering Laboratory (1982).
9. Figley, D. A. and L. J. Snodgrass. "The Effect of Basement Insulation on the Depth of Frost Penetration Adjacent to Insulated Foundations," Journal
of
Ther- mal Insulation, 7:266-294 (April, 1984).10. Johnson, G. H. "Instructions for the Fabricating of Thermocouple Cables for Measuring Ground Temperatures," National Research Council of Canada, NRCC 7561 (1963).
11. Goodrich, L. E. "Transient Probe Apparatus for Soil Thermal Conductivity Measurements," Associate Committee Geotechnical Research, pp. 44-55 (June,
Predicting Frost Penetration Adjacent to Insulated Foundations 285 12. Atmospheric Environment Service, Daily Soil Temperature Data 1977-1985,
Environment Canada, ISSN 0703-6523.
13. Goodrich, L. E. "Field Measurements of Soil Thermal Conductivity," Canadian Geotechnical]ournal, 23(1)51-59 (1986).
BIOGRAPHIES
Don Figley
D o n Figley is an Assistant Research Officer with the Institute for Research in Construction, National Research Council of Canada, Saskatoon, Sask. H e has been involved i n research in low energy housing and energy conserva- tion and has co-authored a number of papers dealing with energy use and air infiltration in housing, indoor air quality and low temperature air cooled solar collectors. H e is a graduate of the University of Saskatchewan with an M.Sc. in mechanical engineering and is a registered professional engineer in Saskatchewan.
Larry Snodgrass
Larry Snodgrass is a Senior Technical Off~cer with the Institute for Re- search in construction, National Research Council of Canada, Saskatoon, Sask. H e has been involved in research in the geotechnical field, principally related to performance of shallow foundations o n prairie clay soils, and has co-authored a number of papers relati; to instrumentation in this field. More recently his emphasis has been focused o n the effects of frost penetra- tion in soils adjacent to insulated foundations. H e is a graduate (C.E.T.) Civil Engineering Technologist.
T h i s paper is being d i s t r i b u t e d i n r e p r i n t form by t h e I n s t i t u t e f o r Research i n C o n s t r u c t i o n . A l i s t of b u i l d i n g p r a c t i c e and r e s e a r c h p u b l i c a t i o n s a v a i l a b l e from t h e I n s t i t u t e may be o b t a i n e d by w r i t i n g t o t h e P u b l i c a t i o n s S e c t i o n , I n s t i t u t e f o r R e s e a r c h i n C o n s t r u c t i o n , N a t i o n a l Research C o u n c i l of C a n a d a , O t t a w a , O n t a r i o , K I A 0R6.
Ce document e s t d i s t r i b u e sous forme de t i & - 2 - p a r t p a r l l Z n s t i t u t de r e c h e r c h e e n c o n s t r u c t i o n . On peut o b t e n i r une l i s t e d e s p u b l i c a t i o n s de l l I n s t i t u t p o r t a n t s u t les t e c h n i q u e s ou l e s r e c h e r c h e s e n m a t i e r e d e b l t i m e n t e n b c r i v a n t B La S e c t i o n d e s p u b l i c a t i o n s , I n s t i t u t de r e c h e r c h e e n c o n s t r u c t i o n , C o n s e i l n a t i o n a l d e r e c h e r c h e s du Canada, Ottawa ( O n t a r i o ) , KIA OR6.