1
Differences in Alimentary Glucose Absorption and Intestinal Disposal of Blood 1
Glucose Following Roux-en-Y Gastric Bypass vs Sleeve Gastrectomy 2
3
Short title: Intestinal glucose handling after bariatric surgery 4
5
Jean-Baptiste Cavin1, Anne Couvelard1,2, Rachida Lebtahi3, Robert Ducroc1, Konstantinos Arapis1,4, 6
Eglantine Voitellier1, Françoise Cluzeaud1, Laura Gillard1, Muriel Hourseau2, Nidaa Mikail3, Lara 7
Ribeiro-Parenti4, Nathalie Kapel5, Jean-Pierre Marmuse4,6, André Bado1,6, Maude Le Gall1 8
9
1INSERM U1149, DHU Unity, Paris Diderot University, 75018, France 10
2Department of Pathology, Bichat hospital, AP-HP, Paris, 75018, France 11
3Department of Nuclear Medicine, Bichat hospital, AP-HP, Paris 75018, France 12
4Department of general and digestive surgery, Bichat hospital, AP-HP, Paris 75018, France 13
5Functional Coprology Service, Pitié Salpétrière Hospital Group, AP-HP, Paris, 75013, France 14
6Co-senior author 15
16
This work was supported by French minister of higher education and research, INSERM and 17
University Paris Diderot. 18
19
BPL, bilio-pancreatic limb; GIP, glucose-dependent insulinotropic peptide; GLP1, glucagon-like 20
peptide-1; GLUT, glucose transporter; RL, Roux limb; RYGB, Roux-en-Y gastric bypass; VSG, 21
vertical sleeve gastrectomy; SGLT1, sodium/glucose cotransporter 1; PET/CT, positron emission and 22
computed tomography. 23
24 25
2 Corresponding author:
26
Maude Le Gall Ph.D. 27
Gastrointestinal and Metabolic Dysfunctions in Nutritional Pathologies 28
Centre de Recherche sur l'Inflammation Paris Montmartre 29
Inserm UMRS 1149, Université Paris Diderot Paris 7, 30
Faculté de Médecine Site Bichat 31
16, rue Henri Huchard, 32
75890 Paris Cedex 18, France 33 Email:[email protected] 34 Tel: +33 (0)157 277 459 35 Fax: +33 (0)157 277 471 36 37
The authors have declared that no conflict of interest exists 38
39
AUTHOR CONTRIBUTIONS 40
J.-B.C., M.L.G., A.B. and J.-P.M. designed the experiments; J.-B.C., M.L.G., A.B., F.C. and 41
L.G. performed experiments; K.A. and E.V. performed animal surgeries; M.H., supervised by 42
A.C., performed histologic analyses; N.M., supervised by R.L., performed PET/CT scan 43
analyses; N.K. supervised stool analyses; R.D and J.-B.C. performed Ussing chamber 44
analyses; J.-P.M., K.A. and L.R.-P. collected human clinical data and samples; J.-B.C., 45
M.L.G., A.B., A.C., R.L. analysed and interpreted data; J.-P.M. supervised the human 46
studies; J.-B.C., M.L.G. and A.B. wrote the manuscript with comments from A.C., R.D. and 47
R.L. 48
49
KEY WORDS: intestinal adaptation; enteroendocrine cells; enterohormones; GIP 50
3 ABSTRACT
52
Background & Aims: Bariatric surgeries, such as Roux-en-Y gastric bypass (RYGB) or 53
vertical sleeve gastrectomy (VSG), are the most effective approaches to resolve type 2 54
diabetes in obese individuals. Alimentary glucose absorption and intestinal disposal of blood 55
glucose have not been directly compared between individuals or animals that underwent 56
RYGB vs VSG. We evaluated in rats and humans how the gut epithelium adapts following 57
surgery and the consequences on alimentary glucose absorption and intestinal disposal of 58
blood glucose. 59
Methods: Obese male rats underwent RYGB, VSG, or sham (control) surgeries. We 60
collected intestine segments from all rats; we performed histologic analyses and measured 61
levels of mRNAs encoding the sugar transporters SGLT1, GLUT1, GLUT2, GLUT3, GLUT4 62
and GLUT5. Glucose transport and consumption were assayed using ex vivo jejunal loops. 63
Histologic analyses were also performed on Roux limb sections from patients who underwent 64
RYGB, 1–5 years after surgery. Roux limb glucose consumption was assayed following 65
surgery by positron emission and computed tomography imaging. 66
Results: In rats and humans that underwent RYGB, the Roux limb became hyperplasic, with 67
an increased number of incretin-producing cells, compared with the corresponding jejunal 68
segment of controls. Furthermore, expression of sugar transporters and hypoxia-related 69
genes increased and the non-intestinal glucose transporter GLUT1 appeared at the 70
basolateral membrane of enterocytes. Ingested and circulating glucose was trapped within 71
the intestinal epithelial cells of rats and humans that underwent RYGB. By contrast, there 72
was no hyperplasia of the intestine after VSG, but the intestinal absorption of alimentary 73
glucose was reduced and density of endocrine cells secreting glucagon-like peptide-1 74
(GLP1) increased. 75
Conclusions: The intestine adapts differently to RYGB vs VSG. RYGB increases intestinal 76
glucose disposal, whereas VSG delays glucose absorption; both contribute to observed 77
improvements in glycemia. 78
4 INTRODUCTION
80
The resolution of type 2 diabetes by bariatric surgery has attracted considerable attention in 81
recent years. Diabetes resolves rapidly after Roux-en-Y Gastric Bypass (RYGB) or Vertical 82
Sleeve Gastrectomy (VSG) 1. Beyond postoperative weight loss, the surgical procedures 83
themselves contribute to the cure of type 2 diabetes 2–5. The described mechanisms so far 84
involve caloric restriction 6–8, hormonal changes 910, accelerated gastric emptying 11–13 and 85
bile acid signalling 9 but we still lack a clear understanding of the underpinning mechanisms. 86
The gastrointestinal tract is the direct target of bariatric surgeries, and the early intestinal 87
remodeling and adaptation triggered by such interventions could be the starting point for 88
metabolic improvement 13. Unquestionably, the small intestine contributes to glycemic control 89
by orchestrating glucose transfer to the portal circulation after breakdown of complex 90
carbohydrates to glucose. In addition, the gastrointestinal tract is an important endocrine 91
organ with enteroendocrine cells secreting gut hormones, i.e., Glucagon-Like Peptide 1 92
(GLP1) and glucose-dependent Insulinotropic Peptide (GIP), involved in glucose-induced 93
insulin secretion 14. Most hypotheses propose that after RYGB, accelerated deliveries of 94
nutrients to the distal gut, as well as duodenal exclusion, contribute to alterations in 95
circulating gut hormone concentrations and improvement in glucose homeostasis 15. 96
The remodeling of gastrointestinal tract after RYGB surgery has been extensively studied in 97
rat models and hyperplasia of the alimentary Roux limb (RL) was described in most reports 98
16–21. This hyperplasia was associated with a reprogramming of intestinal glucose metabolism 99
toward an increased glucose consumption to support tissue growth in a rat model of RYGB 100
19,21. These recent observations contrast with previous studies reporting either a reduction in 101
glucose uptake from the intestinal lumen 22 or no changes in intestinal glucose uptake ex vivo 102
23. In addition, results of the literature regarding the expression pattern of intestinal sugar 103
transporters after surgery are heterogeneous 17,19,22,24. Glucose handling by the intestine is 104
actually compartmentalized in two functional circuits: during the meals, alimentary glucose is 105
absorbed and transferred to the portal blood, whereas at the fasted state, some glucose is 106
5
taken up from the arterial blood and used for intestinal metabolism 25. Previous studies focus 107
only on parts of this complex process, thus it remains unclear how the remodeled intestine 108
absorbs and consumes alimentary and blood glucose after RYGB. One recent publication 109
reported no hyperplasia of the jejunum and no reprogramming of intestinal glucose 110
metabolism after SVG 21, however no study truly investigates the consequences of VSG on 111
intestinal glucose handling. 112
In this study, we directly compared and contrasted the impact of RYGB and VSG surgeries 113
on glucose handling by the intestine, distinguishing alimentary glucose transport from blood 114
glucose intestinal uptake. In diet-induced obese rat models, the two surgeries differently alter 115
intestinal morphology, enteroendocrine cell differentiation and glucose handling by the 116
intestine in ways favourable for the regulation of glucose homeostasis. Finally, we extended 117
our most important results to humans demonstrating that RYGB induces hypertrophy of the 118
alimentary Roux limb with an increased number of incretin-producing cells and an unusual 119
overexpression of the glucose transporter GLUT1 associated with a hypermetabolic activity 120
of the epithelial cells. 121
6 MATERIALS AND METHODS
123
See Supplemental Experimental Procedures for detailed descriptions. 124
Animal surgeries and post-surgery procedures 125
All animal use conformed to the European Community guidelines was approved by the local 126
ethics committee (N°#2011-14/773-0030 Comité d'Ethique Paris-Nord) and the Ministry of 127
Higher Education and Research (N° 02285.01). Diet-induced obese rats were operated from 128
Roux-en-Y gastric bypass (RYGB), sleeve gastrectomy (VSG) or sham surgery (sham) as 129
previously described 26. 130
Human jejunal samples 131
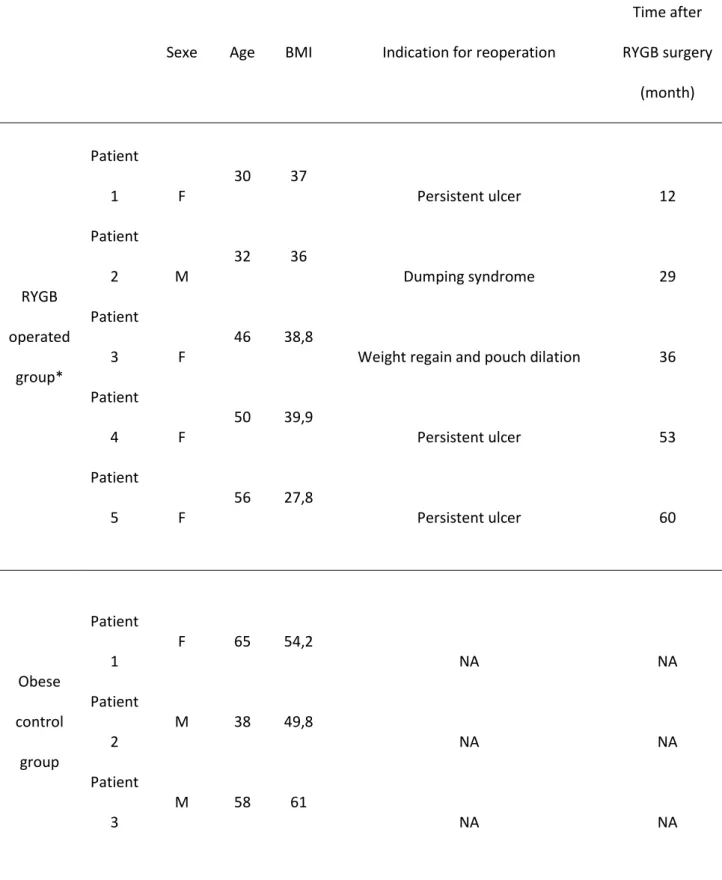
Eight patients treated by surgery from November 2013 to July 2015 were retrospectively 132
selected from the files of the department of pathology, Bichat Hospital, France. Mean age 133
was 46.8±12.7 years at the time of the surgery and BMI was 55±5.6 for obese control group 134
(n = 3) and 35.9±4.8 for RYGB patients (n = 5). None of them were diabetic and they had no 135
medication to control their glycemia (See table S1). 136
Positron emission tomography 137
Seven patients were retrospectively selected from the files of the department of nuclear 138
medicine, Bichat Hospital, France. Three RYGB patients and four control patients (without 139
gastro-intestinal diseases or cancer) had been evaluated with [18F]-FDG PET/CT. In the 140
RYGB group, mean age was 55.7 ± 7.6; BMI was 29.6 ± 3.2, in the control group, mean age 141
was 64.5 ± 14.4; BMI was 30.6 ± 4.2; none of them were diabetic and they had no 142
medication to control their glycaemia. PET and CT were performed with a PET/CT hybrid 143
system (Discovery 690; GE Healthcare). See table S2 and Supplemental Experimental 144
Procedures for detailed description of patients, procedure and image analyses. 145
Statistical analyses 146
All values are expressed as mean ± SEM. One-way ANOVA with Bonferroni correction for 147
multiple comparisons were used to compare more than 2 groups and non-parametric Mann-148
Whitney tests were used to compare 2 groups. P < 0.05 was considered to be significant. 149
7 RESULTS
150
RYGB quickly induces hypertrophy of the alimentary Roux limb 151
We studied early events following RYGB surgery either in a diet-induced obese rat model 152
(Text S1 and Figure S2). As soon as 2 weeks after surgery, the alimentary Roux limb (RL) 153
was hypertrophic and displayed a dramatic increase in its diameter compared with that of the 154
biliopancreatic limb (BPL) or with the corresponding jejunal segment (Jej) of sham-operated 155
rats (Figure 1A). The villus height and crypt depth of the RL were increased leading to a 156
thicker mucosa, whereas no modification of the BPL was observed (Figure 1B). The increase 157
in average mucosal area was maintained over 40 days (Figure S3A). Moreover, the crypt 158
cells in the hyperplasic RL were highly proliferative, as evidenced by the dense Ki67 159
immunostaining of mucosa (Figure 1C) and the increase in the number of Ki67-positive cells 160
(Figure 1D). 161
Remarkably, in humans, the RL was hypertrophic with obvious increase in mucosal area 162
(Figure 1E), increase in crypt depth (241 ± 37 µm vs 163 ± 10 µm in control group), but no 163
changes in villus height (674 ± 35 µm vs 705 ± 16 µm in control group). The number of Ki67-164
positive cells was also increased (51 ± 7 cells/crypt vs 38 ± 1 cells/crypt in control group) 165
(Figure 1F). 166
167
Increased number of endocrine cells in the hypertrophic alimentary Roux limb 168
A direct consequence of RL overgrowth was a local increased in the number of glucagon-169
like peptide (GLP1) (Figure 2A and 2B) and glucose-dependent insulinotropic peptide (GIP) 170
producing cells (Figure 2C). Accordingly, glucose-induced GLP1 secretion increased (Figure 171
S4). However, there were no significant changes in the average density of those 172
enteroendocrine cells (Figure 2B and 2C). The same observations were made in RL from 173
RYGB humans where no variation was found in the average density of enteroendocrine cells 174
(i.e., Chromogranin A-positive cells) or GLP1 secreting cells (Figure 2D and 2E). 175
8
Early and unusual expression of the glucose transporter GLUT1 in the alimentary 177
Roux limb 178
We investigated the expression of various sugar transporters in the hyperplasic RL (Figure 179
3A and 3B) and the non-hyperplasic BPL (Figure S5A and S5B) after RYGB surgery in rats. 180
Expression of genes encoding the prevalent intestinal transporters, i.e., sodium-dependent 181
glucose co-transporter 1 (SGLT1), and facilitative glucose transporter GLUT2 were not 182
significantly increased two weeks after surgery whereas expression of fructose transporter 183
GLUT5 tended to decrease (Figure 3A). However, SGLT1 transport activity measured in 184
Ussing chamber doubled in the RL at 14 days (∆Isc = 5.3 ± 0.5 µA/cm² in sham versus ∆Isc 185
= 16.6 ± 5.6 µA/cm² in RL of RYGB P<0.05). The Glut1 glucose transporter gene, normally 186
barely expressed in mature intestine, was overexpressed in the hyperplasic RL (Figure 3A), 187
but not in the BPL (Figure S4A). GLUT1 immunostaining on mucosa sections from the RL 188
revealed strong basolateral GLUT1 expression both in rats and RYGB-patients (Figure 3C 189
and 3D), showing a similar adaptive response to surgery in human. Interestingly, 40 days 190
after surgery, Glut1 mRNA levels remained high, but expression of genes encoding SGLT1, 191
GLUT2 and GLUT5 had also increased in the RL (Figure 3B), but not in the BPL (Figure 192
S5B). On the contrary, Glut3 mRNA remained at a basal level (Figure 3A, 3B, S5A and S5B) 193
and Glut4 mRNA was never detected in the intestine (not shown). The appearance of GLUT1 194
incited us to measure the expression levels of the hypoxia-inducible genes. Hif1α mRNA 195
increased in the RL and decreased in the BPL 14 days post-surgery in rats (Figure 3A and 196
S5A) whereas the vascular endothelial growth factor Vegf mRNA, specifically increased in 197
the RL 40 days after surgery (Figure 3B and S5B). 198
199
Increase sequestration of glucose in the alimentary Roux limb 200
We next questioned the functional impact of the modified expression of sugar transporters in 201
the alimentary RL on intestinal glucose handling. We thus performed ex vivo transport 202
studies on RL segments of rats subjected to RYGB and jejunal segments of sham-operated 203
9
rats, with radiolabeled [14C]-glucose (Figure 4). The time-dependent transport of glucose from 204
the mucosal side to the serosal side (mimicking alimentary glucose absorption) was identical 205
in RYGB and sham groups, and sensitive to phloretin (Figure 4A). However, greater amounts 206
of [14C]-glucose were found within the RL mucosa after 60min (2,5 fold, P<0.001 vs. sham; 207
Figure 4B). The transport of glucose from the serosal side to the mucosal side (mimicking 208
blood glucose transport) was not affected by RYGB surgery (Figure 4C), but again greater 209
amounts of [14C]-glucose were measured after 60min within the RL mucosa at levels five 210
times higher than that within the sham-operated jejunal segments (P<0.001 vs. Sham; Figure 211
4D). In vivo, the glycaemic response observed after an oral load of glucose in RYGB-rats 212
was improved as soon as 14 days after RYGB surgery with a similar kinetic of glucose 213
appearance in blood but an accelerated return to normal glycemia, compared to Sham-214
operated rats or preoperative animals (Figure 4E). 215
We next questioned the physiological relevance of these findings to humans, by reviewing 216
Positron Emission Tomography-Computed Tomography (PET/CT) scan data for individuals 217
that had undergone RYGB surgery. All analysed RYGB patients exhibited abnormal [18 F]-218
fluorodeoxyglucose ([18F]-FDG) uptake by the intestine Roux limb. One exhibited a strong 219
hypermetabolic activity in the RL characterized by an intense [18F]-FDG uptake on 220
attenuation-corrected PET images (Figure 4F and movie S1). The two other RYGB patients 221
had also abnormal [18F]-FDG uptake by the intestine Roux limb although more limited than 222
the first patient. In comparison, no abnormal uptake was found in the corresponding jejunum 223
of 4 control patients (matched for the body mass index) (Figure 4F and movie S1). 224
225
VSG does not induce intestinal hypertrophy but increases number and density of 226
GLP1-positive cells 227
We next studied the jejunal remodeling in rats subjected to VSG (Text S2 and Figure S6). 228
Two weeks after surgery, the jejunum was not hypertrophic and its diameter did not change 229
compared with the jejunum of sham-operated rats (Figure 5A). The villus height but not the 230
10
crypt depth was slightly increased (Figure 5B). The average mucosal area did not change 231
neither after 14 days (Figure 5B) nor after 40 days (Figure S3B). Accordingly, the number of 232
Ki67-positive cells remained similar to that of sham-operated rats (Figure 5C). However, the 233
number and density of GLP1- but not GIP-secreting cells were increased in the jejunum of 234
VSG-operated rat after 14 days (Figure 5D and 5E). Accordingly, plasma GLP1 levels 235
increased 30min after an oral glucose load in VSG-operated compared to sham-operated 236
rats (Figure S4). 237
238
VSG does not induce GLUT1 and reduces intestinal absorption of glucose 239
Contrary to what we observed for hyperplasic RL after RYGB, no change in the expression 240
level of prevalent jejunal sugar transporter occurred after VSG and induction of GLUT1 was 241
detected neither 14 days nor 40 days after the surgery (Figure 6A). Time-dependent glucose 242
transport from the mucosal side to the serosal side (mimicking alimentary glucose 243
absorption) decreased markedly after VSG (Figure 6B). Moreover, the serosal-to-mucosal 244
transport of [14C]-glucose (mimicking blood glucose uptake) was slightly enhanced (Figure 245
6D). By contrast to RYGB where higher amounts of [14C]-glucose were measured within the 246
RL mucosa after 60min, the amounts of [14C]-glucose was not significantly different in the 247
jejunum mucosa of VSG-operated rats (whatever its alimentary or blood origin) (Figure 6C 248
and 6E). In vivo, the glycaemic response observed after an oral load of glucose in VSG-249
operated rats improved, but with both a delayed appearance of glucose in blood (reduced 250
absorption) and an accelerated return to normal, compared to sham-operated or 251
preoperative animals (Figure 6F). 252
11 DISCUSSION
254
In this study, using diet-induced obese rats, we directly compared the impact of two bariatric 255
surgeries on the glucose transport capacity of the intestine. We identified two distinct but 256
rapid adaptations affecting intestinal morphology and glucose handling (Figure 7). In 257
response to VSG, glucose transport capacity is reduced and density of cells secreting GLP1 258
is increased. In response to RYGB, the intestine became hyperplasic increasing de facto the 259
number of GLP1-secreting cells but more importantly diverting glucose for its own growing 260
needs. Both mechanisms are concomitant with an ameliorated glucose tolerance after 261
surgery. Finally, the physiological relevance of these data was extended to obese individuals 262
after RYGB. 263
It is usually accepted that enterohormones, in particular GLP1, play a role in glycaemic 264
improvement after bariatric surgery 27. In our rat studies, we confirmed that there were no 265
significant changes in the average density of GLP1-producing enteroendocrine cells after 266
RYGB surgery 21. The same observations were made in RL from RYGB humans where no 267
variation was observed in the average density of enteroendocrine cells (i.e., Chromogranin 268
A-positive cells) and GLP1 cells. Those results contrast with recent observations made by 269
two different groups reporting an increased GLP1 and GIP cell density one year after RYGB 270
in human 28,29. However, a direct consequence of RL overgrowth after RYGB was a local 271
increase in the number of GLP1- and GIP-producing cells. Thus, even in the absence of cell 272
density modification, the enhanced intestinal mass directly leads to increase the secretory 273
cell population, which in turn could contribute to enhance incretin secretion in response to 274
stimulus as previously reported 18,30,31. Interestingly, in our model of VSG-operated rat, the 275
number and density of GLP1 cells was increased in the jejunum after 14 days. This 276
observation contrasts with recent data showing that the number of GLP1-secreting cells did 277
not change three months after VSG in rats 21. Nevertheless it would be a reasonable 278
explanation to the higher rate of GLP1 secretion that we observed with others 12. Altogether 279
our results suggest an early contribution of GLP1, in the amelioration of glycaemia following 280
12
surgery, but how the surgeries act on enteroendocrine cell distribution remains controversial. 281
Kinetic analyses would allow determining whether the reported increase in GLP1 and GIP 282
cell density is a transient phenomenon and could explain the discrepancy between early and 283
later stage observations. 284
The hypertrophy of the RL after RYGB was previously reported in numerous rat models 16–21. 285
The similar average mucosal area observed 14 and 40 days after surgery in our RYGB rat 286
model suggests that overgrowth of the RL is a very rapid process achieved within two weeks 287
following surgery. The new morphometric characteristics of the RL are maintained over time, 288
for at least one year after surgery in rodents 18,19. This early RL response was characterised 289
by the overexpression of a single sugar transporter, GLUT1, which is normally poorly 290
expressed in mature jejunum 32. GLUT1 has been shown to increase the supply of glucose to 291
proliferative cancer cells in response to hypoxia 33. Accordingly, levels of mRNA coding for 292
the hypoxia-inducible factor HIF1 were found to have increased in the RL 14 days post-293
surgery in rats. This suggests that oxygen supply may be insufficient to support the massive 294
hyperplasia. This hypothesis was strengthened by the additional overexpression of Vegf 295
mRNA after 40 days. The HIF1 transcription factor directly regulates GLUT1 34,35. It could, 296
therefore, initiate the reprogramming of glucose metabolism previously reported 19,21, 297
providing the required additional energy. Concomitantly to the basolateral appearance of 298
GLUT1, an enhancement of apical SGLT1 activity was measured in the RL of RYGB rats. 299
Thus, apical SGLT1 may act together with basolateral GLUT1 to increase glucose uptake by 300
the RL epithelium and allow energy requirements to be met. Intestinal transport studies 301
revealed that greater amounts of absorbed glucose remained within the RL mucosa 302
suggesting that the alimentary RL increases glucose uptake from the lumen during digestion, 303
and consumes it to satisfy its own energy requirements. The increase in alimentary and 304
circulating glucose uptake and consumption by RL epithelial cells may enhance glucose 305
disposal during and between meals, thereby improving glycaemic control. A previous study, 306
analysing [18F]-FDG biodistribution in rats 19, ranked the remodelled intestine as the second 307
13
highest glucose consumer, after the brain. We next extend those results to humans. Gut 308
hyperplasia following RYGB surgery, with appearance of glucose transporter GLUT1 at the 309
basolateral membrane, leads to an increase in glucose consumption by the RL. The 310
consequent glucose disposal, may contribute to the better glucose tolerance observed in rats 311
and to the resolution of diabetes reported in humans 1. One limitation of the present study is 312
the small number of patients which renders delicate to draw strong conclusions about human 313
intestinal adaptation. However, GLUT1 overexpression and hypermetabolic activity of the 314
Roux limb observed in RYGB patients at different post-surgical stage provided evidence for 315
the potential physiological relevance of these findings in humans. 316
Whereas the early induction of GLUT1 may be crucial to sustain the energy-consuming 317
overgrowth of the intestine after RYGB, the subsequent overexpression of the other intestinal 318
transporters, SGLT1, GLUT2 and GLUT5, could allow the increase in sugar absorption to 319
counterbalance the malabsorption generated by the intestinal shortening. These two steps of 320
intestinal adaptation processes may make different contributions to the early and long-term 321
effects of RYGB surgery. They could reconcile previous controversial observations about 322
expression patterns of sugar transporters after surgery 17,19,22,24. 323
Compared to RYGB, VSG is a less intrusive intervention involving surgical resection of a 324
large part of the stomach, but results in a similar improvement in fasting glucose 325
concentrations independently of weight loss 31,4. Thanks to low complication rates and short 326
hospital stays, VSG surgery is becoming the most popular bariatric surgery in developed 327
countries. Nevertheless, little is known about its mechanisms of action and, to date, no study 328
investigates the consequences of this surgery on intestinal glucose handling except one 329
recent publication reporting no increase in hexokinase II protein expression after VSG versus 330
RYGB 21. Using our rat models, we directly compared and contrasted gut adaptation in 331
response to VSG versus RYGB surgery. No hypertrophy of the jejunum mucosa, no 332
induction of GLUT1 and no change in the expression level of prevalent jejunal sugar 333
transporter occurred 14 days or 40 days after VSG. This absence of intestinal hypertrophy, 334
14
confirmed after three months in a recent study 21, shows that an increase in glucose disposal 335
by the hypertrophic intestine is not likely to account neither for short-term nor for long-term 336
improvements in glycaemia triggered by VSG. Consistently, no increase in the sequestration 337
of glucose, whatever its origin (alimentary or blood), occurred in the jejunum of VSG-338
operated rats. However, the transport of alimentary glucose markedly decreased after VSG, 339
suggesting that VSG jejunum had a lower absorption capacity of alimentary glucose. A slight 340
but significant increase in transepithelial glucose transport from blood to the lumen was also 341
detected. The origin of this regulation is unknown, but VSG may improve glucose tolerance 342
by delaying the entry of alimentary glucose, and possibly by releasing some blood glucose 343
into the lumen. These results were in agreement with the delayed glycaemic response 344
observed after an oral load of glucose in our rats and reported in humans 36. Intestinal 345
remodelling could thus play a major role in the initial improvement of glucose homeostasis 346
following both surgeries not only through better incretin secretion, but also through modified 347
intestinal glucose handling. Another consequence of gastro-intestinal remodelling by bariatric 348
surgery that we did not address in this study is accelerated gastric empting, although it may 349
be important for incretin secretion and blood glucose delivery 11–13. More interventional 350
studies in rat models will be required to evaluate the relative contributions of each of these 351
parameters to the regulation of glycemia. 352
Conclusion 353
In this study, we report that bariatric surgeries induce profound changes in glucose handling 354
by the intestine although underlying mechanisms differ considerably between VSG and 355
RYGB (Figure 7). In RYGB, alimentary glucose and blood glucose are sequestered by 356
epithelial cells for their own use, whereas, in VSG, the uptake of alimentary glucose by the 357
intestine is reduced. Further studies with more patients are needed to understand whether 358
these adaptive mechanisms are key determinants for diabetes resolution in humans. Our 359
results, nevertheless, unveil the reconfigured intestine as a putative contributor of glycemic 360
15
improvement and thwart the intuitive idea that RYGB and VSG must share a common 361
mechanism of action for a similar efficiency. 362
363
REFERENCES 364
1. Rubino F, Schauer PR, Kaplan LM, et al. Metabolic Surgery to Treat Type 2 Diabetes: Clinical 365
Outcomes and Mechanisms of Action. Annu. Rev. Med. 2010;61:393–411. 366
2. Pournaras DJ, Osborne A, Hawkins SC, et al. Remission of type 2 diabetes after gastric bypass 367
and banding: mechanisms and 2 year outcomes. Ann. Surg. 2010;252:966–971. 368
3. Chambers AP, Jessen L, Ryan KK, et al. Weight-Independent Changes in Blood Glucose 369
Homeostasis after Gastric Bypass or Vertical Sleeve Gastrectomy in Rats. Gastroenterology 370
2011;141:950–958. 371
4. Schauer PR, Bhatt DL, Kirwan JP, et al. Bariatric Surgery versus Intensive Medical Therapy for 372
Diabetes — 3-Year Outcomes. N. Engl. J. Med. 2014;370:2002–2013. 373
5. Ardestani A, Rhoads D, Tavakkoli A. Insulin Cessation and Diabetes Remission After Bariatric 374
Surgery in Adults With Insulin-Treated Type 2 Diabetes. Diabetes Care 2015;38:659–664. 375
6. Isbell JM, Tamboli RA, Hansen EN, et al. The Importance of Caloric Restriction in the Early 376
Improvements in Insulin Sensitivity After Roux-en-Y Gastric Bypass Surgery. Diabetes Care 377
2010;33:1438–1442. 378
7. Lingvay I, Guth E, Islam A, et al. Rapid Improvement in Diabetes After Gastric Bypass Surgery. 379
Diabetes Care 2013;36:2741–2747. 380
8. Lips MA, Groot GH de, Klinken JB van, et al. Calorie Restriction is a Major Determinant of the 381
Short-Term Metabolic Effects of Gastric Bypass Surgery in Obese Type 2 Diabetic Patients. 382
Clin. Endocrinol. (Oxf.) 2014;80:834–842. 383
9. Sweeney TE, Morton JM. Metabolic surgery: Action via hormonal milieu changes, changes in 384
bile acids or gut microbiota? A summary of the literature. Best Pract. Res. Clin. Gastroenterol. 385
2014;28:727–740. 386
10. Holst JJ. Enteroendocrine secretion of gut hormones in diabetes, obesity and after bariatric 387
surgery. Curr. Opin. Pharmacol. 2013;13:983–988. 388
11. Marathe CS, Rayner CK, Jones KL, et al. Relationships Between Gastric Emptying, Postprandial 389
Glycemia, and Incretin Hormones. Diabetes Care 2013;36:1396–1405. 390
12. Chambers AP, Smith EP, Begg DP, et al. Regulation of gastric emptying rate and its role in 391
nutrient-induced GLP-1 secretion in rats after vertical sleeve gastrectomy. Am. J. Physiol. - 392
Endocrinol. Metab. 2014;306:E424–E432. 393
13. Seeley RJ, Chambers AP, Sandoval DA. The Role of Gut Adaptation in the Potent Effects of 394
Multiple Bariatric Surgeries on Obesity and Diabetes. Cell Metab. 2015;21:369–378. 395
14. Campbell JE, Drucker DJ. Pharmacology, physiology, and mechanisms of incretin hormone 396
action. Cell Metab. 2013;17:819–837. 397
16
15. Mingrone G, Castagneto-Gissey L. Mechanisms of early improvement/resolution of type 2 398
diabetes after bariatric surgery. Diabetes Metab. 2009;35:518–523. 399
16. Bueter M, Löwenstein C, Olbers T, et al. Gastric Bypass Increases Energy Expenditure in Rats. 400
Gastroenterology 2010;138:1845–1853.e1. 401
17. Taqi E, Wallace LE, Heuvel E de, et al. The influence of nutrients, biliary-pancreatic secretions, 402
and systemic trophic hormones on intestinal adaptation in a Roux-en-Y bypass model. J. Pediatr. 403
Surg. 2010;45:987–995. 404
18. Mumphrey MB, Patterson LM, Zheng H, et al. Roux-en-Y gastric bypass surgery increases 405
number but not density of CCK-, GLP-1-, 5-HT-, and neurotensin-expressing enteroendocrine 406
cells in rats. Neurogastroenterol. Motil. 2013;25:e70–79. 407
19. Saeidi N, Meoli L, Nestoridi E, et al. Reprogramming of intestinal glucose metabolism and 408
glycemic control in rats after gastric bypass. Science 2013;341:406–410. 409
20. Hansen CF, Bueter M, Theis N, et al. Hypertrophy Dependent Doubling of L-Cells in Roux-en-410
Y Gastric Bypass Operated Rats. PLoS ONE 2013;8:e65696. 411
21. Mumphrey MB, Hao Z, Townsend RL, et al. Sleeve Gastrectomy Does Not Cause Hypertrophy 412
and Reprogramming of Intestinal Glucose Metabolism in Rats. Obes. Surg. 2015:1–6. 413
22. Stearns AT, Balakrishnan A, Tavakkolizadeh A. Impact of Roux-en-Y gastric bypass surgery on 414
rat intestinal glucose transport. Am. J. Physiol. - Gastrointest. Liver Physiol. 2009;297:G950– 415
G957. 416
23. Bhutta HY, Deelman TE, Roux CW le, et al. Intestinal sweet-sensing pathways and metabolic 417
changes after Roux-en-Y gastric bypass surgery. Am. J. Physiol. - Gastrointest. Liver Physiol. 418
2014;307:G588–G593. 419
24. Nguyen NQ, Debreceni TL, Bambrick JE, et al. Upregulation of intestinal glucose transporters 420
after Roux-en-Y gastric bypass to prevent carbohydrate malabsorption. Obesity 2014;22:2164– 421
2171. 422
25. Fernández-López JA, Casado J, Argilés JM, et al. Intestinal handling of a glucose gavage by the 423
rat. Mol. Cell. Biochem. 1992;113:43–53. 424
26. Arapis K, Cavin JB, Gillard L, et al. Remodeling of the Residual Gastric Mucosa after Roux-425
En-Y Gastric Bypass or Vertical Sleeve Gastrectomy in Diet-Induced Obese Rats. PLoS ONE 426
2015;10:e0121414. 427
27. Salehi M, D’Alessio DA. Effects of glucagon like peptide-1 to mediate glycemic effects of 428
weight loss surgery. Rev. Endocr. Metab. Disord. 2014;15:171–179. 429
28. Rhee NA, Wahlgren CD, Pedersen J, et al. Effect of Roux-en-Y gastric bypass on the 430
distribution and hormone expression of small-intestinal enteroendocrine cells in obese patients 431
with type 2 diabetes. Diabetologia 2015:1–5. 432
29. Nergård BJ, Lindqvist A, Gislason HG, et al. Mucosal glucagon-like peptide-1 and glucose-433
dependent insulinotropic polypeptide cell numbers in the super-obese human foregut after gastric 434
bypass. Surg. Obes. Relat. Dis. Off. J. Am. Soc. Bariatr. Surg. 2015. 435
17
30. Papamargaritis D, Miras AD, Roux CW le. Influence of diabetes surgery on gut hormones and 436
incretins. Nutr. Hosp. 2013;28 Suppl 2:95–103. 437
31. Chambers AP, Jessen L, Ryan KK, et al. Weight-Independent Changes in Blood Glucose 438
Homeostasis after Gastric Bypass or Vertical Sleeve Gastrectomy in Rats. Gastroenterology 439
2011;141:950–958. 440
32. Thorens B. Glucose transporters in the regulation of intestinal, renal, and liver glucose fluxes. 441
Am. J. Physiol. - Gastrointest. Liver Physiol. 1996;270:G541–G553. 442
33. Szablewski L. Expression of glucose transporters in cancers. Biochim. Biophys. Acta BBA - 443
Rev. Cancer 2013;1835:164–169. 444
34. Ebert BL, Firth JD, Ratcliffe PJ. Hypoxia and Mitochondrial Inhibitors Regulate Expression of 445
Glucose Transporter-1 via Distinct Cis-acting Sequences. J. Biol. Chem. 1995;270:29083– 446
29089. 447
35. Chen C, Pore N, Behrooz A, et al. Regulation of glut1 mRNA by Hypoxia-inducible Factor-1 448
interaction between H-ras and hypoxia. J. Biol. Chem. 2001;276:9519–9525. 449
36. Jiménez A, Ceriello A, Casamitjana R, et al. Remission of type 2 diabetes after Roux-en-Y 450
gastric bypass or sleeve gastrectomy is associated with a distinct glycemic profile. Ann. Surg. 451
2015;261:316–322. 452
453
Author names in bold designate shared co-first author. 454
18 FIGURE LEGENDS
456 457
Figure 1. Hypertrophy and highly proliferative crypt cells in the Roux limb after RYGB 458
surgery. 459
(A and C) Representative images of hematoxylin-phloxine-saffron (HPS)-stained section (A) 460
or Ki67-immunostained section (C) of the alimentary Roux limb (RL) and biliopancreatic limb 461
(BPL) of RYGB-rats and corresponding jejunal segment (Jej) from sham-operated rats 14 462
days post-surgery. Scale bar, 1 mm (A) and 100 µm (C). 463
(B and D) Morphometric analyses showing the mucosal area, villus height and crypt depth 464
(B) and number of Ki67-immunoreactive cells per crypt (D) in the RL and BPL of RYGB-rats 465
(n = 4), and jejunum from sham-operated rats (Jej) (n = 5) 14 days post-surgery. Data are 466
means ± SEM. *P < 0.05, **P < 0.01 versus sham, based on ANOVA with Bonferroni 467
correction for multiple comparisons. 468
(E and F) Representative images of HPS-stained (E) and Ki67-immunostained jejunum 469
mucosa section (F) of RL mucosa from a patient who underwent RYGB (right), one year 470
post-surgery, compared to a perioperative jejunum section from an obese individual (left). 471
Scale bar, 500 µm. 472
473
Figure 2. Increased number of enteroendocrine cells after RYGB surgery. 474
(A) Representative images of GLP1 immunostaining in RL and BPL sections from RYGB-rats 475
and jejunum from sham-operated rats 14 days post-surgery. Scale bar, 100 µm. 476
(B-C) Number of GLP1 (B) and GIP (C) immunoreactive cells per section and per mm² in the 477
RL and BPL of rats after RYGB surgery (n = 4) or in the jejunum of sham-operated rats (n = 478
5), 14 days post-surgery. Data are means ± SEM. ***P < 0.001 versus sham, in ANOVA with 479
Bonferroni correction for multiple comparisons. 480
19
(D-E) Representative images of Chromogranin A (D) and GLP1 (E) immunostaining in Roux 481
limb sections from a patient who underwent RYGB (right), one year post-surgery and in the 482
corresponding jejunum sections from an obese subject (left). Scale bar, 200 µm. 483
484
Figure 3. Early induction of the glucose transporter GLUT1 in the Roux limb after 485
RYGB surgery. 486
(A and B) Relative mRNA levels for sugar transporters and hypoxia-inducible genes in the 487
Roux limb mucosa at (A) 14 days (n = 4) or (B) 40 days (n = 5) after RYGB. The dotted lines 488
indicate the mean mRNA levels of the corresponding genes in jejunal mucosa from sham-489
operated rats (n = 5). Data are means ± SEM. *P < 0.05, **P < 0.01 versus sham-operated 490
rats, in Mann-Whitney test. 491
(C) Representative images of GLUT1 immunostaining in Roux limb mucosa sections from 492
RYGB-rats and corresponding jejunal sections from sham-operated rats 14 days post-493
surgery. Scale bar, 50 µm. 494
(D) Representative images of GLUT1 immunostaining in Roux limb sections from a patient 495
who underwent RYGB, one year post-surgery and in the corresponding jejunum mucosa 496
sections from an obese subject. Scale bar, 100 µm (upper panels). High magnification: lower 497
panels. Scale bar 20 µm. 498
499
Figure 4. Increase in glucose consumption by the alimentary Roux limb after RYGB is 500
associated with better oral glucose tolerance. 501
(A) Time course for the mucosal to serosal transport of [14C]-glucose across the RL of RYGB-502
rats (n = 4) and the corresponding jejunum segment from sham-operated rats with (n = 3) 503
and without (n = 8) phloretin, 14 days post-surgery. 504
(B) Mucosal [14C]-glucose content of intestine segments at 60 minutes, showing greater 505
sequestration of alimentary glucose within the RL from RYGB-rats (n = 4) than within the 506
20
equivalent jejunal segment from sham-operated rats (n = 8). Data are means ± SEM. ***P < 507
0.001, versus sham-operated rats, in Mann-Whitney tests. 508
(C) Time course for the serosal to mucosal transport of [14C]-glucose across the RL of 509
RYGB-rats (n = 4) and the corresponding jejunum segment from sham-operated rats with (n 510
= 3) and without (n = 8) phloretin, 14 days post-surgery. 511
(D) Serosal [14C]-glucose content of intestine segments at 60 minutes, showing greater 512
sequestration of peripheral glucose within the RL from RYGB-rats (n = 4) than within the 513
equivalent jejunal segment from sham-operated rats (n = 8). Data are means ± SEM. ***P < 514
0.001, versus sham-operated rats, in Mann-Whitney tests. 515
(E) Blood glucose levels after an oral load of glucose (1 g/kg) and the corresponding 516
calculated area under the curve (AUC, inset) in obese rats before (preoperative, n = 12) and 517
12 days after RYGB (n = 4) or sham surgery (n = 5). Data are means ± SEM. *P < 0.05, **P 518
< 0.01, versus the preoperative value, in two-way ANOVA followed by Bonferroni correction 519
for multiple comparisons. 520
(F) Representative images from whole-body [18F]-FDG PET/CT scan of a control individual 521
and a RYGB patient. The blue arrowhead shows a strong [18F]-FDG uptake by the Roux limb 522
in patient who underwent RYGB (yellow-white signal) compared to the undetectable signal in 523
the jejunum of BMI-matched control patient illustrating the hypermetabolic activity of the 524
Roux limb in RYGB patient. 525
526
Figure 5. VSG does not induce intestinal hypertrophy but increases density and 527
number of GLP1-positive cells. (A) Representative cross-sections of the jejunum of a VSG-528
rat and a sham-operated rat, 14 days post-surgery. Scale bar, 1 mm. 529
(B) Morphometric analyses of the jejunum showing the mucosal area of sections, villus 530
height and crypt depth from VSG-rats (n = 5), compared with sham-operated rats (n = 5) 14 531
days post-surgery. Data are means ± SEM. *P < 0.05, NS (not significant), versus sham-532
operated rats, in Mann-Whitney test. 533
21
(C) Representative images of immunostained sections and quantification of Ki67-534
positive proliferating cells in the crypts of jejunum from rats subjected to VSG or sham 535
surgery, 14 days post-surgery. Scale bar, 100 µm. NS not significant, versus sham-operated 536
rats, in Mann-Whitney test. 537
(D-E) Quantification of (D) GLP1 and (E) GIP-immunoreactive cells per section and per mm² 538
of jejunum sections from VSG-rats (n = 4) and sham-operated rats (n = 5). Scale bar, 100 539
µm. Data are means ± SEM. *P < 0.05, NS not significant, versus sham-operated rats, in 540
Mann-Whitney test. 541
542
Figure 6. VSG decreases intestinal glucose absorption. (A) Relative mRNA levels of 543
sugar transporters in the jejunal mucosa from rats subjected to VSG 14 days (n = 4) or 40 544
days (n = 5) post-surgery. The dotted line indicates the mean mRNA levels in sham-operated 545
rats (n = 5). Data are means ± SEM. 546
(B-D) Time course of mucosal-to-serosal (B) and serosal-to-mucosal (D) [14C]-glucose 547
transport across the jejunum of rats subjected to VSG (n = 6) and sham surgery, with (n = 3) 548
or without (n = 8) phloretin, 14 days post-surgery. Data are means ± SEM. *P < 0.05, **P < 549
0.01, ***P < 0.001, versus sham-operated rats, in two-way ANOVA with Bonferroni correction 550
for multiple comparisons. 551
(C-E) [14C]-glucose content of intestine segments at 60 minutes. No significant difference in 552
the sequestration of alimentary (C) or peripheral (E) glucose within the jejunal segments was 553
observed between VSG and sham-operated rats. Data are means ± SEM. NS, not 554
significant, in Mann-Whitney test. 555
(F) Blood glucose levels after administration of an oral load of glucose (1 g/kg) and the 556
corresponding calculated area under the curve (AUC, insert) in obese rats before 557
(preoperative, n = 16) and 12 days after VSG (n = 5) or sham surgery (n = 9). Data are 558
means ± SEM. #P < 0.05 (sham vs. preoperative), **P < 0.01, ***P < 0.001 (VSG vs. 559
preoperative), in two-way ANOVA with Bonferroni correction for multiple comparisons. 560
22 561
Figure 7. Schematic view of the differential intestinal adaptations after RYGB and VSG 562
leading to improvement of glucose tolerance 563
In response to RYGB, the intestine became hyperplasic, alimentary glucose transport and 564
blood glucose uptake increased but glucose was sequestered by epithelial cells for their own 565
use. In response to VSG, alimentary glucose transport capacity was reduced and a slight 566
increase in transepithelial glucose transport from blood to the lumen was detected. Both 567
intestinal adaptations contribute to ameliorate sugar tolerance after surgery. 568
569
ACKNOWLEDGMENT 570
We would like to thank the team of N.K. at Department of Functional coprology, APHP for 571
stool analyses; Pr D. Le Guludec responsible of FRIM imaging platform and Chief of the 572
Nuclear Physic Department; O. Thibaudeau and S. Ameur for help in histologic experiments; 573
V. Descatoire for help in histologic analyses; L. Aline for technical help; J. Le Beyec, H. 574
Duboc and S. Ledoux for comments. M.L.G. thanks L. Arnaud for constant support. 575
Figure 1
Figure 2
Figure 3
Figure 4
Figure 5
Figure 6
Figure 7
1 SUPPORTING DOCUMENTS
Supplemental Experimental Procedures
Animal surgeries and post-surgery procedures
Male Wistar rats weighing 220–240 g were fed with high-fat diet (HFD, Altromin C45) for 16 weeks. Diet-induced obese rats weighing 675 ± 50g were divided into Roux-en-Y gastric bypass (RYGB), sleeve gastrectomy (VSG) and sham-operated (sham) group. They were fasted overnight before operation. Anesthesia was induced by intraperitoneal injection of pentobarbital (Ceva, Libourne, France). Standard aseptic procedures were used throughout. After laparotomy, the stomach was isolated outside the abdominal cavity. Loose gastric connections to the spleen and liver were released along the greater curvature, and the suspensory ligament supporting the upper fundus was severed.
RYGB: The forestomach was resected using an Echelon 45-mm staple gun with blue cartridge (Ethicon, Issy les Moulineaux, France). Then, the gastric pouch was created with a TA-DST 30-mm-3.5-mm stapler (Covidien, Courbevoie, France) preserving the arterial and venous supply. The jejunum was transected 15 cm distally from the pylorus. The Roux limb was anastomosed to the gastric pouch and the biliopancreatic limb was anastomosed 20 cm distally to gastro-jejunal anastomosis with 6-0 Polydioxanone (PDS) running sutures.
VSG: After resection of the forestomach as above, 80% of the stomach was resected with an application of Echelon 45-mm staple gun, leaving a thin gastric tube in continuity with the esophagus and keeping the antrum in place.
Sham: To mimic surgery, stomach was tweaked with an unarmed staple gun for RYGB sham and VSG sham and jejunum was transected and repair for RYGB sham.
For all these procedures, the laparotomy was closed with 5.0 Polyglycolide (PGA) suture in two layers.
Post-operative care:
Health and behavior of each animal were evaluated daily.
Supporting Document NO Tracked Changes
2
RYGB-operated rats were kept without food for 48 h after the surgery. They received subcutaneous injections of 12 mL Bionolyte G5 (Baxter, Maurepas, France) twice a day within this period. From days 3 to 5, they had access to liquid diet (Altromin C-0200, Genestil, Royaucourt, France), which correspond to 50 Kcal/day (50% of preoperative intake). A free access to solid Normal Diet (Altromin 1324, Genestil, Royaucourt, France), was allowed from day 6.
VSG-operated rats were kept without food for 24 h after the surgery but they received subcutaneous injections of 12 mL Bionolyte G5 (Baxter, Maurepas, France) twice a day. From days 2 to 3, they had access to liquid diet (Altromin C-0200, Genestil, Royaucourt, France), which correspond to 50 Kcal/day (50% of preoperative intake). A free access to solid Normal Diet (Altromin 1324, Genestil, Royaucourt, France), was allowed from day 4. Sham-operated rats had the same post-operative care than their corresponding surgical group.
Post-operative analyses: Body weight and food intake were measured daily and the average daily calorie intake was calculated. Fourteen or forty days after surgery, rats were euthanized after overnight food deprivation and gut segments were sampled as illustrated (Figure S1).
Stool analyses
10 days after surgery, rats were transferred into metabolism cages. The total amount of consuming food was recorded each day. The stools were collected daily and stored at -20°C. Stools collected for three days were pooled, and analyses were performed on homogenized samples. Total energy content was determined by bomb calorimetry (PARR 1351 Bomb Calorimeter; Parr Instrument Company). Fecal calorie loss represented the proportion of ingested energy recovered in stool output.
3 Oral glucose tolerance test
Rats were fasted for 16 h before being subjected to an oral glucose tolerance test (OGTT). Blood was sampled from the tail vein before (t=0) and 5, 15, 30, 60, 90 and 120 min after oral load of glucose (1g/kg body weight). Blood glucose levels were measured with the AccuChek System (Roche Diagnostics, Meylan, France) and expressed in mg/dL.
Plasma GLP1 measurement
Rats were fasted for 16 h before being subjected to an oral load of glucose (1g/kg body weight). Blood (200L), sampled from the tail vein before (t=0) and 30 after the gavage, was collected in presence of DPPIV inhibitor (Roche) to limit degradation of active GLP1. Rat plasma concentrations of active GLP1 was quantified on a Luminex MagPix200 analyzer using Milliplex rat gut hormone panel (RMHMAG-84K Merck Millipore).
Histology and Immunohistochemistry
As a routine process, when obese patients undergo RYGB surgery, a sample is taken from the jejunum in close contact to the anastomosis. When patients are operated on for
complication after RYGB, the gastro-jejunal anastomosis is resected and a sample of jejunum is taken 5 cm far from the anastomosis for analyses. RYGB patients were
undergoing re-operations for persistent ulcers, dumping syndrome or pouch dilations one to five years after the initial RYGB surgery (Please see TableS 1 for detailed description of the patients). In rats, gut segments were sampled as illustrated (Figure S1) fourteen days or forty days after surgery.
Rat and human samples were immediately fixed overnight in formalin. Three µm blank slides were cut from each block to perform either hematoxylin phloxine saffron (HPS) staining or immunostaining with Ki67, GLP1, Chromogranin A, GIP and GLUT1 antibodies.
4
Immunohistochemistry was carried out using an automated immunohistochemical stainer according to the manufacturer’s guidelines (Bond-Max autostainer, Leica, Wetzlar, Germany), after dewaxing and rehydrating paraffin sections and antigen retrieval by pretreatment with high temperature at pH 9. After antigen retrieval, tissue sections were immunolabelled with primaries antibodies used as follows: Rat Ki67 (Dako M7248): diluted 1:25, pH6; Human Ki67 (Dako M7240): diluted 1:100, pH9; Rat GLUT1 (spring bioscience E2844): diluted 1:200, pH6; Human GLUT1 (AnaSpec 53519): diluted at 1:200, pH6; Human Chromogranin A (DAKO M0869): diluted 1:250, pH6; Rat GIP (Peninsula Laboratories T-4053): diluted 1:3000, pH6; Rat GLP1 (Abcam AB26278): diluted 1:3000, pH9. Substitution of the primary antibody with PBS was used as a negative control. Subsequently, tissues were incubated with secondary antibody polymer for 10 min (Bond Polymer Refine detection; DS9800; Leica Microsystems) and developed with DAB-Chromogen for 10 min. Internal positive controls consisted in red blood cells for GLUT1 and nucleus of crypt cells for Ki67. Immunostainings were evaluated by two pathologists blinded to the clinical data AC and MH from the department of Pathology of Bichat Hospital. Each slide was scanned with an Aperio ScanScope® CS System (Leica Microsystemes SAS, Nanterre France). Morphometric analyses were performed using the Calopix Software (TRIBVN, Chatillon, France) on three to four distant sections per rat sample. The number of Ki67 immunoreactive cells per crypt was evaluated in 3-4 crypts from three to four cross sections from each intestinal limb for each animal. Averages were used for statistical analyses.
Reverse transcription and Quantitative Real-time PCR
Total RNA was extracted from frozen intestinal mucosa scrapings with TRIzol reagent (Invitrogen, Saint Aubin, France). One µg from each sample was converted to cDNA using the Verso cDNA Synthesis Kit (Thermo Scientific, Waltham, MA, USA). Primers were
designed using Roche assay design center or were based on previous studies; they were all synthesized by Eurogentec (Angers, France). Real-time PCR was perfomed using the Light
5
Cycler 480 system (Roche Diagnostics, Indianapolis, IN, USA) according to the
manufacturer’s instructions under the following conditions: 15 min denaturation at 95°C, followed by 50 cycles of 10 sec at 95°C, 45 sec at 60°C and 10 sec at 72°C. Melting curves were performed for each reaction, from 55°C to 95°C at 0.11°C/sec. Ct values of the gene of interest were normalized with two different reference genes (L19 and HPRT) which were chosen after multiple comparisons with numerous reference genes. The primers used in this study are presented below.
Gene NCBI Accession # Sequence
Glut1 NM_138827 GTGCTCGGATCCCTGCAGTTCG GGGATGGACTCTCCATAGCGGTG Glut2 NM_012879 AAAGCCCCAGATACCTTTACCT TGCCCCTTAGTCTTTTCAAGC Glut3 NM_017102 GCGCAGCCCTTCCGTTTTGC CGCTGGAGGATCTCCGTCGC Glut5 NM_031741 GCCTTCGGAGTGTCTTGG GGCAGGGACTCCAGTCAG Hif1α NM_024359 AAGCACTAGACAAAGCTCACCTG TTGACCATATCGCTGTCCAC Hprt NM_012583 GACCGGTTCTGTCATGTCG
6 ACCTGGTTCATCATCACTAATCAC L19 NM_031103 TGCCGGAAGAACACCTTG GCAGGATCCTCATCCTTCG Sglt1 NM_013033 GAAGGGTGCATCGGAGAAG CAATCAGCACGAGGATGAAC Vegf NM_031836 GAGTTAAACGAACGTACTTGCAGA TCTAGTTCCCGAAACCCTGA SGLT1 activity measurement
Intestine segments were opened along the mesenteric border and placed between the two halves of an Ussing chamber (Easy Mount P2312; Physiologic Instrument, San Diego, CA, USA) (exposed area: 0.50 cm2). Tissues were bathed with 4 ml of KRB solution with glucose 10 mM in serosal compartment and mannitol 10 mM in mucosal compartment. Solutions were gassed with 95% O2–5% CO2 and kept at a constant temperature of 37°C.
Electrogenic ion transport was monitored continuously as the short-circuit current (Isc) by an automated voltage clamp apparatus (DVC 1000; WPI, Aston, England, UK) linked through a Lab-Trax-4 interface to a computer. Tissue ionic conductance was calculated according to Ohm's law. Sodium-dependent glucose transporter SGLT1 was challenged by 10 mM glucose. Results were expressed as the difference (∆Isc) between the peak Isc (measured within 10 min) and the basal Isc (measured just before the addition of glucose).
7 Glucose transport and consumption assay
Glucose transport was assayed ex vivo using jejunal loop as described previously 1. Briefly, four 3-cm intestinal segments were filled with Krebs Ringer Bicarbonate Buffer solution containing 30 mM D-glucose with 0.1 μCi/ml [14C]-glucose (specific activity 49.5 mCi/mmoL) and with or without 100 µM phloretin, a glucose transporter inhibitor. Each segment were ligated at both ends and incubated in a 37°C thermostat-controlled bath of Krebs modified buffer at pH 7.4 continuously gassed with 95% O2-5% CO2. Mucosal-to-serosal and serosal-to-mucosal transport of glucose, were monitored using everted and non-everted isolated intestinal loops, respectively. Time dependent [14C]-glucose transport was determined by sampling from the bath at 0, 5, 10, 20, 30 and 60 min. At 60 min, isolated intestinal loops were collected, flushed, weighed, and homogenized with ultraturax for quantification of radioactivity. Radioactivity was measured using a beta counter (Beckman LS 6000 TA liquid scintillation counter). Apparent permeability (Papp) was used to assess transport according to the following equation Papp=(dQ/dt)·(V/Q0·A), where V is the volume of the incubation medium, A is the area of the loop, Q0 is the total radiolabeled glucose introduced into the loop and dQ/dt is the flux across the intestinal loop.
Positron emission tomography
Seven patients were retrospectively selected from the files of the department of nuclear medicine, Bichat Hospital, France. Three RYGB patients and four control patients (without gastro-intestinal diseases or cancer) had been evaluated with [18F]-FDG PET/CT for the detection of workup of thoracic tumours, Horton disease or detection of site of infection or inflammation. The patients were imaged on average 4 years after surgery (Please see Table S2 for detailed description of the patients). PET and CT were performed with a PET/CT hybrid system (Discovery 690; GE Healthcare). Imaging started 60 min after 18F-FDG injection with a non-enhanced, low-dose CT scan (120 kV, 80 mA), which was followed by a whole-body PET acquisition in 3-dimensional mode with an acquisition time of 4 min per bed
8
position. PET Imaging was performed only if the fasting glucose level was lower than 7.7 mmol/L before [18F]-FDG injection. Mean glycaemia was 4.9 ± 0.4 mmol/L in the RYGB group and 5.9 ± 1.1 mmol/L in the control group. [18F]-FDG was injected intravenously at a dose of 4 MBq/kg; mean dose was 295 ± 66 MBq in the RYGB group and 361 ± 110 MBq in the control group. [18F]-FDG PET acquisitions were interpreted using the Advantage
Workstation of the PET/CT system (GE Healthcare) by two experienced nuclear medicine physicians, who were blinded to the subject’s group status. Both physicians worked separately; then, in case of discrepancies, they reviewed the images together in order to reach a consensus. Image analysis was based on visual interpretation and semi-quantitative measurement of [18F]-FDG uptake. On visual analysis, abnormal hypermetabolic activity in the abdominal areas was classified as positive or negative and increased [18F]-FDG uptake in this area was confirmed on non–attenuation-corrected PET images.
Statistical analyses
Statistical analyses were performed with GraphPad Prism version 6.0 (GraphPad Software, SanDiego, CA, USA). Areas under the curves (AUC) were calculated using the trapezoid rule.
9
Table S1. Patients included for histologic analyses
Sexe Age BMI Indication for reoperation
Time after RYGB surgery (month) RYGB operated group* Patient 1 F 30 37 Persistent ulcer 12 Patient 2 M 32 36 Dumping syndrome 29 Patient 3 F 46 38,8
Weight regain and pouch dilation 36 Patient 4 F 50 39,9 Persistent ulcer 53 Patient 5 F 56 27,8 Persistent ulcer 60 Obese control group Patient 1 F 65 54,2 NA NA Patient 2 M 38 49,8 NA NA Patient 3 M 58 61 NA NA
*None of those patients have experienced intestinal obstruction or any other known issues which could have directly impacted the histologic characteristics of the samples.
10
Table S2. Patients included for [18F]-FDG PET/CT scan analyses
Sexe Age BMI
Time after RYGB surgery (month) RYGB operated group Patient 1 F 54 27,7 48 Patient 2 F 49 27,8 38 Patient 3 F 64 33,3 50 Control group Patient 1 M 73 28,8 NA Patient 2 F 80 29,1 NA Patient 3 F 56 36,7 NA Patient 4 M 49 27,7 NA
11 Text S1.
To evaluate the histologic and functional adaptation of the alimentary Roux limb after
surgery, we performed RYGB in diet-induced obese rats (Figure S2A and S2B). Male Wistar rats fed a high-fat diet for 4 months, were operated and subjected to post-operative care for 6 days before having access ad libitum to solid normal diet. The combination of surgical
procedure and postoperative care with liquid diet (caloric restriction) led to a substantial weight loss which was higher in RYGB compared to sham-operated rats (Figure S2C). Weight loss was primarily due to a decrease in food intake (Figure S2D) rather than malabsorption, since fecal calorie loss did not change significantly after surgery (Figure S2E). The incidental role played by malabsorption, compared to decrease in food intake, on weight loss has already been described in few studies2,3 . RYGB-operated rats displayed an improved oral glucose tolerance compared to preoperative state at 12 days post-surgery (Figure 4). Caloric restriction during intensive post-operative care period, weight loss and diet switch were not sufficient to trigger improvement of glucose tolerance in sham-operated rats compared to preoperative state (Figure 4). This data highlights the crucial role of surgery on initial post-operative glycemic improvement.
Text S2.
To directly compare the histologic and functional adaptation of the jejunum after VSG and RYGB, we performed VSG in diet-induced obese rats (Figure S6). Operated VSG and Sham rats were subjected to post-operative care for 3 days before having access ad libitum to solid normal diet. The combination of surgical procedure and postoperative care with liquid diet (caloric restriction) led to a substantial weight loss which was higher in VSG compared to sham-operated rats (Figure S6A). Weight loss was primarily due to a decrease in food intake (Figure S6B). Caloric restriction during intensive post-operative care period, weight loss and diet switch were not sufficient to trigger improvement of glucose tolerance in sham-operated rats at 12 days post-surgery compared to preoperative state (Figure 6F). On the contrary,
12
VSG-operated rats displayed an improved oral glucose tolerance compared to preoperative state at 12 days post-surgery (Figure 6F). This data highlights the crucial role of surgery on initial post-operative glycemic improvement. Of note, the difference in weight loss and food intake in Sham and RYGB-Sham rats is due to difference in post-operative care. VSG-Sham rats had access to normal food as soon as 4 days post-surgery and lost less weight than sham RYGB-Sham rats who had access to normal food ad libitum only after 6 days post-surgery (Figure S2C and S6A). However, jejunal adaptation and intestinal glucose handling 2 weeks post-surgery were not different between RYGB-Sham and VSG-Sham confirming that weight loss and caloric restriction per se were not responsible for intestinal adaptation and improved glucose tolerance observed after RYGB or VSG.
13 Figure S1. Sampling of intestinal segments
Figure S2.
(A) Postmortem macroscopic views of rat stomach 14 days after sham (upper panel) or RYGB surgery (lower panel). The RYGB procedure results in ingested food flowing from the esophagus (oe) to the gastric pouch (g.po) and then directly to the jejunum (jej) of the Roux limb, bypassing the distal stomach (d.st), the duodenum (du), and part of the proximal jejunum.
(B) Postmortem view of the gastrointestinal tract of a rat after RYGB surgery, showing the lengths of the Roux limb, biliopancreatic limb (which drains gastric, hepatobiliary and pancreatic secretions), and common limb after RYGB with, in continuity, the cecum and the colon. The red dotted line indicates the new path followed by food.
(C) Loss of body weight after surgery in RYGB- (n = 11) and sham-operated rats (n = 9). The black box corresponds to the period of postoperative care (5 days) before the animals had free access to solid normal diet. The data shown are means ± SEM.
(D) Changes in daily calorie intake after surgery. The dotted line indicates mean calorie intake before surgery. The data shown are means ± SEM. **P < 0.01, ***P < 0.001, versus preoperative value, in Mann-Whitney tests.
(E) Loss of fecal calories, determined by bomb calorimetry analyses of stools collected on day 12 after surgery. Results are expressed as a percentage of calorie intake.
Figure S3.
(A) Morphometric analyses showing the mucosal area of RL and BPL sections of rats
subjected to RYGB surgery (n = 5), compared with the corresponding jejunum segment from sham-operated rats (Jej) (n = 5) 40 days after surgery. Data are means ± SEM. **P < 0.01 versus sham-operated rats, based on ANOVA with Bonferroni correction for multiple comparisons.
14
(B) Morphometric analyses showing the mucosal area of sections from VSG-rats (n = 5), compared with the corresponding jejunum segment from sham-operated rats (n = 5) 40 days after surgery. Data are means ± SEM. NS, not significant, in Mann-Whitney tests.
Figure S4.
Plasma active GLP1 levels in fasted rats (A) or 30min after an oral load of glucose (1g/kg) (B) 12 days after RYGB (n = 5) VSG (n = 4) or sham surgery (n = 3). Data are means ± SEM. *P < 0.05 (vs. sham), in two-way ANOVA with Bonferroni correction for multiple comparisons.
Figure S5.
(A and B) Relative mRNA levels of sugar transporters and hypoxia inducible genes in the biliopancreatic limb mucosa (A) 14 days (n = 4) and (B) 40 days (n = 6) after RYGB. The dotted line indicates the mean mRNA level of the corresponding genes in jejunal mucosa from sham-operated rats (n = 5). Data are means ± SEM. *P < 0.05, versus sham-operated rats, in Mann-Whitney tests.
Figure S6.
(A) Loss of body weight after surgery in VSG- (n = 9) and sham-operated rats (n = 7). The black box corresponds to the period of intensive postoperative care (3 days) before the animals had free access to solid normal diet. The data shown are means ± SEM. (B) Changes in daily calorie intake after surgery. The dotted line indicates mean calorie intake before surgery. The data shown are means ± SEM. ***P < 0.001, versus preoperative value, in Mann-Whitney tests.
15 Supplemental References
1. Tavernier A, Cavin J-B, Gall ML, et al. Intestinal deletion of leptin signaling alters activity of nutrient transporters and delayed the onset of obesity in mice. FASEB J.
2014;28:4100–4110.
2. Odstrcil EA, Martinez JG, Ana CAS, et al. The contribution of malabsorption to the reduction in net energy absorption after long-limb Roux-en-Y gastric bypass. Am. J. Clin. Nutr. 2010;92:704–713.
3. Sandoval D. Bariatric surgeries: beyond restriction and malabsorption. Int. J. Obes. 2011;35:S45–S49.
Figure S1
Figure S2
Figure S3
Figure S4
Figure S5
Figure S6
Movie S1
Revised Manuscript in Word or RTF (no changes marked)
![Table S2. Patients included for [18F]-FDG PET/CT scan analyses](https://thumb-eu.123doks.com/thumbv2/123doknet/15001004.675721/39.892.91.556.363.1101/table-patients-included-fdg-pet-ct-scan-analyses.webp)
