HAL Id: insu-02263350
https://hal-insu.archives-ouvertes.fr/insu-02263350
Submitted on 12 Mar 2021
HAL is a multi-disciplinary open access
archive for the deposit and dissemination of
sci-entific research documents, whether they are
pub-lished or not. The documents may come from
teaching and research institutions in France or
abroad, or from public or private research centers.
L’archive ouverte pluridisciplinaire HAL, est
destinée au dépôt et à la diffusion de documents
scientifiques de niveau recherche, publiés ou non,
émanant des établissements d’enseignement et de
recherche français ou étrangers, des laboratoires
publics ou privés.
Geocoronal Lyman β and Balmer α emissions measured
during the Apollo 16 mission
R. R. Meier, G. R. Carruthers, T. L. Page, Anny Chantal Levasseur-Regourd
To cite this version:
R. R. Meier, G. R. Carruthers, T. L. Page, Anny Chantal Levasseur-Regourd.
Geocoronal
Lyman β and Balmer α emissions measured during the Apollo 16 mission.
Journal of
Geo-physical Research Space Physics, American GeoGeo-physical Union/Wiley, 1977, 82 (4), pp.737-739.
�10.1029/JA082i004p00737�. �insu-02263350�
VOL. 82, NO. 4 JOURNAL OF GEOPHYSICAL RESEARCH FEBRUARY 1, 1977
Geocoronal Lyman and Balmer a Emissions
Measured
During the Apollo 16 Mission
R. R. MEIER, G. R. CARRUTHERS, AND T. L. PAGE
E. O. Hulburt Center for Space Research, Naval Research Laboratory, Washington, D. C. 20375
A.-C. LEVASSEUR-REGOURD
Service d'Adronomie du Centre National de la Recherche Scientifique, Verridres-le-Buisson, France
Observations of the geocoronal Lyman fl emission rate were made with an electrographic cam-
era/spectrograph during the Apollo 16 mission. These data along with geocoronal Balmer a airglow
measurements obtained simultaneously from the D2A spacecraft are found to agree, to within experimen-
tal error, with an optically thick geocoronal hydrogen model.
INTRODUCTION
The first far ultraviolet spectrum of the terrestrial atmo-
sphere in the wavelength range 500-1100,4, was made from the
lunar surface during the Apollo 16 mission [Carruthers and Page, 1976a, b]. Among the spectral features observed was the
Lyman fl (Ly fl) airglow line of atomic hydrogen at 1025.72
Since this is the only spectrally pure measurement of this emission feature yet obtained, we present in this paper a de- tailed discussion of the Ly fl emission rate, comparing it with
observations of the Balmer a (Ba a) emission rate at 6562.8
which were obtained nearly simultaneously from the French
D2A spacecraft. Both of these emissions result from excitation
of geocoronal hydrogen to the n = 3 quantum level by the solar Ly /• flux; subsequent transitions occur either to the ground state (Ly B) or to the n = 2 level (Ba a). The theoretical relationships between these emissions and the exciting solar flux are obtained by utilization of the theory of radiative transport in a spherical optically thick atmosphere.
DATA ANALYSIS
The Ly/• observations were made with an electrographic Schmidt camera using film to record the images. (For details of the instrument, see Carruthers [1973], Carruthers and Page [1976a, b], and Carruthers et al. [1976].) The system could be utilized without additional optics for direct imagery or with an objective grating and electroformed grid collimator for spectra. A LiF corrector plate was used to improve the resolu- tion of the camera for observations at wavelengths longward
of 1050,4,, but the instrument was used without a corrector
(giving somewhat poorer spectral resolution) for spectrog-
raphy at wavelengths below 1050,4,.
An isodensitometric plot of a terrestrial airglow spectrum was given in Figure 5 of Carruthers and Page [1976b]. The spectrograph 'slit' was oriented at an angle of about 25 ø to the earth-sun line and slightly displaced from the center of the earth. A sketch of the observing geometry is shown in the insert of Figure 1. The observation was made on April 21, 1972, when the sun-earth-moon angle was 105 ø. Because of the limited density resolution provided by isodensity contour plots of the type analyzed in their paper it was not possible to use the coarse density intervals shown in Figure 5 of Carruthers and Page [1976b] to measure very low densities in the spectra reliably and to remove the effects of backgrounds due to both
Copyright ¸ 1977 by the American Geophysical Union.
Paper number 6A0821.
scattering in the camera and the rather low spectral resolution.
Ghost lines and instrumental scattering of the intense Ly a line
were not properly taken into account in the previous work. Therefore we resorted to the use of digitized printouts of the film density values to correct for these effects. Examples of such digitized printouts are given by Carruthers and Page [1976a]. Correcting for the above-mentioned backgrounds is a subjective exercise, so we conservatively took the uncertainties
of the derived emission rates to be those resulting from use of
the extreme limits of the allowable background. The result is rather large (but confident) error bars on the data. The de- graded spatial resolution (perpendicular to the dispersion) in the correctorless mode yielded an uncertainty of about 4-500 km at the earth in the position of a given density contour. Uncertainty in the location of the contours far from the earth is increased due to the low density levels on the film.
LYMAN fl RESULTS
Figure 1 shows the emission rate of Ly/• as a function of distance along the spectrograph slit. The 'O' is referenced to the point of closest approach of the slit to the center of the earth.
Data near the sunlit limb and the sunlit disc of the earth were
deleted from the figure because of probable contamination
from other thermospheric emission lines, such as O I 1027
The altitude to which such contamination is significant can be estimated from the profiles (perpendicular to the dispersion) of other features due to O, N:, etc., all of which (unlike hydro- gen) have emission scale heights that are small in comparison to the camera resolution. Data given to the right of the break in Figure 1 (2000 to -6000 km) are from the portion of the slit
covering the shadowed earth disc. Much of the emission there
comes from sunlit hydrogen in the foreground, above the shadowed atmosphere. The calibration is given by Carruthers and Page [1976b] as 8.2 X l0 -4 density unit (kR s) -• and is
thought to be accurate to within 4-25%.
The solid line in Figure 1 is the result of solving the optically thick spherical radiative transport equations for a thre;e-level H atom. (See Meier [1969] for details of the formalism.) Reso- nant scattering of the solar Ly/• line is the excitation mecha- nism. The hydrogen density model was essentially the same as
that used to analyze Ly a images [Carruthers et al., 1976] and
other airglow observations [Meier and Mange, 1973]. For a
model normalized to 3 X l0 7 atoms cm -8 at 100 km, T = 1000
K, and a critical satellite altitude of Rsc = 2.5 (see Chamber- lain [ 1963] for the definition of this parameter), the densities at
738 MEIER ET AL.' BRIEF REPORT 120 11o lOO 9o 8o n- 70 bJ <[ 60 z o 5o "' 40 3O 2O 10 APOLLO 16 LYMAN - 21 APRIL 1972
-
-
16 14 12 10 8 2 0 -2 -4 -6DISTANCE ALONG SLIT (i0 $ kin)
Fig. 1. Lyman • emission rate as a function of distance along the spectrograph slit. The distance scale is measured from the closest approach of the slit to the center of the earth, indicated by O in the insert at the upper right. Positive values are
toward the sunlit hemisphere. The solid line is the result of multiple scattering calculations with an optically thick
geocorona.
altitudes of 500, 5000, and 50,000 km are 80,000, 4800, and 27 atoms cm -3, respectively.
The agreement between the model and observation is good, in spite of the uncertainties in the data. The normalization in Figure 1 requires a solar Ly • flux of 8.2 X 10⁹ photons cm -2
s -• •-• at the center of the line.
If the data were more precise, it would be of interest to
compare the ratio of the Ly a and Ly • emission rates. At high
altitudes, where the geocorona is optically thin to both radi-
ations (• 20,000 km above the earth surface), the airglow ratio would yield the ratio of the solar emission line fluxes at the
center of the line. At lower altitudes, where the geocorona
becomes
thick to'Ly a but is still thin to Ly •, their ratio would
be a good measure of the multiple scattering component of the Ly a emission rate, which is related to the absolute value of the hydrogen column density. Although the Apollo 16 data were not sufficiently accurate to warrant a detailed analysis with multiple scattering models, it is of interest to note that the
observed ratio of the Ly a [Carruthers et al., 1976] to Ly/•
(using the crosses in Figure 1) ranged from near 200 at 15,000 km (along the spectrograph slit) to near 100 at 9000 km.
Unfortunately, the Ly/• feature was too weak to measure at altitudes where the Ly a is optically thin.
BALMER ot RESULTS
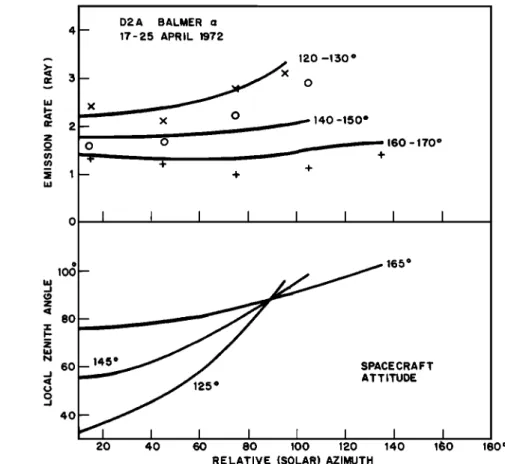
During the period of the Apollo 16 mission the French D2A spacecraft was operational. Among the experiments was an instrument designed to measure the geocoronal Ba a emission rate [Levasseur and Blamont, 1973; Levasseur, 1976], which is also excited by the solar Ly • line. Ba a data were obtained for several nights covering the Ly • observation. Since the Ba a
emission rate at night is very low (,-,2 R at midnight), all data obtained between April 17 and 25, 1972, were averaged for the same look directions in local coordinates to improve the statis- tics. A sample of these data is shown in Figure 2. The in- tensities were put into solar zenith angle (of the spacecraft) bins of 10 ø width and plotted as a function of azimuth relative to the sun. The statistical uncertainty is less than 0.6 R for each
bin. The absolute calibration is thought to be accurate to
within 10% [Levasseur et al., 1976]. The line of sight of the instrument was normal to the spacecraft spin axis, which pointed toward the sun. Thus the angle of the line of sight to local zenith depended on azimuth and solar zenith angle [see
Levasseur and Blamont, 1973]. The local zenith angle is plotted
in the lower part of Figure 2. The solid lines in the data plot are the result of computations with the model of Figure 1
modified for the Ba a transition.
The solar Ly • flux required to fit the Ba a data (a total of 22
averaged
intensity
points)
was
4.9 X 10⁹
photons
cm-' s
a value which is only about 60% of that required by the Ly airglow. The lower solar flux is more consistent with a recent analysis of a larger set of D2A and ground-based Ba a mea- surements [Levasseur et al., 1976]. Even though the Ly/• data
were obtained on the sunlit geocorona and the Ba a at night
and both were compared with a spherically symmetric average hydrogen model, it is likely that the differences in the required
solar flux can be attributed to data and calibration uncer- tainties.
PreVious comparisons of the Ly • and Ba a geocoronal
emissions
were
made
by Weller
et al. [1971]. While a higher
solar Ly • flux was required by their analysis (1.75 X 10 xø
MEIER ET AL.' BRIEF REPORT 739 lOO z 80 z N •o o •o , f D2 A BALMER a 17-?_5 APRIL 1977_ 120 -150 ø x o
__
x •
140
-150
ø
0
•_••
160
- 170
ø
+ + 165 ø SPACECRAFT ATTITUDE 20 40 60 80 I00 120 140 160 100 øRELATIVE (SOLAR) AZIMUTH
Fig. 2. Balmer
a emission
rate
as a function
of spacecraft
line
of sight
altitude
coordinates.
The
crosses,
open
circles,
and
pluses
are
for solar
zenith
angles
in the range
120ø-130
ø
, 140ø-150
ø
, and
160ø-170
ø
, respectively.
Spacecraft
attitude
coordinates are given for mean values of these solar zenith angle ranges.
surement of the Ly • airglow appears to have contained addi-
tional emission
features
in the 800- to 1100-• wavelength
interval. Furthermore, reanalysis of ground-based Ba a obser- vations requires a downward revision in the old airglow values
[Levasseur et al., 1976]. Both of these considerations have the effect of reducing the deduced value of the solar flux. Thus the
Ly /• airglow values computed by Meier [1974] should be revised downward in absolute value by a factor of 2-4, since he used the high solar flux of Weller et al. [1971].
SUMMARY
The first spectrally pure observation of the geocoronal hy- drogen emission of Ly • is reported here. Although uncer- tainties in the data lead to rather large error bars, the most likely values of the emission rate agree with those computed from 'standard' models of the geocorona. Comparison of the
model with simultaneous measurements of the Ba c• emission
rate from the D2A spacecraft also shows agreement to within experimental uncertainty. The solar flux required to produce the airglow emission rates is within +25% of 6.5 X 10⁹ photons
cm-: s
-• ,•-•. The lower
and
upper
limits
are the best
fits
to the
Ba a and Ly •5 data, respectively.
Acknowledgment. The Editor thanks B. A. Tinsley for his assist-
ance in evaluating this report.
REFERENCES
Carruthers, G. R., Apollo 16 far-ultraviolet camera/spectrograph:
Instrument and operations, Aœœl. Opt,, 12, 2501 1973.
Carruthers, G. R., and T. L. Page, Apollo 16 far ultraviolet imagery of
the polar auroras, tropical airglow belts, and general airglow, J.
Geophys. Res., 81,483, 1976a.
Carruthers, G. R., and T. L. Page, Apollo 16 far ultraviolet spectra of
the terrestrial airglow, J. Geophys. Res., 81, 1683, 1976b.
Carruthers, G. R., T. L. Page, and R. R. Meier, Apollo 16 Lyman
alpha imagery of the hydrogen geocorona, J. Geophys. Res., 81,
1664, 1976.
Chamberlain, J. W., Planetary coronae and atmospheric evaporation,
Planet. Space Sci., 11,901, 1963.
Levasseur, A.-C., Observations atmosph6riques et astronomiques au
voisinage de 6563 ,4, h bord du satellite D2A, th•se de doctorat
d'6tat, Univ. Pierre et Marie Curie (Paris VI), Paris, 1976.
Levasseur, A.-C., and J. E. Blamont, Satellite observations of strong
Balmer alpha atmospheric emissions around the magnetic equator,
J. Geophys. Res., 78, 3881, 1973.
Levasseur, A.-C., R. R. Meier, and B. A. Tinsley, Resolution of the
discrepancy between Balmer a emission rates, the solar Lyman/•
flux, and model• of geocoronal hydrogen concentration, J. Geophys.
Res., 81, 5587, 1976.
Meier, R. R., Balmer alpha and Lyman beta in the hydrogen geoco-
rona, J. Geophys. Res., 74, 3561, 1969.
Meier, R. R., A survey of the ultraviolet airglow from 1216 •, to 304
•, Ann. Geophys., 30, 91, 1974.
Meier, R. R., and P. Mange, Spatial and temporal variations in the
Lyman-alpha airglow and related atomic hydrogen distributions,
Planet. Space Sci., 21, 309, 1973.
Weller, C. S., R. R. Meier, and B. A. Tinsley, Simultaneous measure-
ments of the hydrogen airglow emission of Lyman alpha, Lyman
beta, and Balmer alpha, J. Geophys. Res., 76, 7734, 1971.