HAL Id: hal-02901664
https://hal.archives-ouvertes.fr/hal-02901664
Preprint submitted on 17 Jul 2020
HAL is a multi-disciplinary open access archive for the deposit and dissemination of sci-entific research documents, whether they are pub-lished or not. The documents may come from teaching and research institutions in France or abroad, or from public or private research centers.
L’archive ouverte pluridisciplinaire HAL, est destinée au dépôt et à la diffusion de documents scientifiques de niveau recherche, publiés ou non, émanant des établissements d’enseignement et de recherche français ou étrangers, des laboratoires publics ou privés.
Access-for-all to Financial Services: Non- resources Tax
Revenue-harnessing Opportunities in Developing
Countries
Ali Compaore
To cite this version:
Ali Compaore. Access-for-all to Financial Services: Non- resources Tax Revenue-harnessing Opportu-nities in Developing Countries. 2020. �hal-02901664�
Access-for-all to Financial Services:
Non-resources Tax Revenue-harnessing Opportunities
in Developing Countries
Ali Compaoré†
Abstract
Financial inclusion refers to access to and use of formal financial services by individuals and businesses and the literature unambiguously documented that access-for-all to financial services is conducive to important economic and development outcomes. In this paper, we particularly investigate the impact of financial inclusion on non-resources tax revenue in developing countries. Based on a sample of 63 developing countries over the period 2004-2017 and drawing on the dynamic generalized method of moments (GMM), the paper finds that greater access to financial services captured by the number of ATMs per 100,000 adults increases government non-resources tax-to-GDP ratio, and this result is driven by households consumption and business expansion. Our findings provide insights on tax resources-harnessing opportunities from implementing and promoting financial inclusion policies for developing economies.
JEL Codes: G21; H20; O11; O23.
Key words: Financial inclusion, Non-resource tax-to-GDP ratio, Private consumption, Unemployment, Developing countries.
« Finance is the oxygen to the rest of the economy. It enables business to grow and people to manage risk. If you don’t have finance, life is a lot more difficult. »
Peter Sands
† School of Economics – CERDI / CNRS - Université Clermont-Auvergne, Clermont-Ferrand /
2
I. Introduction
Financial inclusion refers to access to and use of formal financial services by individuals and businesses (Sahay et al., 2015a).2 A broader definition considers, in addition to the access and use of financial services, further aspects including the quality and range, usefulness and appropriateness, affordability, sustainability, and awareness of financial services and products as well as the consumer protection (Grace et al., 2014; SBS 2014; BSP 2015; World Bank 2018;
Jahan et al., 2019; and Espinosa-Vega et al., 2020), making financial inclusion a multifaced concept. The measurement of financial inclusion also remains an important issue in the empirical literature given to its multidimensional aspect. While some components are particularly more easily capturable, others dimensions are not readily observable.3 Over recent years, increasing attention has been paid to financial inclusion among both, policy-makers and academics considered as a key factor to achieve the 2030 Sustainable Development Goals (SDGs). Financial inclusion has become a priority of policy agenda in a number a of economies across the globe, with more than 50 countries having adopted a National Financial Inclusion Strategy (Espinosa-Vega et al., 2020).
The consensus in the literature is that access-for-all to financial services is conducive to important economic and development outcomes, though access to finance still constitutes a major constraint for business creation and expansion in developing countries (World Bank, 2014; Demirgüç-Kunt et al., 2015). Financial inclusion is important for inclusive and sustainable economic growth and non-access to formal financial services including bank account entails greater cash transactions is associated with higher transaction fees and financial risks (Lusardi, 2010). Greater financial inclusion positively affects the GDP, while reducing inequality in developing and emerging (Dabla-Norris et al.,2015). Similarly, focusing on Latin America and the Caribbean (LAC) countries, Dabla-Norris et al. (2015) conclude that easing financial services access including relaxing collateral constraints helps reduce inequality and spur growth. Using a wide sample of 123 countries, Allen et al. (2015) highlight that financial inclusion is associated with stronger legal rights and more politically stable environments. Micro level and field experiment studies evidenced that microfinance branch expansion and access to credit facilities is conducive to business expansion and entrepreneurial activities
2 Financial inclusion is different from financial development. The latter occurs when financial instruments,
markets, and intermediaries ameliorate – the effects of information, enforcement, and transactions costs and therefore do a correspondingly better job at providing the five financial functions (Levine, 2005) – though the former is a dimension of the latter (see e.g. Sahay et al., 2015). In addition, a more financial development may allow greater access to financial services as emphasized in Rajan and Zingales (2003).
3
development (Bruhn and Love, 2014; Angelucci, et al., 2015; Fareed et al., 2017). Similarly,
Banerjee et al. (2010) show that access to microcredit increases small business investment and profits of preexisting businesses in India. Focusing on the Bosnia, Augsburg et al. (2015) also highlight that lower rejection of households’ formal loans applications induces higher self-employment, increases in inventory and an increase in the labor supply in the household’s business. Similarly in rural Kenya, Dupas and Robinson (2011) provides a strong evidence that extending basic banking services (e.g. saving accounts) is associated to an increase in the size of market women businesses. In line with the disciplining effect of group lending, Attanasio et al., (2011) find a positive impact of access to group loans on entrepreneurship in Mongolia. Access to group loans increases the likelihood of owning an enterprise by 10 percent.
Financial inclusion is found be an important tool for empowering women and strengthening female decision-making power in developing countries. Ashraf et al. (2010) relying on a randomized controlled trial finds that access to basic financial service such as saving accounts is associated to an greater in female decision-making power within the household in the Philippines.
The literature also asserted that financial inclusion positively affects households consumption as well as households income (Banerjee et al. 2010; Karlan and Zinman, 2010; Attanasio et al., 2011;Dupas and Robinson, 2011; Bruhn and Love, 2014; Zhang and Posso, 2017). Access to financial services allows households to respond to income shocks by raising their current consumption (Bhattacharya and Patnaik, 2015) and facilitates households consumption smoothing and softens output volatility cost (Mehrotra and Yetman, 2015). In addition, greater access to financial services encourages households’ saving. Aportela (1999), based on natural experiment shows that the financial inclusion increased the average saving rate of households by around 5 percentage points and this effect was even higher for the poorest households in Mexico. Furthermore, access to financial service favors human capital development and increases jobs opportunities (Demirgüç-Kunt et al., 2008). For instance De Gregorio (1996) on an overlapping generations model with endogenous growth highlights that access to financial services is associated with an increase in human capital accumulation and growth in OECD and developing countries.
Subsequent studies explored the impact of access to financial services on the level of poverty (Burgess et al., 2005; Burgess and Pande, 2005; Honohan, 2004a,b; Honohan, 2005, 2006;
4
al., 2015; Rewilak, 2017) and find that access to basic financial services is associated with a decrease in the poverty rates. For instance, Coulibaly and Yogo (2018) recently evidenced that improving financial outreach through additional bank branches reduces the number of poor workers in developing countries.
Nevertheless, parallel to this literature, some studies have documented that a greater access to financial services without proper financial supervision might be harmful to economic outcomes and result into financial distress (Rajan, 2010; Han and Melecky, 2013; Sahay et al., 2015). For instance high financial inclusion combined with a boom in access to credit is associated to a deterioration in credit quality and thereby leading to financial risks (Mehrotra and Yetman, 2015). In addition, Dabla-Norris et al. (2015) analyzing factors constraining firms to access to finance find that greater access to credit could result in bank instability by increasing non-performing loans.
Although Čihák and Sahay (2018) postulate that inclusive financial systems can increase the effectiveness of fiscal policy by broadening the tax, studies exploring the potential effect of accessing to financial services on government tax revenue are very scarce (Oz-Yalaman, 2019). In addition, studies particularly focusing in developing countries and using non-resources tax revenue is non-existent. To the best of our knowledge, our paper is therefore the first to provide a strong and convincing evidence on the nexus between financial inclusion and non-resources tax ratio in developing countries. Our contribution to the literature relies on the use of comparable4 tax revenue ratio excluding natural resources revenue. As underscored in Caldeira et al. (2020), distinguishing resource from non-resource revenue is highly relevant to understand tax capacity in developing countries and the literature has well-documented a
crowding-out effect between resources revenue and non-resource tax revenue (Bornhorst et al., 2009; Crivelli and Gupta, 2014; James, 2015 among others). In addition, unlike the empirical method employed in Oz-Yalaman (2019), we adopted a dynamic specification to account for the inertia in government tax revenue.
Using a sample of 63 developing countries over the period 2004-2017 and drawing on the dynamic generalized method of moments (GMM) to solve the endogeneity and any reverse causality issue, the paper shows that greater access to financial services captured by the number of ATMs per 100,000 adults increases government non-resources tax-to-GDP ratio. Looking at
4Oz-Yalaman (2019) explored the nexus between financial inclusion and tax revenue but using different sources
of total tax revenue and tax subcomponents. This entails important shortcomings since the datasets are not strictly comparable (Sahay et al., 2015).
5
the tax revenue structure, the results show that indirect taxes revenue accounts the most sizeable positive effect of increased penetration of ATMs on tax revenue. Exploring the channels through which financial inclusion influences non-resource tax ratio, our empirical results highlight that the positive effect of greater access to financial services mainly operates through private consumption and business expansion. Our results survive to a battery of robustness exercises including: (1) adding more control variable namely the level of education, inflation, the population size, external aid received, domestic financial sector development, remittances inflows and the tax structure, (2) the use of alternative financial inclusion measures to capture the multifaceted aspect of our interest variable and (3) using alternative tax data source. This paper provides insights to countries that have implemented or are in the process of implementing financial inclusion policies, on tax revenue-harnessing opportunities from access-for-all financial services.
The remainder of the paper is structured as follows: the second section describes the econometric methodology and introduces the dataset with some stylized facts. Section 3 presents the baseline results from the empirical specification and considers some robustness checks. Section 4 provides concluding remarks and draws policy implications.
II. Empirical methodology and data A. Econometric model
The following dynamic panel model that captures the impact of financial inclusion on non-resources tax revenue was estimated:
𝑁𝑅𝑇𝑎𝑥𝑖,𝑡 = 𝛼 + 𝛽𝑁𝑅𝑇𝑎𝑥𝑖,𝑡−1+ 𝜓𝐹𝐼𝑛𝑐𝑖,𝑡+ 𝒁𝑖,𝑡𝛿 + 𝜆𝑖 + 𝜁𝑡+ 𝜀𝑖𝑡 Eq.[1]
𝑁𝑅𝑇𝑎𝑥𝑖,𝑡 is the non-resource tax-to-GDP ratio for country 𝑖 at time 𝑡. We included the one-period lagged value of the dependent variable –𝑁𝑅𝑇𝑎𝑥𝑖,𝑡– because of the inertia in the total tax revenue. 𝐹𝐼𝑛𝑐𝑖,𝑡 is the financial inclusion indicator and 𝒁𝑖,𝑡 is a set of variables that explain the government tax revenue ratio. 𝜆𝑖 and 𝜁𝑡 denote time-invariant country-level characteristics and time-varying factors, respectively that could potentially affect the tax ratio. The last term, 𝜀𝑖𝑡 is an idiosyncratic disturbance.
Taking stock of previous literature on the principal determinants of the tax share in GDP, the vector 𝒁𝑖,𝑡 includes inter alia the level of development, the sectoral composition of value added (i.e. agriculture and natural resources), the trade openness and the quality of institutions. The
6
real GDP per capita is commonly used to capture countries’ overall level of development. Countries’ tax capacity is intrinsically related to their level of development (Lotz and Morss, 1967; Tanzi 1983; Pessino and Fenochietto, 2010; Fenochietto and Pessino, 2013; Crivelli and Gupta, 2014). High income countries are expected to raise more tax revenue than developing countries due to the more efficient and strong tax administration, higher degree of economic and institutional sophistication. To capture the non-linearity effect of the level of development and tax capacity, we include the squared of this variable in the specification.
Trade openness refers to the volume of international trade in the GDP. Substantial increase in trade volume makes it more amenable to taxation through domestic consumption and corporate profits (Chelliah et al., 1975; Leuthold, 1991; Tanzi, 1992; Stotsky and WoldeMariam, 1997;Stotsky and WoldeMariam, 2006; Pessino and Fenochietto 2010; Gnangnon and Brun, 2018).
The effect of natural resources rents on tax revenue ratio is widely evidenced in the literature but remains controversial. While pioneering studies evidenced a positive effect of natural resource rent on tax revenue (Cheliiah et al., 1975 and Tanzi, 1992), recent resource curse literature highlights a negative association between natural resources rents and government tax revenue, suggesting a crowding-out effect (Sachs and Warner, 2001; Eltony, 2002; Bornhorst et al., 2009; McGuirk, 2013; Crivelli and Gupta, 2014; James, 2015; Belinga et al. 2017). Therefore, effect of natural resources rents on tax revenue is à priori ambiguous.
The share of agriculture in the GDP is found to be negatively associated with non-resources tax ratio (Cheliiah et al., 1975; and Tanzi, 1992; Stotsky and WoldeMariam, 2006). Developing countries are still featured by large shares of subsistence agricultural sector exerted by small farmers which is not generating taxable surpluses. In addition, this sector is more often subject to tax exemptions considered as sector providing food for subsistence (Stotsky and WoldeMariam, 2006)
We proxy the quality of institutions by the polity2 index assessing the degree of democracy. High and strong economic and political institutions are expected to promote adequate tax administrations allowing more tax revenue collection (Davoodi and Grigorian, 2007); Gupta, 2007;Gordon and Li, 2009;Clist and Morrissey, 2011;Fenochietto and Pessino, 2013;Feger and Asafu-Adjaye, 2014), while lower quality of institutions portrayed by higher corruption is a threat for tax revenue collection as it affects tax administration and tax officers and occasioning
7
Equation [1] is a dynamic specification since the non-resource tax-to-GDP ratio at period 𝑡 depends on its own past realizations. Thus, relying on classical linear Ordinary Least Squares (OLS) estimator would lead to inconsistent and biased results (Nickel, 1981; Wooldridge, 2002). The appropriate estimator for dynamic panel data models appears to be the popular Generalized Method of Moments (GMM). The GMM estimator is designed for dynamic specifications with “small-T, large-N”5 panels and allows to tackle potential issues of endogeneity, simultaneous and omitted variables bias. Hence, this estimator will allow, not only to correct the possible endogeneity of our interest variable –financial access– but also to correct for endogeneity of all right-hand side variables by using the lagged values as instruments (one to two lags). Our analysis specifically relied on the system-GMM proposed by Blundell and Bond (1998) with the two-step estimator. However, the validity of the GMM estimation relies on the main assumption that instruments are exogenous (Roodman, 2009). Therefore we resort to Hansen’s test for over-identifying restrictions to check the validity of the instruments. Another condition that validates the GMM estimator is the absence of second-order serial correlation in the residuals in difference. Accordingly, the Arellano-Bond's test is used check that condition.
B. Data and some stylized facts
The study is conducted on a sample of 62 developing countries over the period 2004-2018, based on data availability.6 The dataset consists in an yearly unbalanced panel because of missing observations and is compiled from various sources including the World Bank’ Worldwide Development Indicators (WDI), the International Monetary Fund’s World Economic Outlook (WEO), Penn World Tables (PWT9.1) and the Polity4 project.7
Tax revenue data come from the most recent ICTD/UNU-WIDER, Government Revenue Dataset8 (henceforth ICTD dataset) thought there are currently several of available sources of cross-country tax revenue data including the World Bank, the Organization for Economic Co-operation and Development (OECD), and the Comisión Económica para América Latina y el Caribe (CEPAL). This dataset combines several major international databases, as well as
5 Meaning few time periods and many individuals, which is the case with our sample.
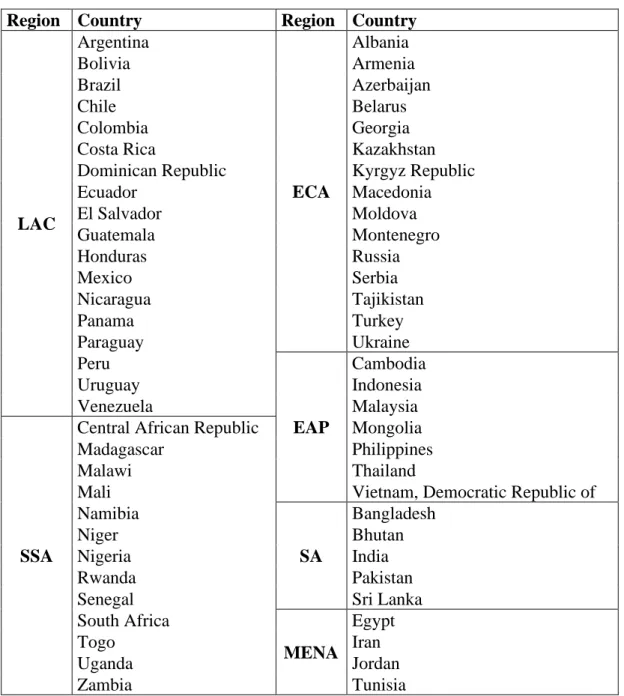
6 The developing countries category considered in this paper refers to the World Bank income classification, hence
including low-income and middle-income countries. The complete country list by region is provided in Table A1 of Appendices.
7 See Table A2 for complete definition and sources of variables. 8 The database is available at https://www.ictd.ac/dataset/grd/
8
drawing on data compiled from all available International Monetary Fund (IMF) Article IV reports (Prichard et al., 2014). ICTD dataset has the advantage to be available for a large number of developing countries which is the focus of this study. More importantly, unlike alternative databases, ICTD dataset has the particularity to exclude natural resource revenue tax revenue9, then providing a non-resource tax revenue data. As stressed in Caldeira et al. (2020), distinguishing resource from non-resource revenue is highly relevant to understand countries’ tax effort and some studies in the literature highlight a crowding-out effect between resources revenue and non-resource tax revenue (Bornhorst et al. 2009; McGuirk, 2013; Crivelli and Gupta, 2014). A competing rich non-resource tax revenue dataset was developed by Mansour (2010) covering 1980-2010 and recently updated to 2015 (see Caldeira et al.,2020). However, this database only focuses on 42 Sub-Saharan African countries. We therefore relied on ICTD dataset for coverage purpose. Tax data used in this paper cover six tax series namely: (i) total tax revenue; (ii) indirect taxes; (ii) direct taxes; (iv) income taxes; (v) taxes on goods and services, and (vi) value-added tax, all expressed as percentage of GDP.
Data on financial inclusion are extracted from the IMF’s Financial Access Survey database10 and include 8 indicators of financial access : (i) the number of automated teller machines (ATMs) per 100,000 adults; (ii) the number of commercial bank branches per 100,000 adults; (iii) the number of loan accounts with commercial banks per 1,000 adults; (iv) number of depositors with commercial banks per 1,000 adults; (v) number of credit unions and credit cooperatives; (vi) outstanding deposits with commercial banks; (vii) number of depositors with commercial banks, and (viii) loan accounts with commercial banks. Higher values of these indicators suggest a greater degree of financial access.
Focusing on the number of ATMs per 100, 000 adults, the Figure 1 shows an upward trend in developing countries, suggesting that financial access is advancing. More precisely, the number of ATMs/ 100,000 adults recorded a considerable progress moving form 13 ATMs per 100, 000 adults in 2004 to 45 ATMs in 2017, on average. However this remains low compared to developed countries with 21 and 63 ATMs for 100,000 people in 2004 and 2017, respectively.
Figure 1. Financial inclusion over time
9 See Prichard et al. (2014) and Caldeira et al. (2020) for further discussion.
9
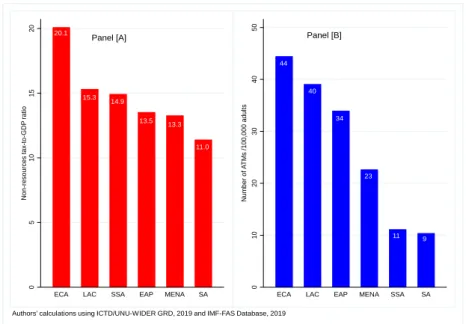
Figure 2 depicts countries’ tax collection performance measured by the non-resource tax-to-GDP ratio as well as the level of financial access proxied by the number of ATMs per 100,000 adults across regions (Panel [A] and [B], respectively). It emerges that Europe and Central Asia (ECA) and Latin America and Caribbean (LAC) countries have the higher level of financial access in the sample, with on average 44 and 40 ATMs for 100,000 adults, respectively. In the same time, those countries appear to be the top performers in terms of tax revenue collection with a non-resource tax-to-GDP ratio of 20.1 and 15.3 per cent on average, respectively. In
Figure 2. Non-resource tax-to-GDP ratio and ATMs, by region (average values)
Note: ECA= Europe and Central Asia; LAC= Latin America & Caribbean; SSA= Sub-Saharan Africa; EAP: East Asia & Pacific; MENA=Middle East and North Africa; SA= South Asia.
0 1 0 2 0 3 0 4 0 5 0 A T M s / 1 0 0 ,0 0 0 2004 2005 2006 2007 2008 2009 2010 2011 2012 2013 2014 2015 2016 2017 Authors' calculations using IMF-FAS Database, 2019
Panel [A] 11.0 13.3 13.5 14.9 15.3 20.1 0 5 1 0 1 5 2 0 N o n -r e s o u rc e s t a x-to -G D P r a ti o
ECA LAC SSA EAP MENA SA
Panel [B] 9 11 23 34 40 44 0 1 0 2 0 3 0 4 0 5 0 N u m b e r o f A T M s / 1 0 0 ,0 0 0 a d u lt s
ECA LAC EAP MENA SSA SA
10
contrast, it comes out that the level of accessing to financial services is very low in South Asia (SA) and Sub-Saharan Africa (SSA) countries with on average, 9 and 11 ATMs for 100,000 adults, respectively. SA is the lower performer region of the sample in terms of tax revenue raising, with an average tax-to-GDP ratio of 11.9. SSA countries have been making tremendous efforts to collect tax revenue (14.9 percent of GDP on average) over recent years as a result of important tax policy and administration reforms (Mansour and Rota-Graziosi, 2013; Ebeke et al., 2016) but still have room for greater tax collection. For instance, Caldeira et al, (2020)
stressed that SSA countries could raise up to 22.75 percent of GDP in non-resource taxes if they fully exploit their tax potential.
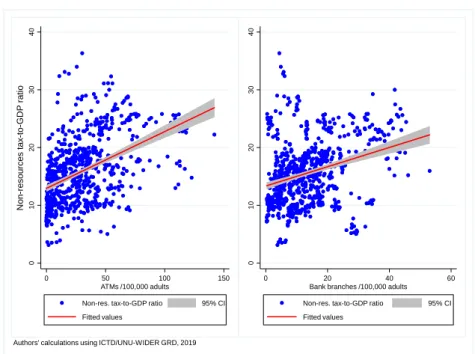
In figure 3 we provide the correlation between to financial access indicators –the number of ATMs and branches per 100,000 adults11– and the total non-resource tax-to-GDP ratio. It clearly appears that more access to financial services is associated with greater tax revenue mobilization.
Figure 3. Correlation between the number of ATMs and branches and non-resource tax ratio
III. Results
A. Baseline results
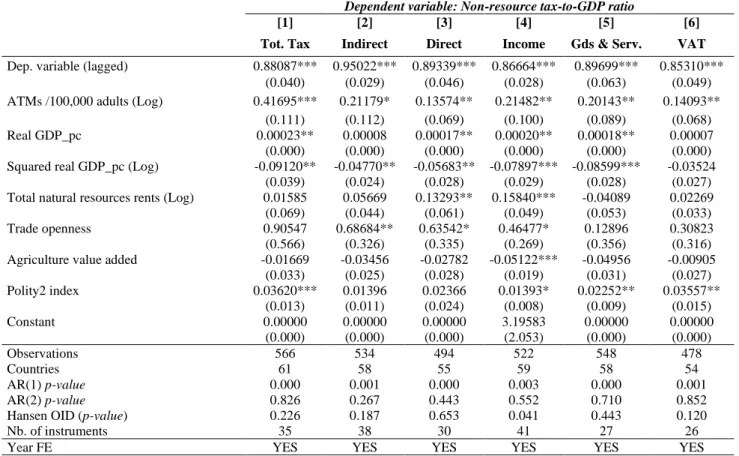
Table 1 reports the system GMM-based estimates of the effect of financial inclusion on the non-resource tax-to-GDP ratio in developing countries as specified in equation [1]. Column [1] show
11 Note that these two indicators have been adopted by the international community to monitor target 8.10 of 2030
Sustainable Development Goals (SDGs) which aims at strengthening the capacity of domestic financial institutions to encourage and expand access to banking, insurance and financial services for all.
0 1 0 2 0 3 0 4 0 N o n -r e s o u rc e s t a x -t o -G D P r a ti o 0 50 100 150 ATMs /100,000 adults
Non-res. tax-to-GDP ratio 95% CI Fitted values 0 1 0 2 0 3 0 4 0 0 20 40 60
Bank branches /100,000 adults Non-res. tax-to-GDP ratio 95% CI Fitted values
11
the results for total non-resources tax ratio, while remaining columns (Columns [2]-[6]) display the results for different tax revenue subcomponents as mentioned above.
Resorting to the number of ATMs as a proxy for access to financial services, our empirical results evidence a positive relationship between financial inclusion and non-resources tax revenue. The coefficient associated with financial inclusion is positive and statistically significant at 1% level for total non-resource tax (Column [1]). In addition, The p-values of the Hansen test and the Arellano–Bond tests for serial correlation (AR(1) and AR(2)) are reported at the bottom of the table and confirm all the validity of our econometric approach.12 Our results are in line with previous studies (Oz-Yalaman, 2019).
Regarding, the composition of tax revenue, the results also support a positive relationship between financial access and all subcomponents of total tax revenue (Column [2]-[6]). More specifically, the coefficient associated with financial inclusion is more sizeable for indirect taxes (Column [2]) compared to the one for direct taxes (Column [3]). This might suggests that more access to financial services allows for greater total tax revenue mobilization through an increased consumption and thereby more consumption taxes to collect. This is confirmed by the positive and statistically positive coefficient of financial inclusion on taxes on goods and services (Column [5]), as well as on valued-added taxes (Column [6]).
Turning to the control variables, the results indicate that the level of development measured by the real GDP per capita and the quality of the institution appear to be relevant determinants of non-resources tax ratio in developing countries and are positively and significantly associated with tax ratio. These findings are consistent with previous evidences (Pessino and Fenochietto, 2010; Fenochietto and Pessino, 2013; Crivelli and Gupta, 2014; Davoodi and Grigorian, 2007);
Gupta, 2007;Gordon and Li, 2009;Clist and Morrissey, 2011;Fenochietto and Pessino, 2013; Feger and Asafu-Adjaye, 2014) that countries’ tax capacity is related to their level of development and good quality of institution is favorable to greater tax revenue collection. The results also confirm our hypothesis of non-linearity between the level of development and the capacity captured by the negative a significant coefficient associated with the squared of real GDP per capita. In line with previous findings (Tanzi, 1992; Stotsky and WoldeMariam, 2006; Bornhorst et al., 2009; Pessino and Fenochietto, 2010; McGuirk, 2013; Crivelli and Gupta, 2014), natural resources rents, trade openness and agriculture value-added are also determining
12
factors of non-resources tax subcomponents (columns [2], [3] an [4]), while they appear to be non-significant on the total tax ratio.
Table 1. Baseline results
Dependent variable: Non-resource tax-to-GDP ratio
[1] [2] [3] [4] [5] [6]
Tot. Tax Indirect Direct Income Gds & Serv. VAT
Dep. variable (lagged) 0.88087*** 0.95022*** 0.89339*** 0.86664*** 0.89699*** 0.85310***
(0.040) (0.029) (0.046) (0.028) (0.063) (0.049)
ATMs /100,000 adults (Log) 0.41695*** 0.21179* 0.13574** 0.21482** 0.20143** 0.14093**
(0.111) (0.112) (0.069) (0.100) (0.089) (0.068)
Real GDP_pc 0.00023** 0.00008 0.00017** 0.00020** 0.00018** 0.00007
(0.000) (0.000) (0.000) (0.000) (0.000) (0.000)
Squared real GDP_pc (Log) -0.09120** -0.04770** -0.05683** -0.07897*** -0.08599*** -0.03524
(0.039) (0.024) (0.028) (0.029) (0.028) (0.027)
Total natural resources rents (Log) 0.01585 0.05669 0.13293** 0.15840*** -0.04089 0.02269
(0.069) (0.044) (0.061) (0.049) (0.053) (0.033)
Trade openness 0.90547 0.68684** 0.63542* 0.46477* 0.12896 0.30823
(0.566) (0.326) (0.335) (0.269) (0.356) (0.316)
Agriculture value added -0.01669 -0.03456 -0.02782 -0.05122*** -0.04956 -0.00905
(0.033) (0.025) (0.028) (0.019) (0.031) (0.027) Polity2 index 0.03620*** 0.01396 0.02366 0.01393* 0.02252** 0.03557** (0.013) (0.011) (0.024) (0.008) (0.009) (0.015) Constant 0.00000 0.00000 0.00000 3.19583 0.00000 0.00000 (0.000) (0.000) (0.000) (2.053) (0.000) (0.000) Observations 566 534 494 522 548 478 Countries 61 58 55 59 58 54 AR(1) p-value 0.000 0.001 0.000 0.003 0.000 0.001 AR(2) p-value 0.826 0.267 0.443 0.552 0.710 0.852
Hansen OID (p-value) 0.226 0.187 0.653 0.041 0.443 0.120
Nb. of instruments 35 38 30 41 27 26
Year FE YES YES YES YES YES YES
*, **, and *** denote statistical significance at 10 percent, 5 percent, and 1 percent level, respectively. Standard errors are reported in brackets. Note: The number of instruments is strongly limited-starting with the second lag of the dependent variable and the first lag of the control variables- to avoid the over-fitting problem. In all specifications, the null hypothesis for lack of first-order (AR(1)) serial correlation in the first-differenced error terms is rejected, while not rejected for the second-order (AR(2)). In addition, the robust (to heteroskedasticity and autocorrelation) Hansen’s p-value validates the over-identification restrictions. All of these statistical tests validate the econometric method and the lagged variables can be safely used as instruments. This applies for all regressions in the paper
B. Transmission channel
In this section explore the main channels through which financial inclusion influences non-resource tax ratio. As stressed above, financial inclusion leads to increased household consumption and business development. Relying on this literature, we expect financial inclusion to affect tax revenue through an increased business development and private consumption. Easy access to financial services allow both households and firms (e.g. SMEs) with credit facilities to finance productive investments and increase consumption which in turn generate both, income13 and consumption taxes and for public sector. In addition, financial inclusion would positively affect tax revenue through business development based on the
13
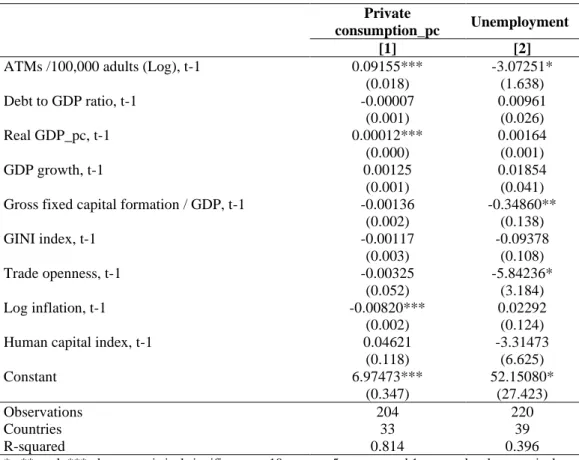
rational that business expansion is associated with job creation14 (i.e. decrease in unemployment rate) and income generation for households, thereby income taxes to collect. We proxy the households consumption by the private consumption per capita, while the business development induced-effect of financial inclusion is captured through the unemployment rate. However, since these transmission channels might be direct or indirect, we proceeded in two steps: first, we estimate the effects of financial access on each channel, then we estimate the effects of each variable on the total non-resource tax ratio.15
The first step estimation results are reported in Tables 2. The results show that more access to financial services is associated with greater private consumption (column [1]) and lower unemployment rate (column [2]), confirming previous findings.
Table 2. Transmission channels
Private
consumption_pc Unemployment
[1] [2]
ATMs /100,000 adults (Log), t-1 0.09155*** -3.07251* (0.018) (1.638) Debt to GDP ratio, t-1 -0.00007 0.00961 (0.001) (0.026) Real GDP_pc, t-1 0.00012*** 0.00164 (0.000) (0.001) GDP growth, t-1 0.00125 0.01854 (0.001) (0.041) Gross fixed capital formation / GDP, t-1 -0.00136 -0.34860**
(0.002) (0.138) GINI index, t-1 -0.00117 -0.09378 (0.003) (0.108) Trade openness, t-1 -0.00325 -5.84236* (0.052) (3.184) Log inflation, t-1 -0.00820*** 0.02292 (0.002) (0.124)
Human capital index, t-1 0.04621 -3.31473
(0.118) (6.625) Constant 6.97473*** 52.15080* (0.347) (27.423) Observations 204 220 Countries 33 39 R-squared 0.814 0.396
*, **, and *** denote statistical significance at 10 percent, 5 percent, and 1 percent level, respectively. Robust standard errors are reported in brackets. Note: fixed effects are included
14Teima et al. (2010) highlighted that SMEs contribute up to 45 percent of employment in developing countries.
15 An alternative popular approach in the literature to test whether the effect of financial inclusion on non-resource
tax-to-GDP ratio would transmit through the considered channels, consists to run our baseline regression interacting the financial inclusion indicator with each transmission channel (see e.g. Caballero, 2016; Compaore
et al., 2020 among other). If the coefficients associated with financial inclusion indicator works out to be non-significant when the interactive terms and the transmission channels are included, we then conclude that the effect financial inclusion on tax revenue can be assumed to operate through private consumption and job creation as a results of business development and expansion. Based on this approach, the results also confirm our hypothesis and are available upon request.
14
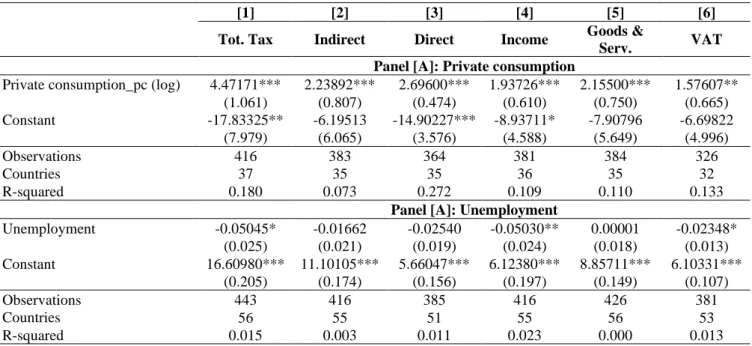
In Table 3, we report the results of the effect of the transmission channels on our tax variable. In line with our main hypothesis, households private consumption is positively and significantly associated with total non-resources tax ratio, as well as different tax subcomponents (Panel [A], columns [1]-[6]). Greater private consumption generates important consumption tax revenue to collect including value-added tax. It is worth noting that value-added tax has become one of the most important tools of revenue mobilization in the developing world with about one-quarter of total tax revenue is raised through value-added tax. (Keen and Lockwood, 2006, 2016Gerard and Naritomi, 2018). Value-added tax also presents the advantage to be less distortionary in addition to its self-enforcing properties (Kopczuk and Slemrod, 2006).
In Panel [B] of Table 3, we present the results using the unemployment rate. It emerges that the unemployment rate is negatively link to total tax ratio (column [1]), as well as income taxes and value-added tax (columns [1] and [6], respectively). Financial inclusion reduces unemployment by increasing business and enhancing income-generating activities, hence providing opportunities to collect income taxes both on individuals and corporates.
Overall, our results confirm that financial inclusion is conducive to greater tax revenue collection through private consumption and business expansion.
Table 3. Effects of transmission channel variables on tax revenue variable
[1] [2] [3] [4] [5] [6]
Tot. Tax Indirect Direct Income Goods &
Serv. VAT
Panel [A]: Private consumption
Private consumption_pc (log) 4.47171*** 2.23892*** 2.69600*** 1.93726*** 2.15500*** 1.57607** (1.061) (0.807) (0.474) (0.610) (0.750) (0.665) Constant -17.83325** -6.19513 -14.90227*** -8.93711* -7.90796 -6.69822 (7.979) (6.065) (3.576) (4.588) (5.649) (4.996) Observations 416 383 364 381 384 326 Countries 37 35 35 36 35 32 R-squared 0.180 0.073 0.272 0.109 0.110 0.133
Panel [A]: Unemployment
Unemployment -0.05045* -0.01662 -0.02540 -0.05030** 0.00001 -0.02348* (0.025) (0.021) (0.019) (0.024) (0.018) (0.013) Constant 16.60980*** 11.10105*** 5.66047*** 6.12380*** 8.85711*** 6.10331*** (0.205) (0.174) (0.156) (0.197) (0.149) (0.107) Observations 443 416 385 416 426 381 Countries 56 55 51 55 56 53 R-squared 0.015 0.003 0.011 0.023 0.000 0.013
*, **, and *** denote statistical significance at 10 percent, 5 percent, and 1 percent level, respectively. Robust standard errors are reported in brackets. Note: fixed effects are included
15
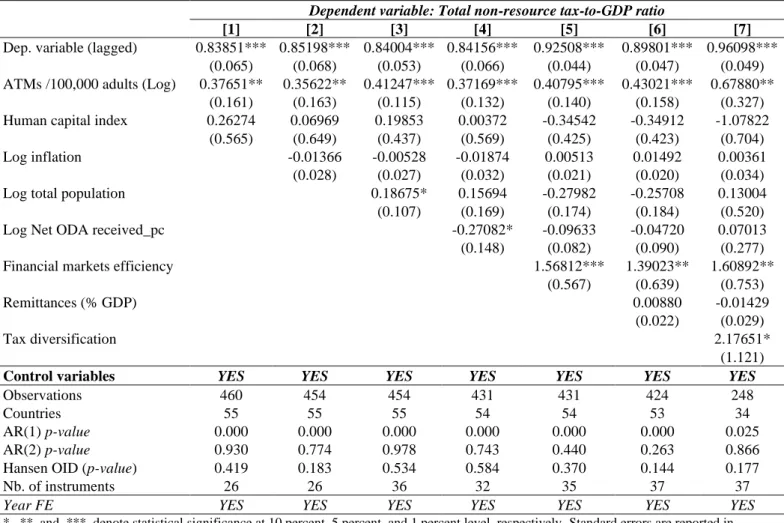
In this section, we undertake three robustness exercises to check the validity of our findings. First, we test the sensitivity of the results from the baseline specification to additional control variables, including the level of education, inflation, the population size, external aid received, domestic financial sector development, remittances inflows and the tax structure.16
Higher level of education is expected to increase tax compliance. Similarly, a large population, a well-functioning financial sector and remittances flows received are positively associated with tax ratio, while higher inflation episodes and external assistance are negatively linked to tax collection capacity.
Table 4. Robustness check: adding more control variable
Dependent variable: Total non-resource tax-to-GDP ratio
[1] [2] [3] [4] [5] [6] [7]
Dep. variable (lagged) 0.83851*** 0.85198*** 0.84004*** 0.84156*** 0.92508*** 0.89801*** 0.96098*** (0.065) (0.068) (0.053) (0.066) (0.044) (0.047) (0.049) ATMs /100,000 adults (Log) 0.37651** 0.35622** 0.41247*** 0.37169*** 0.40795*** 0.43021*** 0.67880**
(0.161) (0.163) (0.115) (0.132) (0.140) (0.158) (0.327) Human capital index 0.26274 0.06969 0.19853 0.00372 -0.34542 -0.34912 -1.07822
(0.565) (0.649) (0.437) (0.569) (0.425) (0.423) (0.704)
Log inflation -0.01366 -0.00528 -0.01874 0.00513 0.01492 0.00361
(0.028) (0.027) (0.032) (0.021) (0.020) (0.034)
Log total population 0.18675* 0.15694 -0.27982 -0.25708 0.13004
(0.107) (0.169) (0.174) (0.184) (0.520)
Log Net ODA received_pc -0.27082* -0.09633 -0.04720 0.07013
(0.148) (0.082) (0.090) (0.277)
Financial markets efficiency 1.56812*** 1.39023** 1.60892**
(0.567) (0.639) (0.753)
Remittances (% GDP) 0.00880 -0.01429
(0.022) (0.029)
Tax diversification 2.17651*
(1.121)
Control variables YES YES YES YES YES YES YES
Observations 460 454 454 431 431 424 248
Countries 55 55 55 54 54 53 34
AR(1) p-value 0.000 0.000 0.000 0.000 0.000 0.000 0.025
AR(2) p-value 0.930 0.774 0.978 0.743 0.440 0.263 0.866
Hansen OID (p-value) 0.419 0.183 0.534 0.584 0.370 0.144 0.177
Nb. of instruments 26 26 36 32 35 37 37
Year FE YES YES YES YES YES YES YES
*, **, and *** denote statistical significance at 10 percent, 5 percent, and 1 percent level, respectively. Standard errors are reported in brackets. Note:Constant terms, as well as vector X variables are included but not reported for space purpose. Complete tables are available upon request.
Results are reported in Table 4 and are similar to baseline findings. The coefficients associated to the population size, financial sector development and tax diversification index are positive and significant (columns [3], [5] and [7], respectively). A large population constitutes a
16 These variables are considered in the literature as possible determinants of tax revenue (see e.g. Tanzi, 1977,
Gupta et al. 2014, Gordon and Li, 2009, Pessino and Fenochietto, 2010, Clist and Morrissey 2011, Ebeke, 2011,
16
potential for tax collection. In addition, a well-developed financial sector combined with a greater access to credit allow individuals and corporates to finance profitable projects, which in turn favor tax contribution. Having a diversified tax base is associated with greater tax revenue collection. The results also show that inflation harms tax revenue mobilization (column [4]), corroborating the Tanzi effect.
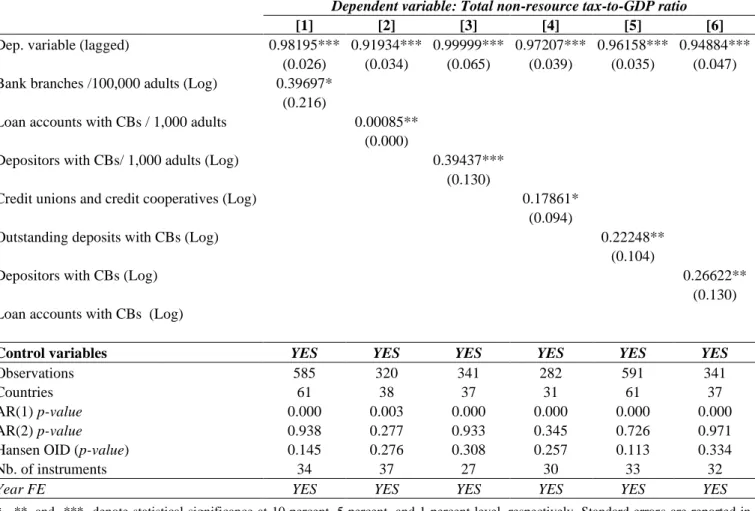
Second, up to now, we used the number of ATMs per 100,000 adults to measure financial inclusion in developing countries. However, financial inclusion is a multifaceted concept which encompasses various dimensions (Espinosa-Vega et al., 2020). In addition, the mode of accessing to financial services varies by country and is changing over time For instance, developing countries are increasingly shifting from traditional banking toward digital banking and finance with an important use of mobile money. Hence, relying on traditional banking may poorly capture the real state of financial inclusion.17 Furthermore, as stressed in Coulibaly and Yogo (2019), ATMs as well as bank branches in developing countries may be unevenly distributed within countries and tend to be more often concentrated in large cities (Guerineau and Jacolin, 2014). Hence, people in rural areas will not get access to financial services. Finally, our baseline financial inclusion measure does take into account microfinance institutions (MFIs), credit unions or financial cooperatives which play a pivotal role in providing financial services in developing countries. We therefore paid a particular attention to these shortcomings by consider several alternative indicators to capture financial access in a more comprehensive way. The results are reported in Table A4 and overall, they support those presented in Table 1. We finally exploit an alternative data source to test the validity of our findings. As mentioned above, several tax data sources have been used in the literature. In this robustness exercise, we use the IMF’s GFS tax database which also provides detailed classification of government’s tax revenues. Table A5 of appendices reports the estimation results. The results show that the coefficients associated financial inclusion are positive and strongly significant at the 1 percent level for total tax revenue (column [1]) and some tax subcomponents (columns [3], [4] and [6]). Therefore, our baseline findings remain valid.
IV. Conclusion
In this paper, we empirically examined the relationship between access to financial services and non-resources tax-to-GDP ratio in developing countries. Relying on the popular system-GMM
17 We point out this point but data scarcity do not allow us include a financial inclusion indicator capturing mobile
17
estimator of Blundell and Bond (1998), this paper is the first, to the best of our knowledge, to take into account the inertia in the tax revenue ratio and the possible endogeneity of financial inclusion as well all control variables. Based on a panel data of 62 developing countries over the period 2004-2017, the paper finds that financial inclusion is positively and significantly associated with non-resources tax revenue. Exploring the effect on the tax structure, the results show that access to financial services has more sizeable effect on indirect taxes than the rest of total tax subcomponents. Our paper also provided empirical evidence that financial inclusion is inducive to greater tax revenue mainly through increased private consumption and business expansion. Furthermore, in line with previous evidence, our results show that the level of development as well as the quality of institutions are important determinants of tax ratio and are positively associated with tax revenue performance in developing countries. However the relationship between the level of overall development turns out to be non-linear, suggesting the existence of a tipping point.
In terms of policy recommendation, our study concurs with previous findings and call for an improved and greater access to financial services. In view of the pressing financing needs to finance structural investments in the developing world, our paper provides insights to countries that have implemented or are in the process of implementing financial inclusion policies, on tax resources harnessing opportunities from better access to financial services. In addition, in the current particular context of coronavirus (Covid-19) pandemic causing severe economic despair across the world and requiring important financial resources for a timely and appropriate response, unlocking access to financial services will help to better cope with the income shock and smooth households consumption.
18
References
Agbeyegbe, Terence D., Janet Stotsky, and Asegedech WoldeMariam. 2006. “Trade Liberalization, Exchange Rate Changes, and Tax Revenue in Sub-Saharan Africa.”
Journal of Asian Economics 17 (2): 261–284.
Allen, Franklin, Asli Demirguc-Kunt, Leora Klapper, and Maria Soledad Martinez Peria. 2016. “The Foundations of Financial Inclusion: Understanding Ownership and Use of Formal Accounts.” Journal of Financial Intermediation 27 (July): 1–30.
https://doi.org/10.1016/j.jfi.2015.12.003.
Angelucci, Manuela, Dean Karlan, and Jonathan Zinman. 2015. “Microcredit Impacts: Evidence from a Randomized Microcredit Program Placement Experiment by Compartamos Banco.” American Economic Journal: Applied Economics 7 (1): 151–82.
https://doi.org/10.1257/app.20130537.
Aportela, Fernando. 1998. “Effect of Financial Access on Savings by Low-Income People.” MIT Economic Department.
Ashraf, Nava, Dean Karlan, and Wesley Yin. 2010. “Female Empowerment: Impact of a Commitment Savings Product in the Philippines.” World Development 38 (3): 333–44.
https://doi.org/10.1016/j.worlddev.2009.05.010.
Attanasio, Orazio, Britta Augsburg, Ralph de Haas, Emla Fitzsimons, and Heike Harmgart. 2014. “Group Lending or Individual Lending? Evidence from a Randomised Field Experiment in Mongolia.” Working Paper SP II 2014-303. WZB Discussion Paper.
https://www.econstor.eu/handle/10419/93060.
Augsburg, Britta, Ralph De Haas, Heike Harmgart, and Costas Meghir. 2015. “The Impacts of Microcredit: Evidence from Bosnia and Herzegovina.” American Economic Journal:
Applied Economics 7 (1): 183–203. https://doi.org/10.1257/app.20130272.
Banerjee, Abhijit, Esther Duflo, Rachel Glennerster, and Cynthia Kinnan. 2015. “The Miracle of Microfinance? Evidence from a Randomized Evaluation.” American Economic
Journal: Applied Economics 7 (1): 22–53. https://doi.org/10.1257/app.20130533. Bangko Sentral ng Pilipinas (BSP). 2015. “National Strategy for Financial Inclusion.” Manila. Belinga, Vincent, Maximillien Kaffo Melou, and Jean-Pascal Nganou. 2017. Does Oil Revenue
Crowd Out Other Tax Revenues? Policy Lessons for Uganda. The World Bank.
Benedek, Dora, Ernesto Crivelli, Priscilla Muthoora, and Sanjeev Gupta. 2012. “Foreign Aid and Revenue: Still a Crowding Out Effect?”, International Monetary Fund Working Paper 12/186, Washington D.C.
Blundell, Richard, and Stephen Bond. 1998. “Initial Conditions and Moment Restrictions in Dynamic Panel Data Models.” Journal of Econometrics 87 (1): 115–143.
Bornhorst, Fabian, Sanjeev Gupta, and John Thornton. 2009. “Natural Resource Endowments and the Domestic Revenue Effort.” European Journal of Political Economy 25 (4): 439– 46. https://doi.org/10.1016/j.ejpoleco.2009.01.003.
Bruhn, Miriam, and Inessa Love. 2014. “The Real Impact of Improved Access to Finance: Evidence from Mexico.” The Journal of Finance 69 (3): 1347–76.
https://doi.org/10.1111/jofi.12091.
Burgess, Robin, and Rohini Pande. 2005. “Do Rural Banks Matter? Evidence from the Indian Social Banking Experiment.” American Economic Review 95 (3): 780–95.
https://doi.org/10.1257/0002828054201242.
Burgess, Robin, Rohini Pande, and Grace Wong. 2005. “Banking for the Poor: Evidence from India.” Journal of the European Economic Association 3 (2–3): 268–78.
https://doi.org/10.1162/jeea.2005.3.2-3.268.
Caballero, Julián A. 2016. “Do Surges in International Capital Inflows Influence the Likelihood of Banking Crises?” The Economic Journal 126 (591): 281–316.
Rota-19
Graziosi. 2020. “Tax Effort in Sub-Saharan African Countries : Evidence from a New Dataset.” Études et Documents, N° 2, CERDI. https://hal.uca.fr/hal-02543162.
Chelliah, Raja J., Hessel J. Baas, and Margaret R. Kelly. 1975. “Tax Ratios and Tax Effort in Developing Countries, 1969-71.” Staff Papers 22 (1): 187–205.
Clist, Paul, and Oliver Morrissey. 2011. “Aid and Tax Revenue: Signs of a Positive Effect since the 1980s.” Journal of International Development 23 (2): 165–180.
Compaore, Ali, Montfort Mlachila, Rasmané Ouedraogo, and Sandrine Sourouema. 2020. “The Impact of Conflict and Political Instability on Banking Crises in Developing Countries.” International Monetary Fund Working Papers WP/20/94. Washington, D.C.
Compaoré, Ali, Rasmané Ouedraogo, Moussé Sow, and René Tapsoba. 2020. “Fiscal Resilience Building: Insights from a New Tax Revenue Diversification Index.” International Monetary Fund Working Papers WP/20/41. Washington, D.C.
Coulibaly, Aïssata, and Urbain Thierry Yogo. 2020. “The Path to Shared Prosperity: Leveraging Financial Services Outreach to Create Decent Jobs in Developing Countries.” Economic Modelling 87: 131–147.
Crivelli, Ernesto, and Sanjeev Gupta. 2014. “Resource Blessing, Revenue Curse? Domestic Revenue Effort in Resource-Rich Countries.” European Journal of Political Economy 35 (September): 88–101. https://doi.org/10.1016/j.ejpoleco.2014.04.001.
Dabla-Norris, Era, Yixi Deng, Anna Ivanova, Izabela Karpowicz, D. Filiz Unsal, Eva VanLeemput, and Joyce Wong. 2015. Financial Inclusion: Zooming in on Latin
America. 15–206. International Monetary Fund.
Dabla-Norris, Era, Yan Ji, Robert Townsend, and D. Filiz Unsal. 2015. Identifying Constraints
to Financial Inclusion and Their Impact on GDP and Inequality: A Structural Framework for Policy. 15–22. International Monetary Fund.
De Gregorio, José. 1996. “Borrowing Constraints, Human Capital Accumulation, and Growth.”
Journal of Monetary Economics 37 (1): 49–71.
Demirguc-Kunt, Asli, Thorsten Beck, and Patrick Honohan. 2007. “Finance for All?: Policies and Pitfalls in Expanding Access.” The World Bank.
Demirguc-Kunt, Asli, Leora Klapper, Dorothe Singer, and Peter Van Oudheusden. 2015. The
Global Findex Database 2014: Measuring Financial Inclusion around the World.
Policy Research Working Papers. The World Bank. https://doi.org/10.1596/1813-9450-7255.
Dupas, Pascaline, and Jonathan Robinson. 2013. “Savings Constraints and Microenterprise Development: Evidence from a Field Experiment in Kenya.” American Economic
Journal: Applied Economics 5 (1): 163–92. https://doi.org/10.1257/app.5.1.163. Ebeke, Christian Hubert. 2011. “Remittances, Value Added Tax and Tax Revenue in
Developing Countries,” Etudes et Documents n°30: 27, CERDI.
Ebeke, Christian, Mario Mansour, and Grégoire Rota-Graziosi. 2016. “The Power to Tax in Sub-Saharan Africa: LTUs, VATs, and SARAs.” Ferdi Working paper P154, June 2016.
https://ideas.repec.org/p/hal/wpaper/halshs-01332049.html.
Eltony, M. Nagy. 2002. “Measuring Tax Effort in Arab Countries.” In . Economic Research Forum for the Arab Countries, Iran & Turkey.
Espinosa-Vega, Marco A., Kazuko Shirono, Hector Carcel Villanova, Esha Chhabra, Bidisha Das, and Yingjie Fan. 2020. “Measuring Financial Access; 10 Years of the IMF Financial Access Survey.” 20/08. IMF Departmental Papers / Policy Papers. IMF Departmental Papers / Policy Papers. International Monetary Fund.
https://ideas.repec.org/p/imf/imfdep/20-08.html.
Fareed, Fozan, Mabel Gabriel, Patrick Lenain, and Julien Reynaud. 2017. “Financial Inclusion and Women Entrepreneurship: Evidence from Mexico.” Documents de travail du
20 https://doi.org/10.1787/2fbd0f35-en.
Feger, Thuto, and John Asafu-Adjaye. 2014. “Tax Effort Performance in Sub-Sahara Africa and the Role of Colonialism.” Economic Modelling 38: 163–174.
Fenochietto, Ricardo, and Carola Pessino. 2013. Understanding Countries’ Tax Effort. 13–244. International Monetary Fund.
Gérard, François, and Joana Naritomi. 2018. “Value Added Tax in Developing Countries: Lessons from Recent Research.” IGC Growth Brief Series 15.
Gnangnon, Sèna Kimm, and Jean-François Brun. 2018. “Impact of Bridging the Internet Gap on Public Revenue Mobilization.” Information Economics and Policy 43: 23–33. Gordon, Roger, and Wei Li. 2009. “Tax Structures in Developing Countries: Many Puzzles and
a Possible Explanation.” Journal of Public Economics 93 (7–8): 855–866.
Grace, Dave, Jane Hwang, and Alfonso Garcia Mora. 2014. “Paraguay-National Financial Inclusion Strategy 2014-2018.” The World Bank.
Grigorian, David A., and Hamid Reza Davoodi. 2007. Tax Potential vs. Tax Effort: A
Cross-Country Analysis of Armenia’s Stubbornly Low Tax Collection. 7–106. International
Monetary Fund.
Guérineau, Samuel, and Luc Jacolin. 2014. “L’inclusion Financière En Afrique Subsaharienne: Faits Stylisés et Déterminants.” Revue d’économie Financière, no. 4: 57–80.
Gupta, Abhijit Sen. 2007. Determinants of Tax Revenue Efforts in Developing Countries. 7– 184. International Monetary Fund.
Han, Rui, and Martin Melecky. 2013. Financial Inclusion for Financial Stability: Access to Bank Deposits and the Growth of Deposits in the Global Financial Crisis. Policy Research Working Papers. The World Bank. https://doi.org/10.1596/1813-9450-6577. Honohan, Patrick. 2004a. “Financial Development, Growth and Poverty: How Close Are The
Links?” World Bank Policy Research Working Paper 3203.
———. 2004b. Financial Sector Policy and the Poor: Selected Findings and Issues. World Bank Working Paper, n°.43. Washington, D.C: World Bank.
———. 2005. Measuring Microfinance Access : Building On Existing Cross-Country Data. Policy Research Working Papers. The World Bank. https://doi.org/10.1596/1813-9450-3606.
———. 2006. Household Financial Assets In The Process Of Development. Policy Research Working Papers. The World Bank. https://doi.org/10.1596/1813-9450-3965.
Jahan, Sarwat, Jayendu De, Fazurin Jamaludin, Piyaporn Sodsriwiboon, and Cormac Sullivan. 2019. The Financial Inclusion Landscape in the Asia-Pacific Region: A Dozen Key
Findings. International Monetary Fund.
James, Alexander. 2015. “US State Fiscal Policy and Natural Resources.” American Economic
Journal: Economic Policy 7 (3): 238–57.
Karlan, Dean, and Jonathan Zinman. 2010. “Expanding Credit Access: Using Randomized Supply Decisions to Estimate the Impacts.” The Review of Financial Studies 23 (1): 433–64. https://doi.org/10.1093/rfs/hhp092.
Keen, Michael, and Ben Lockwood. 2006. “Is the VAT a Money Machine?” National Tax
Journal, 905–928.
Kiendrebeogo, Youssouf, and Alexandru Minea. 2013. “Accès Aux Services Financiers et Réduction de La Pauvreté Dans Les PED.” Revue Économique 64 (3): 483–493. Kopczuk, Wojciech, and Joel Slemrod. 2006. “Putting Firms into Optimal Tax Theory.”
American Economic Review 96 (2): 130–134.
Leuthold, Jane H. 1991. “Tax Shares in Developing Economies a Panel Study.” Journal of
Development Economics 35 (1): 173–185.
Levine, Ross. 2004. “Finance and Growth: Theory and Evidence.” w10766. Cambridge, MA: National Bureau of Economic Research. https://doi.org/10.3386/w10766.
21
Lotz, Joergen R., and Elliott R. Morss. 1967. “Measuring ‘Tax Effort’ in Developing Countries.” Staff Papers 14 (3): 478–499.
Lusardi, Annamaria, Olivia S. Mitchell, and Vilsa Curto. 2010. “Financial Literacy among the Young.” Journal of Consumer Affairs 44 (2): 358–380.
Mansour, Mario, and Grégoire Rota-Graziosi. 2013. Tax Coordination, Tax Competition, and
Revenue Mobilization in the West African Economic and Monetary Union. 13–163.
International Monetary Fund.
Martin, Čihák, and Ratna, Sahay. 2018. “Women in Finance: An Economic Case for Gender
Equality.” IMF Blog (blog). September 19, 2018.
https://blogs.imf.org/2018/09/19/women-in-finance-an-economic-case-for-gender-equality/.
McGuirk, Eoin F. 2013. “The Illusory Leader: Natural Resources, Taxation and Accountability.” Public Choice 154 (3–4): 285–313.
Mehrotra, Aaron N., and James Yetman. 2015. “Financial Inclusion-Issues for Central Banks.”
BIS Quarterly Review March.
Nickell, Stephen. 1981. “Biases in Dynamic Models with Fixed Effects.” Econometrica:
Journal of the Econometric Society, 1417–1426.
Oz-Yalaman, Gamze. 2019. “Financial Inclusion and Tax Revenue.” Central Bank Review 19 (3): 107–13. https://doi.org/10.1016/j.cbrev.2019.08.004.
Pessino, Carola, and Ricardo Fenochietto. 2010. “Determining Countries’ Tax Effort.”
Hacienda Pública Española/Revista de Economía Pública, 65–87.
Prichard, W., A. Cobham, and A. Goodall. 2014. “ICTD Government Revenue Dataset ICTD Working Paper 19.” Institute of Development Studies, Brighton.
Rajan, Raghuram G. 2010. Fault Lines: How Hidden Fractures Still Threaten the World
Economy. REV-Revised. Princeton University Press. https://doi.org/10.2307/j.ctt7t8d4. Rajan, Raghuram G., and Luigi Zingales. 2003. “The Great Reversals: The Politics of Financial Development in the Twentieth Century.” Journal of Financial Economics 69 (1): 5–50. Rewilak, Johan. 2017. “The Role of Financial Development in Poverty Reduction.” Review of
Development Finance 7 (2): 169–76. https://doi.org/10.1016/j.rdf.2017.10.001.
Roodman, David. 2009. “How to Do Xtabond2: An Introduction to Difference and System GMM in Stata.” The Stata Journal 9 (1): 86–136.
Rudrani Bhattacharya Ila Patnaik. 2015. Financial Inclusion, Productivity Shocks, and
Consumption Volatility in Emerging Economies. Policy Research Working Papers. The
World Bank. https://doi.org/10.1596/1813-9450-7288.
Sachs, Jeffrey D., and Andrew M. Warner. 2001. “The Curse of Natural Resources.” European
Economic Review 45 (4–6): 827–838.
Sahay, Ratna, M. Čihák, P. N’diaye, A. Barajas, R. Bi, D. Ayala, Y. Gao, A. Kyobe, L. Nguyen, and C. Saborowski. 2015. “Rethinking Financial Deepening: Stability and Growth in Emerging Markets. IMF Staff Discussion Note.” International Monetary Fund.
Stotsky, Janet Gale, and Asegedech WoldeMariam. 1997. Tax Effort in Sub-Saharan Africa. 97–107. International Monetary Fund.
Superintendencia de Banca, Seguros y AFP (SBS). 2014. “The Use of Financial Inclusion Data Country Case Study of Peru: Fine-Tuning Regulation Based on Access Indicators.” Lima
Tanzi, Vito. 1977. “Inflation, Lags in Collection, and the Real Value of Tax Revenue.” Staff
Papers 24 (1): 154–167.
———. 1983. Quantitative Characteristics of the Tax Systems of Developing Countries. IMF International Monetary Fund.
———. 1992. “Structural Factors and Tax Revenue in Developing Countries: A Decade of Evidence.”
22
Teima, Ghada, Alexander Berthaud, Miriam Bruhn, Olympia De Castro, Mukta Joshi, Melina Mirmulstein, and Andrea Onate. 2010. “Scaling-up SME Access to Financial Services in the Developing World.” The World Bank.
Wooldridge, Jeffrey M. 2002. “Econometric Analysis of Cross Section and Panel Data MIT Press.” Cambridge, MA 108.
World Bank. 2014. Global Financial Development Report 2014: Financial Inclusion. The World Bank. https://doi.org/10.1596/978-0-8213-9985-9.
–––––––––. 2018. “Overview: Financial Inclusion.” Washington, DC.
Zhang, Quanda, and Alberto Posso. 2019. “Thinking inside the Box: A Closer Look at Financial Inclusion and Household Income.” The Journal of Development Studies 55 (7): 1616– 1631.
Appendices
Table A1: Country list
Region Country Region Country
LAC Argentina ECA Albania Bolivia Armenia Brazil Azerbaijan Chile Belarus Colombia Georgia
Costa Rica Kazakhstan
Dominican Republic Kyrgyz Republic
Ecuador Macedonia El Salvador Moldova Guatemala Montenegro Honduras Russia Mexico Serbia Nicaragua Tajikistan Panama Turkey Paraguay Ukraine Peru EAP Cambodia Uruguay Indonesia Venezuela Malaysia SSA
Central African Republic Mongolia
Madagascar Philippines
Malawi Thailand
Mali Vietnam, Democratic Republic of
Namibia SA Bangladesh Niger Bhutan Nigeria India Rwanda Pakistan
Senegal Sri Lanka
South Africa MENA Egypt Togo Iran Uganda Jordan Zambia Tunisia
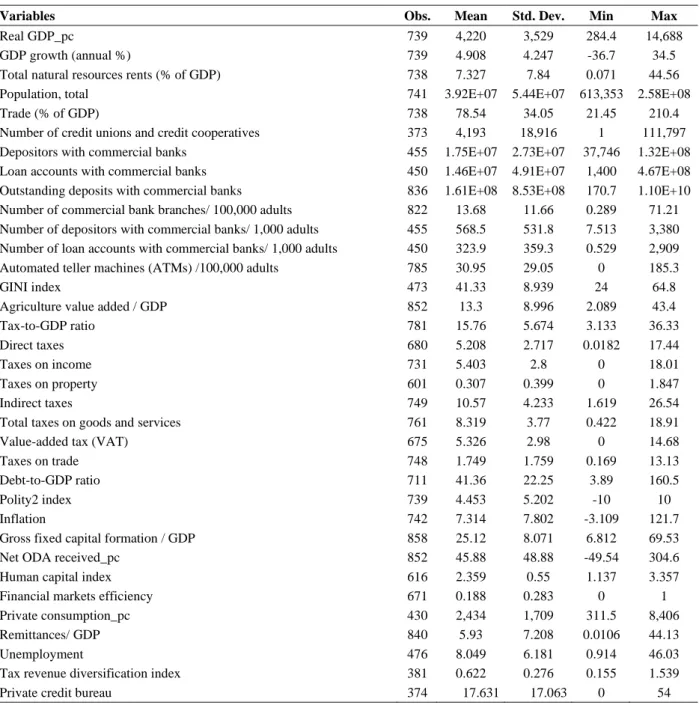
Table A2: Descriptive statistics
Variables Obs. Mean Std. Dev. Min Max
Real GDP_pc 739 4,220 3,529 284.4 14,688
GDP growth (annual %) 739 4.908 4.247 -36.7 34.5
Total natural resources rents (% of GDP) 738 7.327 7.84 0.071 44.56
Population, total 741 3.92E+07 5.44E+07 613,353 2.58E+08
Trade (% of GDP) 738 78.54 34.05 21.45 210.4
Number of credit unions and credit cooperatives 373 4,193 18,916 1 111,797
Depositors with commercial banks 455 1.75E+07 2.73E+07 37,746 1.32E+08
Loan accounts with commercial banks 450 1.46E+07 4.91E+07 1,400 4.67E+08
Outstanding deposits with commercial banks 836 1.61E+08 8.53E+08 170.7 1.10E+10
Number of commercial bank branches/ 100,000 adults 822 13.68 11.66 0.289 71.21
Number of depositors with commercial banks/ 1,000 adults 455 568.5 531.8 7.513 3,380
Number of loan accounts with commercial banks/ 1,000 adults 450 323.9 359.3 0.529 2,909
Automated teller machines (ATMs) /100,000 adults 785 30.95 29.05 0 185.3
GINI index 473 41.33 8.939 24 64.8
Agriculture value added / GDP 852 13.3 8.996 2.089 43.4
Tax-to-GDP ratio 781 15.76 5.674 3.133 36.33
Direct taxes 680 5.208 2.717 0.0182 17.44
Taxes on income 731 5.403 2.8 0 18.01
Taxes on property 601 0.307 0.399 0 1.847
Indirect taxes 749 10.57 4.233 1.619 26.54
Total taxes on goods and services 761 8.319 3.77 0.422 18.91
Value-added tax (VAT) 675 5.326 2.98 0 14.68
Taxes on trade 748 1.749 1.759 0.169 13.13
Debt-to-GDP ratio 711 41.36 22.25 3.89 160.5
Polity2 index 739 4.453 5.202 -10 10
Inflation 742 7.314 7.802 -3.109 121.7
Gross fixed capital formation / GDP 858 25.12 8.071 6.812 69.53
Net ODA received_pc 852 45.88 48.88 -49.54 304.6
Human capital index 616 2.359 0.55 1.137 3.357
Financial markets efficiency 671 0.188 0.283 0 1
Private consumption_pc 430 2,434 1,709 311.5 8,406
Remittances/ GDP 840 5.93 7.208 0.0106 44.13
Unemployment 476 8.049 6.181 0.914 46.03
Tax revenue diversification index 381 0.622 0.276 0.155 1.539
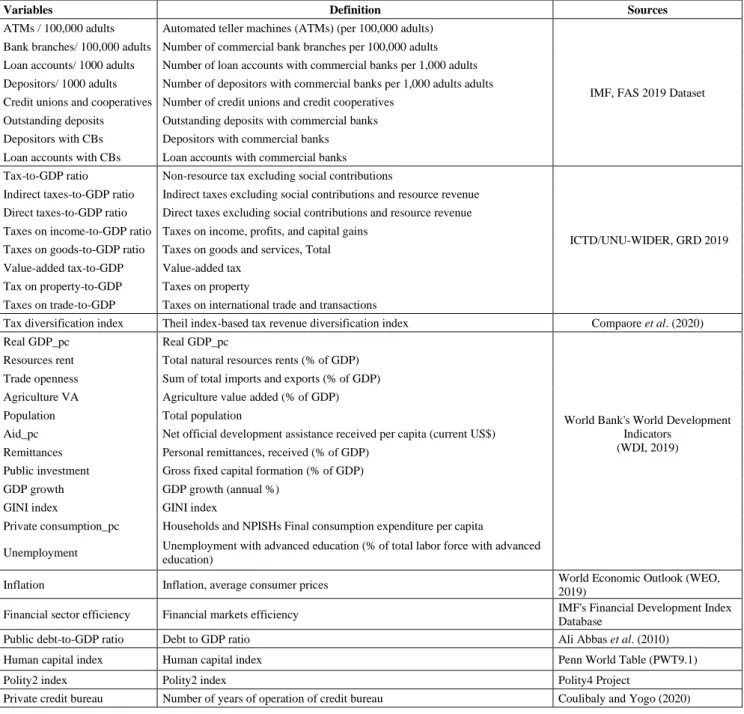
Table A3: Sources and definitions of data
Variables Definition Sources
ATMs / 100,000 adults Automated teller machines (ATMs) (per 100,000 adults)
IMF, FAS 2019 Dataset Bank branches/ 100,000 adults Number of commercial bank branches per 100,000 adults
Loan accounts/ 1000 adults Number of loan accounts with commercial banks per 1,000 adults Depositors/ 1000 adults Number of depositors with commercial banks per 1,000 adults adults Credit unions and cooperatives Number of credit unions and credit cooperatives
Outstanding deposits Outstanding deposits with commercial banks Depositors with CBs Depositors with commercial banks Loan accounts with CBs Loan accounts with commercial banks Tax-to-GDP ratio Non-resource tax excluding social contributions
ICTD/UNU-WIDER, GRD 2019 Indirect taxes-to-GDP ratio Indirect taxes excluding social contributions and resource revenue
Direct taxes-to-GDP ratio Direct taxes excluding social contributions and resource revenue Taxes on income-to-GDP ratio Taxes on income, profits, and capital gains
Taxes on goods-to-GDP ratio Taxes on goods and services, Total Value-added tax-to-GDP Value-added tax
Tax on property-to-GDP Taxes on property
Taxes on trade-to-GDP Taxes on international trade and transactions
Tax diversification index Theil index-based tax revenue diversification index Compaore et al. (2020) Real GDP_pc Real GDP_pc
World Bank's World Development Indicators
(WDI, 2019) Resources rent Total natural resources rents (% of GDP)
Trade openness Sum of total imports and exports (% of GDP) Agriculture VA Agriculture value added (% of GDP) Population Total population
Aid_pc Net official development assistance received per capita (current US$) Remittances Personal remittances, received (% of GDP)
Public investment Gross fixed capital formation (% of GDP) GDP growth GDP growth (annual %)
GINI index GINI index
Private consumption_pc Households and NPISHs Final consumption expenditure per capita
Unemployment Unemployment with advanced education (% of total labor force with advanced
education)
Inflation Inflation, average consumer prices World Economic Outlook (WEO, 2019)
Financial sector efficiency Financial markets efficiency IMF's Financial Development Index Database
Public debt-to-GDP ratio Debt to GDP ratio Ali Abbas et al. (2010) Human capital index Human capital index Penn World Table (PWT9.1)
Polity2 index Polity2 index Polity4 Project
Table A4. Robustness check: using alternative financial inclusion variables
Dependent variable: Total non-resource tax-to-GDP ratio
[1] [2] [3] [4] [5] [6]
Dep. variable (lagged) 0.98195*** 0.91934*** 0.99999*** 0.97207*** 0.96158*** 0.94884*** (0.026) (0.034) (0.065) (0.039) (0.035) (0.047) Bank branches /100,000 adults (Log) 0.39697*
(0.216)
Loan accounts with CBs / 1,000 adults 0.00085** (0.000)
Depositors with CBs/ 1,000 adults (Log) 0.39437*** (0.130)
Credit unions and credit cooperatives (Log) 0.17861* (0.094)
Outstanding deposits with CBs (Log) 0.22248**
(0.104)
Depositors with CBs (Log) 0.26622**
(0.130) Loan accounts with CBs (Log)
Control variables YES YES YES YES YES YES
Observations 585 320 341 282 591 341
Countries 61 38 37 31 61 37
AR(1) p-value 0.000 0.003 0.000 0.000 0.000 0.000
AR(2) p-value 0.938 0.277 0.933 0.345 0.726 0.971
Hansen OID (p-value) 0.145 0.276 0.308 0.257 0.113 0.334
Nb. of instruments 34 37 27 30 33 32
Year FE YES YES YES YES YES YES
*, **, and *** denote statistical significance at 10 percent, 5 percent, and 1 percent level, respectively. Standard errors are reported in brackets. Note: Constant terms, as well as vector X variables are included but not reported for space purpose. Complete tables are available upon request.
Table A5. Robustness check: using alternative tax data source
Dependent variable: Non-resource tax-to-GDP ratio
[1] [2] [3] [4] [5] [6]
Tot. Tax Indirect Direct Income Gds & Serv. VAT
Dep. variable (lagged) 0.93419*** 0.94664*** 0.72407*** 0.55052*** 0.83982*** 0.84138***
(0.054) (0.019) (0.048) (0.073) (0.043) (0.026)
ATMs /100,000 adults (Log) 0.57344*** 0.03778 0.09862*** 0.17310** 0.03613 0.09707***
(0.221) (0.038) (0.035) (0.084) (0.069) (0.038)
Real GDP_pc 0.00051** 0.00041*** 0.00004 -0.00007 0.00025*** 0.00030***
(0.000) (0.000) (0.000) (0.000) (0.000) (0.000)
Squared real GDP_pc (Log) -0.22008** -0.09573*** -0.01931 0.01345 -0.06755** -0.09786***
(0.096) (0.022) (0.035) (0.048) (0.033) (0.017)
Total natural resources rents (Log) 0.24967 -0.08976* 0.32007*** 0.41351*** -0.18594** 0.04066
(0.155) (0.047) (0.073) (0.117) (0.079) (0.038)
Trade openness 2.61191*** -0.01759 1.55332*** 1.70134*** -0.01693 0.98626***
(0.993) (0.279) (0.511) (0.383) (0.375) (0.274)
Agriculture value added -0.15356* -0.01422 -0.06269** -0.05246 -0.03955 -0.05176***
(0.082) (0.014) (0.029) (0.051) (0.034) (0.018) Polity2 index 0.05684** 0.01377 0.02256 0.00114 0.01302 0.03541*** (0.029) (0.009) (0.022) (0.021) (0.014) (0.013) Constant 1.90469 5.33194*** -3.96212 -5.64911 5.34860** 1.76028 (7.966) (1.773) (3.056) (3.996) (2.613) (1.610) Observations 431 321 320 431 421 411 Countries 52 37 37 52 52 51 AR(1) p-value 0.000 0.003 0.006 0.009 0.000 0.023 AR(2) p-value 0.234 0.213 0.858 0.241 0.370 0.581
Hansen OID (p-value) 0.121 0.290 0.249 0.766 0.176 0.377
Nb. of instruments 27 32 26 27 27 36
Year FE YES YES YES YES YES YES